Copyright
©The Author(s) 2025.
World J Gastroenterol. Aug 7, 2025; 31(29): 106895
Published online Aug 7, 2025. doi: 10.3748/wjg.v31.i29.106895
Published online Aug 7, 2025. doi: 10.3748/wjg.v31.i29.106895
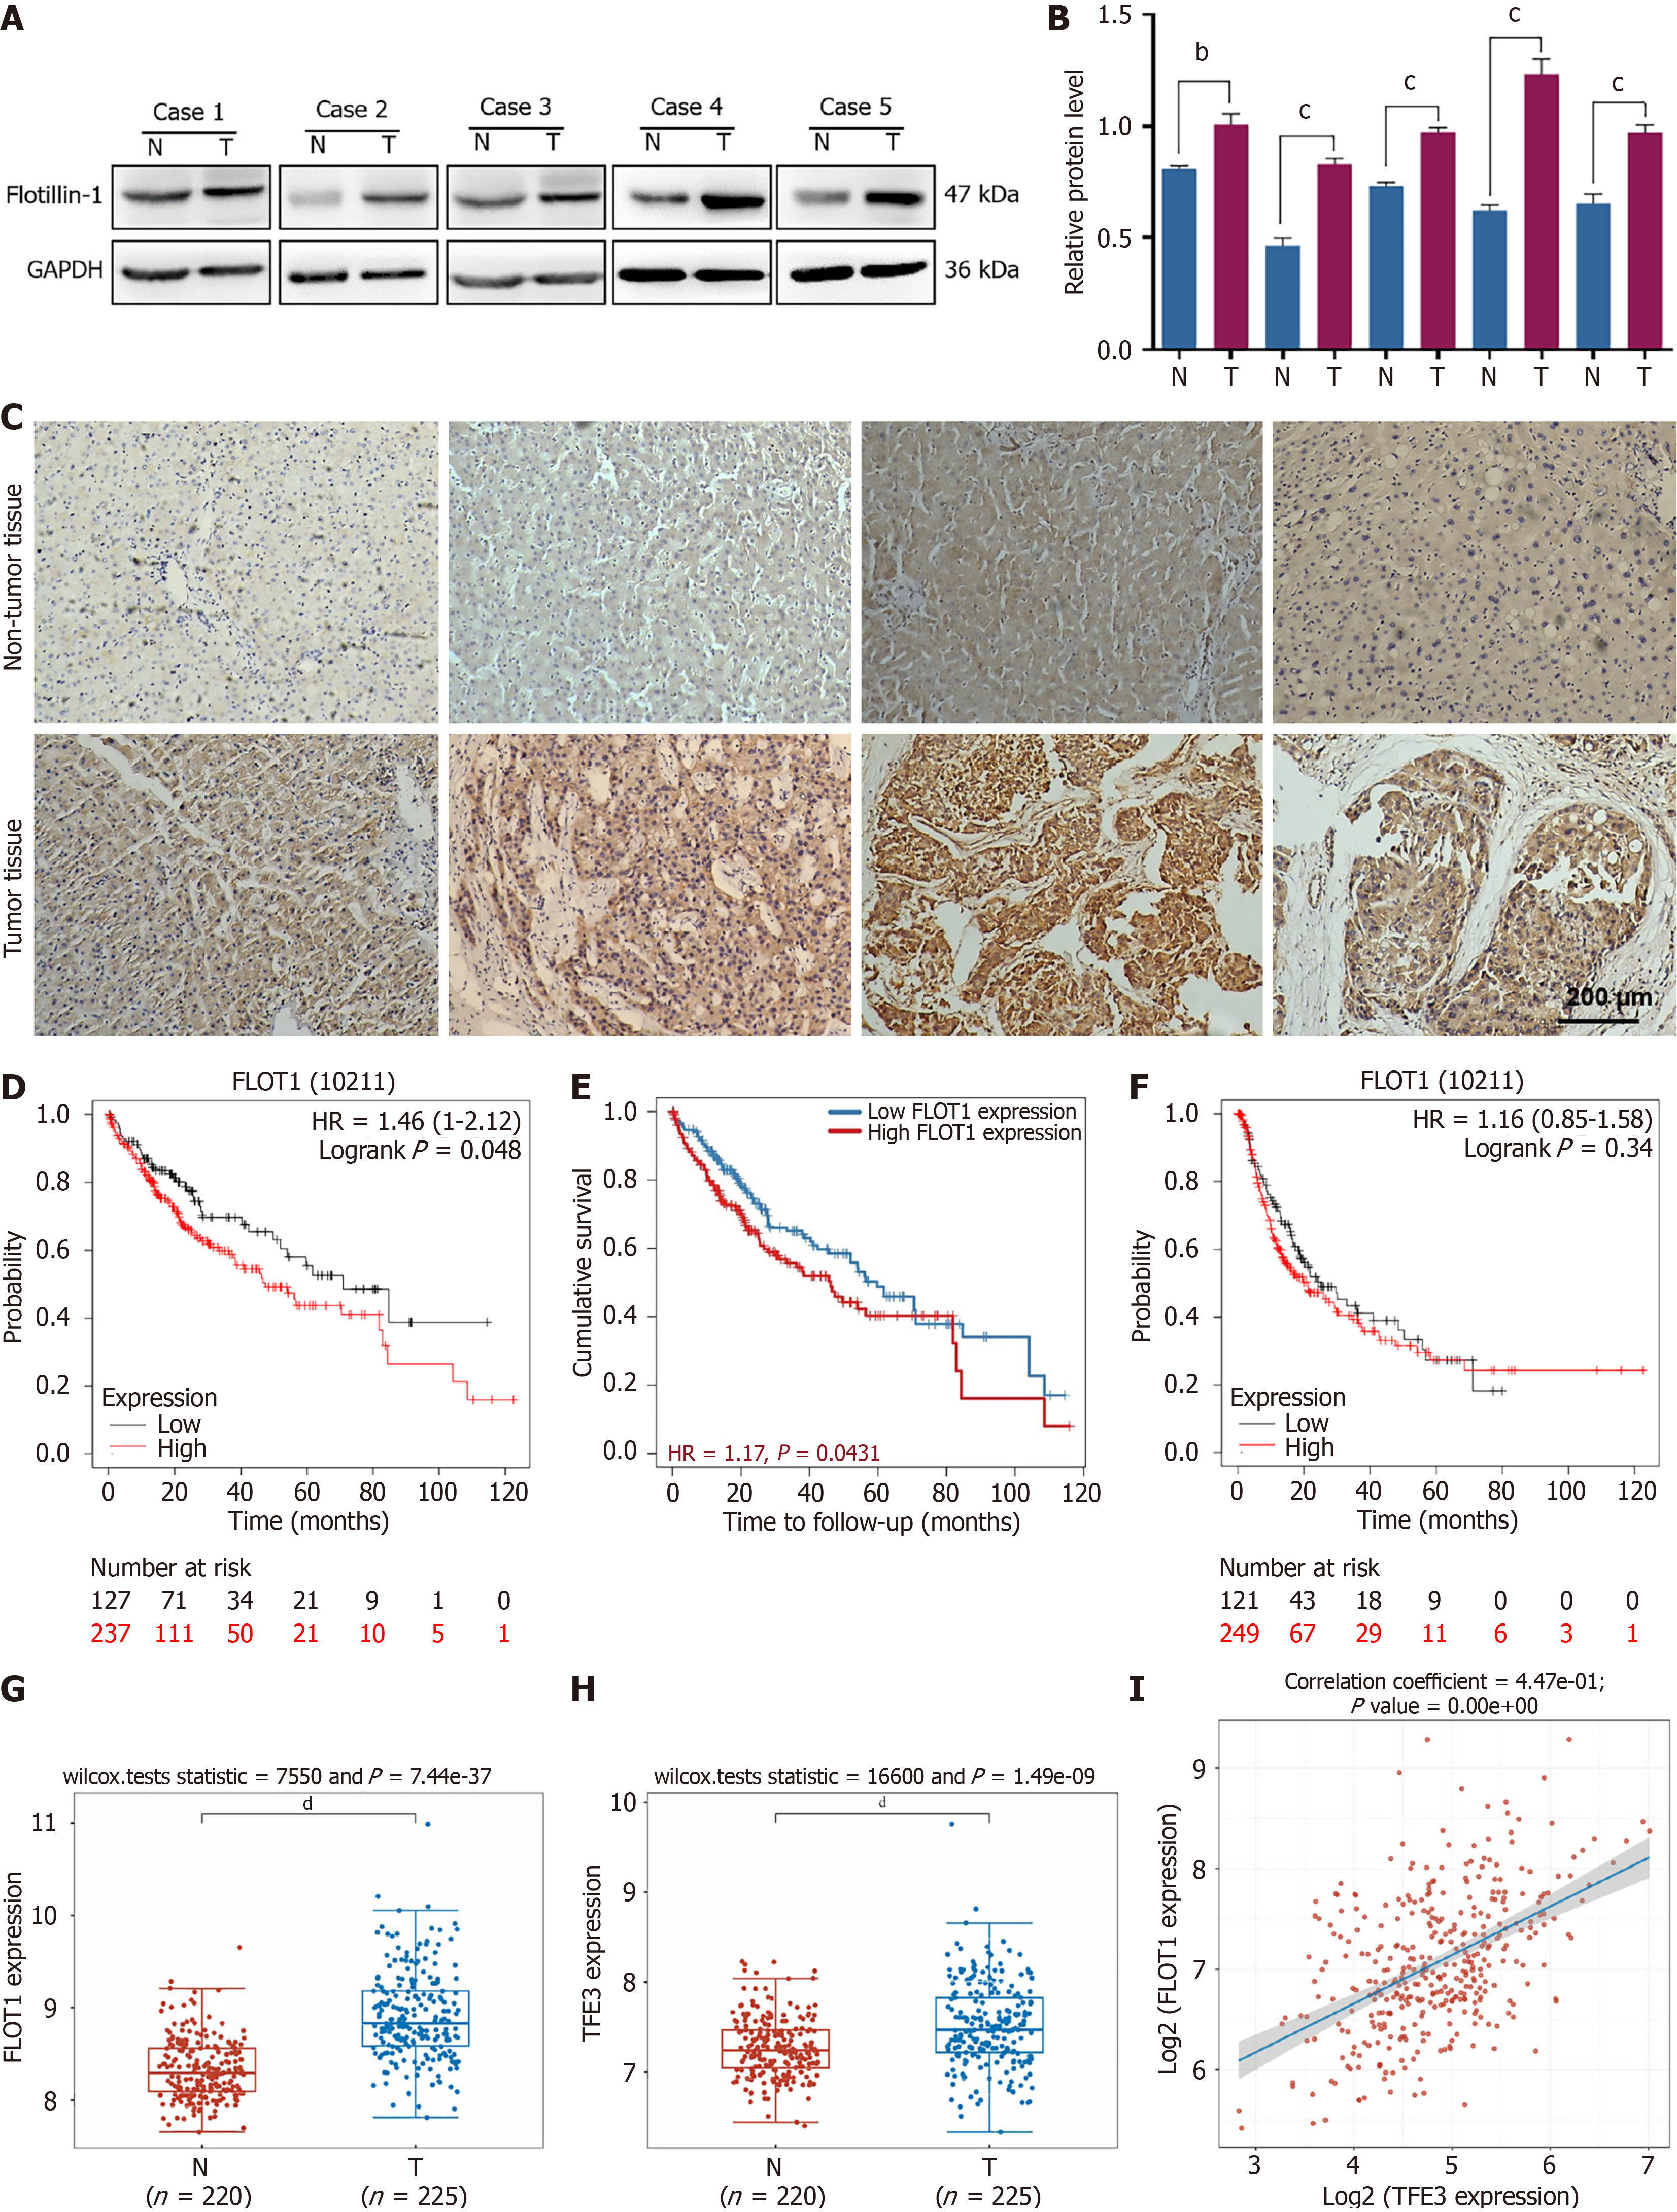
Figure 1 Correlation analysis of flotillin-1 expression and prognosis of liver cancer.
A and B: Western blot and semi-quantitative analysis of the expression of flotillin-1 (FLOT1) in hepatocellular carcinoma (HCC) and adjacent normal tissues with GAPDH as a reference. Values are expressed as mean ± SD (n = 5); C: Immunohistochemical staining analysis of FLOT1 in HCC and adjacent normal tissues. Correlation analysis between FLOT1 expression and prognostic survival in HCC patients via Kaplan-Meier plotter analysis; D: Overall survival; E: Tumor Immune Estimating Resource analysis; F: Progression-free survival; G and H: Expression distribution of the FLOT1 gene and transcription factor E3 gene in tumor tissues and normal tissues; I: Scatter plot and fitting line of Spearman correlation analysis between gene and gene expression. Each point in the figure represents a sample; the X-axis and Y-axis represent gene expression. Comparisons between the two groups were performed using the t-test. bP < 0.01, cP < 0.001, dP < 0.0001. FLOT1: Flotillin-1; HR: Hazard ratio; TFE3: Transcription factor E3.
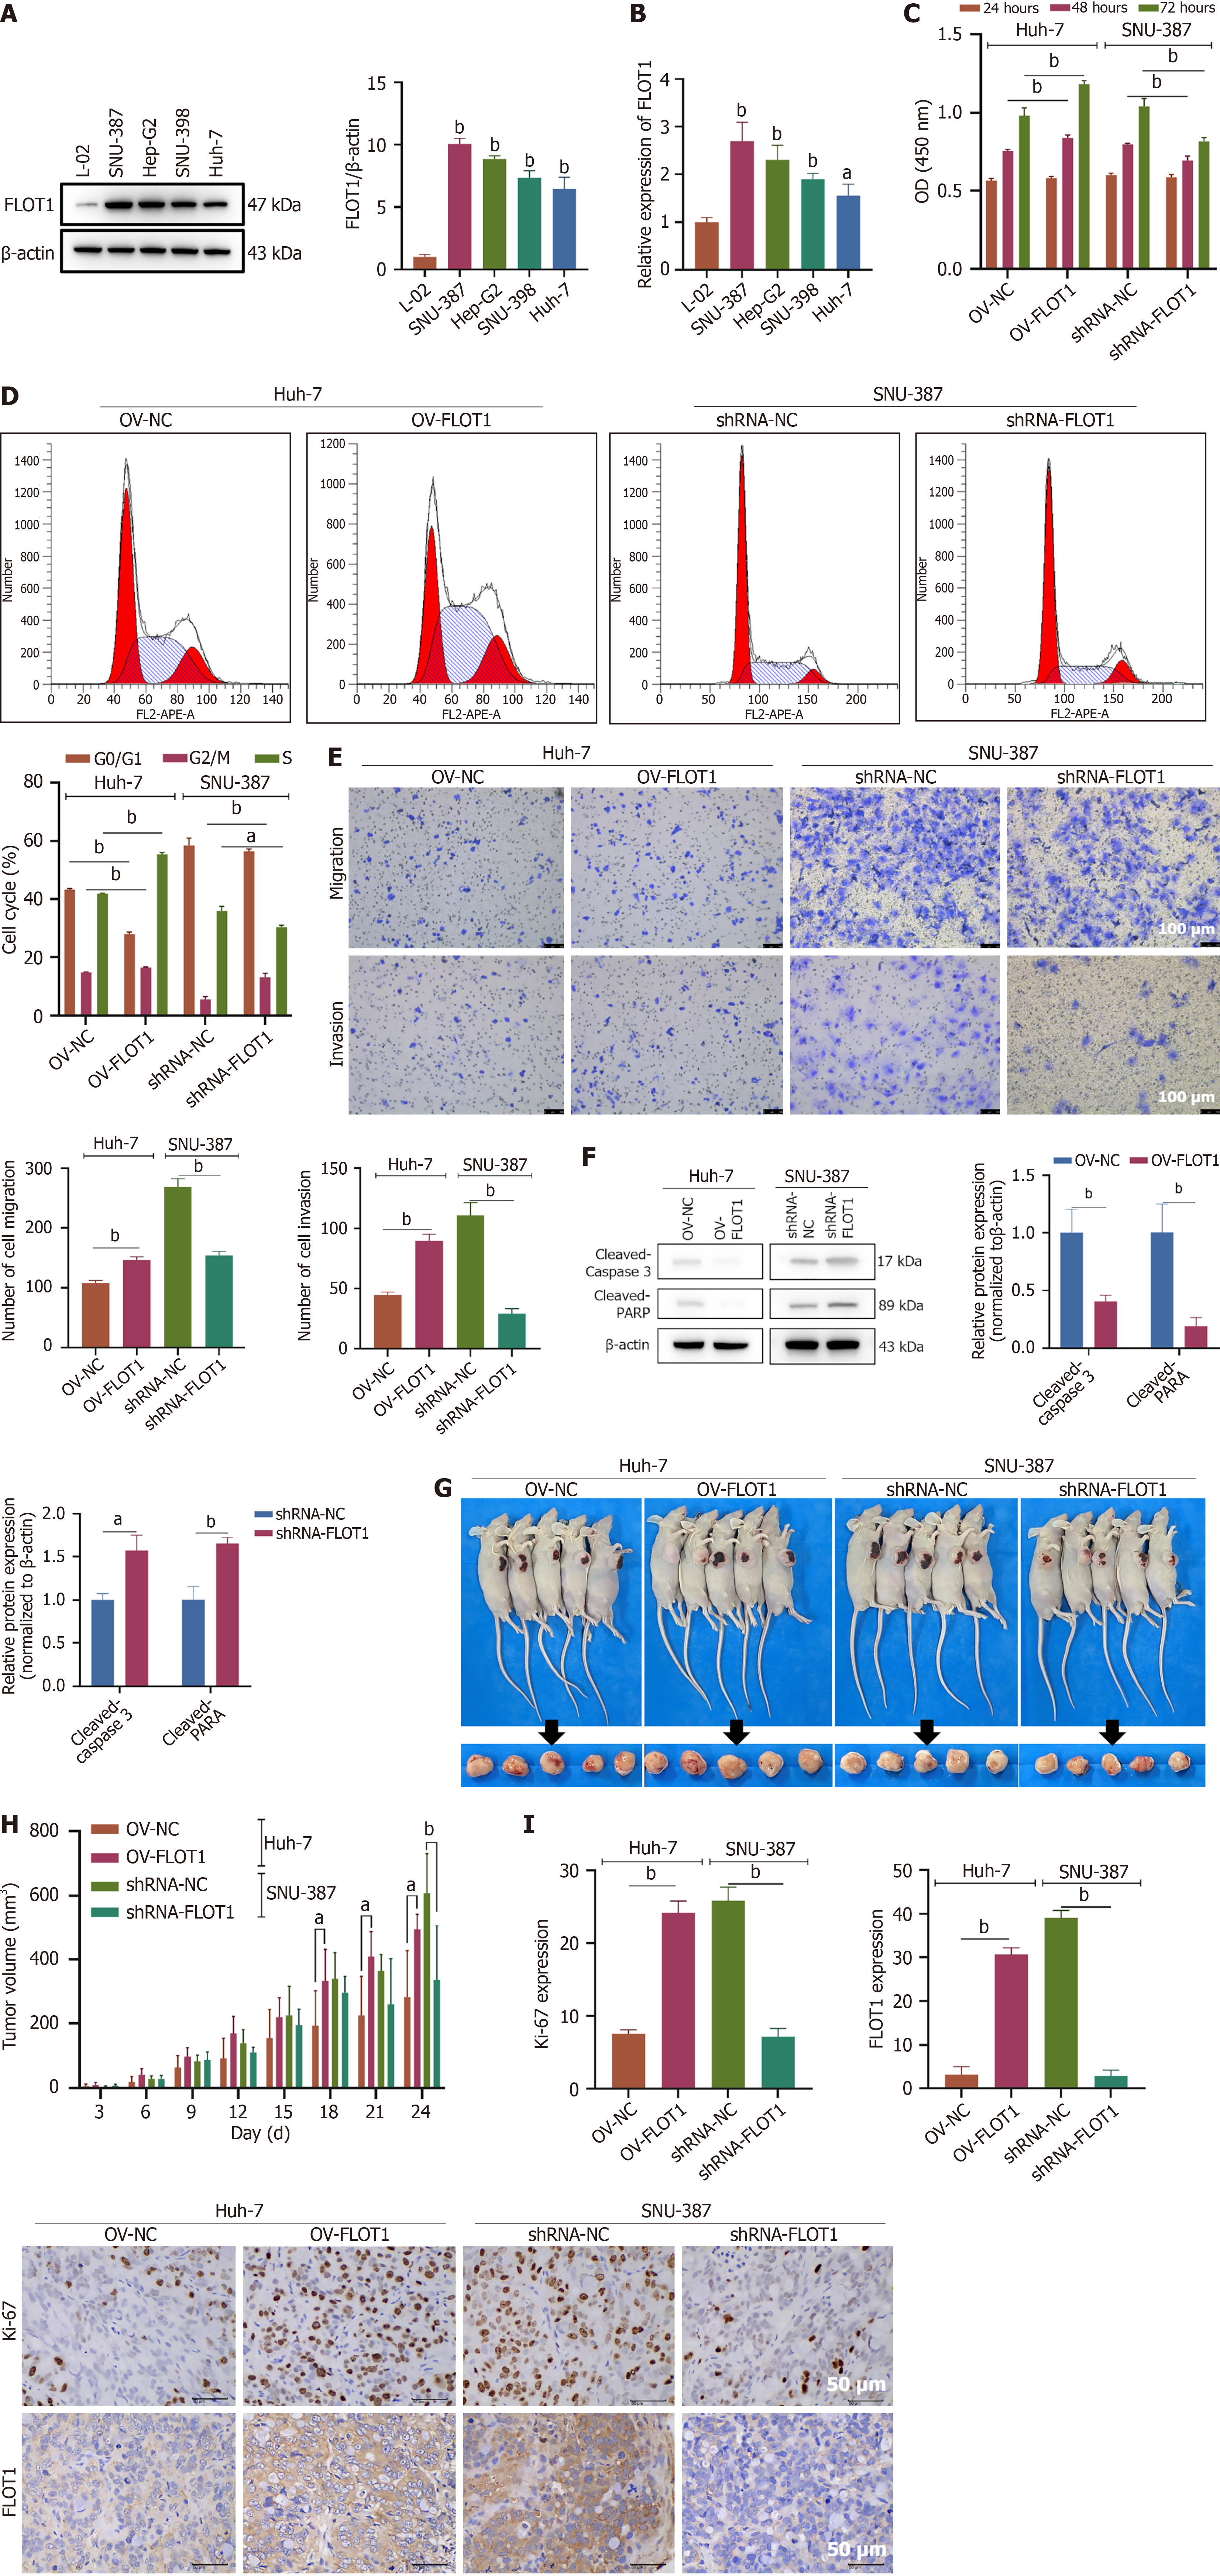
Figure 2 Flotillin-1 promotes proliferation, invasion, and migration of hepatocellular carcinoma cells in vitro and in vivo.
A: Expressions of flotillin-1 (FLOT1) protein in normal hepatocyte (L-02) and hepatocellular carcinoma lines (SNU-387, Hep-G2, SNU-398, and Huh-7) were detected by western blot; B: Quantitative reverse transcription polymerase chain reaction quantification of FLOT1 mRNA. n = 3, aP < 0.05 vs L-02, bP < 0.01 vs L-02; C-F: FLOT1 overexpression was transfected in Huh-7 cells and FLOT1 short-hairpin RNA was transfected in SNU-387 cells (n = 3). CCK-8 assay was used to detect the viability of Huh-7 and SNU-387 cells at 24, 48, and 72 hours (C). Cell cycle was measured by flow cytometry (D). Cell invasion and migration ability of Huh-7 and SNU-387 cells (E). Apoptosis-related proteins [cleaved-caspase 3 and cleaved-poly(ADP-ribose) polymerase] were detected by western blot (F); G: Xenograft tumor picture (n = 5) of Huh-7 cells with overexpression and SNU-387 cells with knockdown (short-hairpin RNA-FLOT1) in the Balb/c nude mice; H: Tumor volumes of Huh-7 and SNU-387 cells in the nude mice for 24 days (n = 6); I: Ki-67 and FLOT1 expressions in the tumor tissue of Balb/c nude mice transplanted with Huh-7 and SNU-387 cells were detected by immunohistochemical staining (n = 3). Scale bar = 50 μm. aP < 0.05, bP < 0.01. Values are expressed as mean ± SD, and comparisons between two groups were performed using the t-test. FLOT1: Flotillin-1; OV: Overexpression; PARP: Poly(ADP-ribose) polymerase.
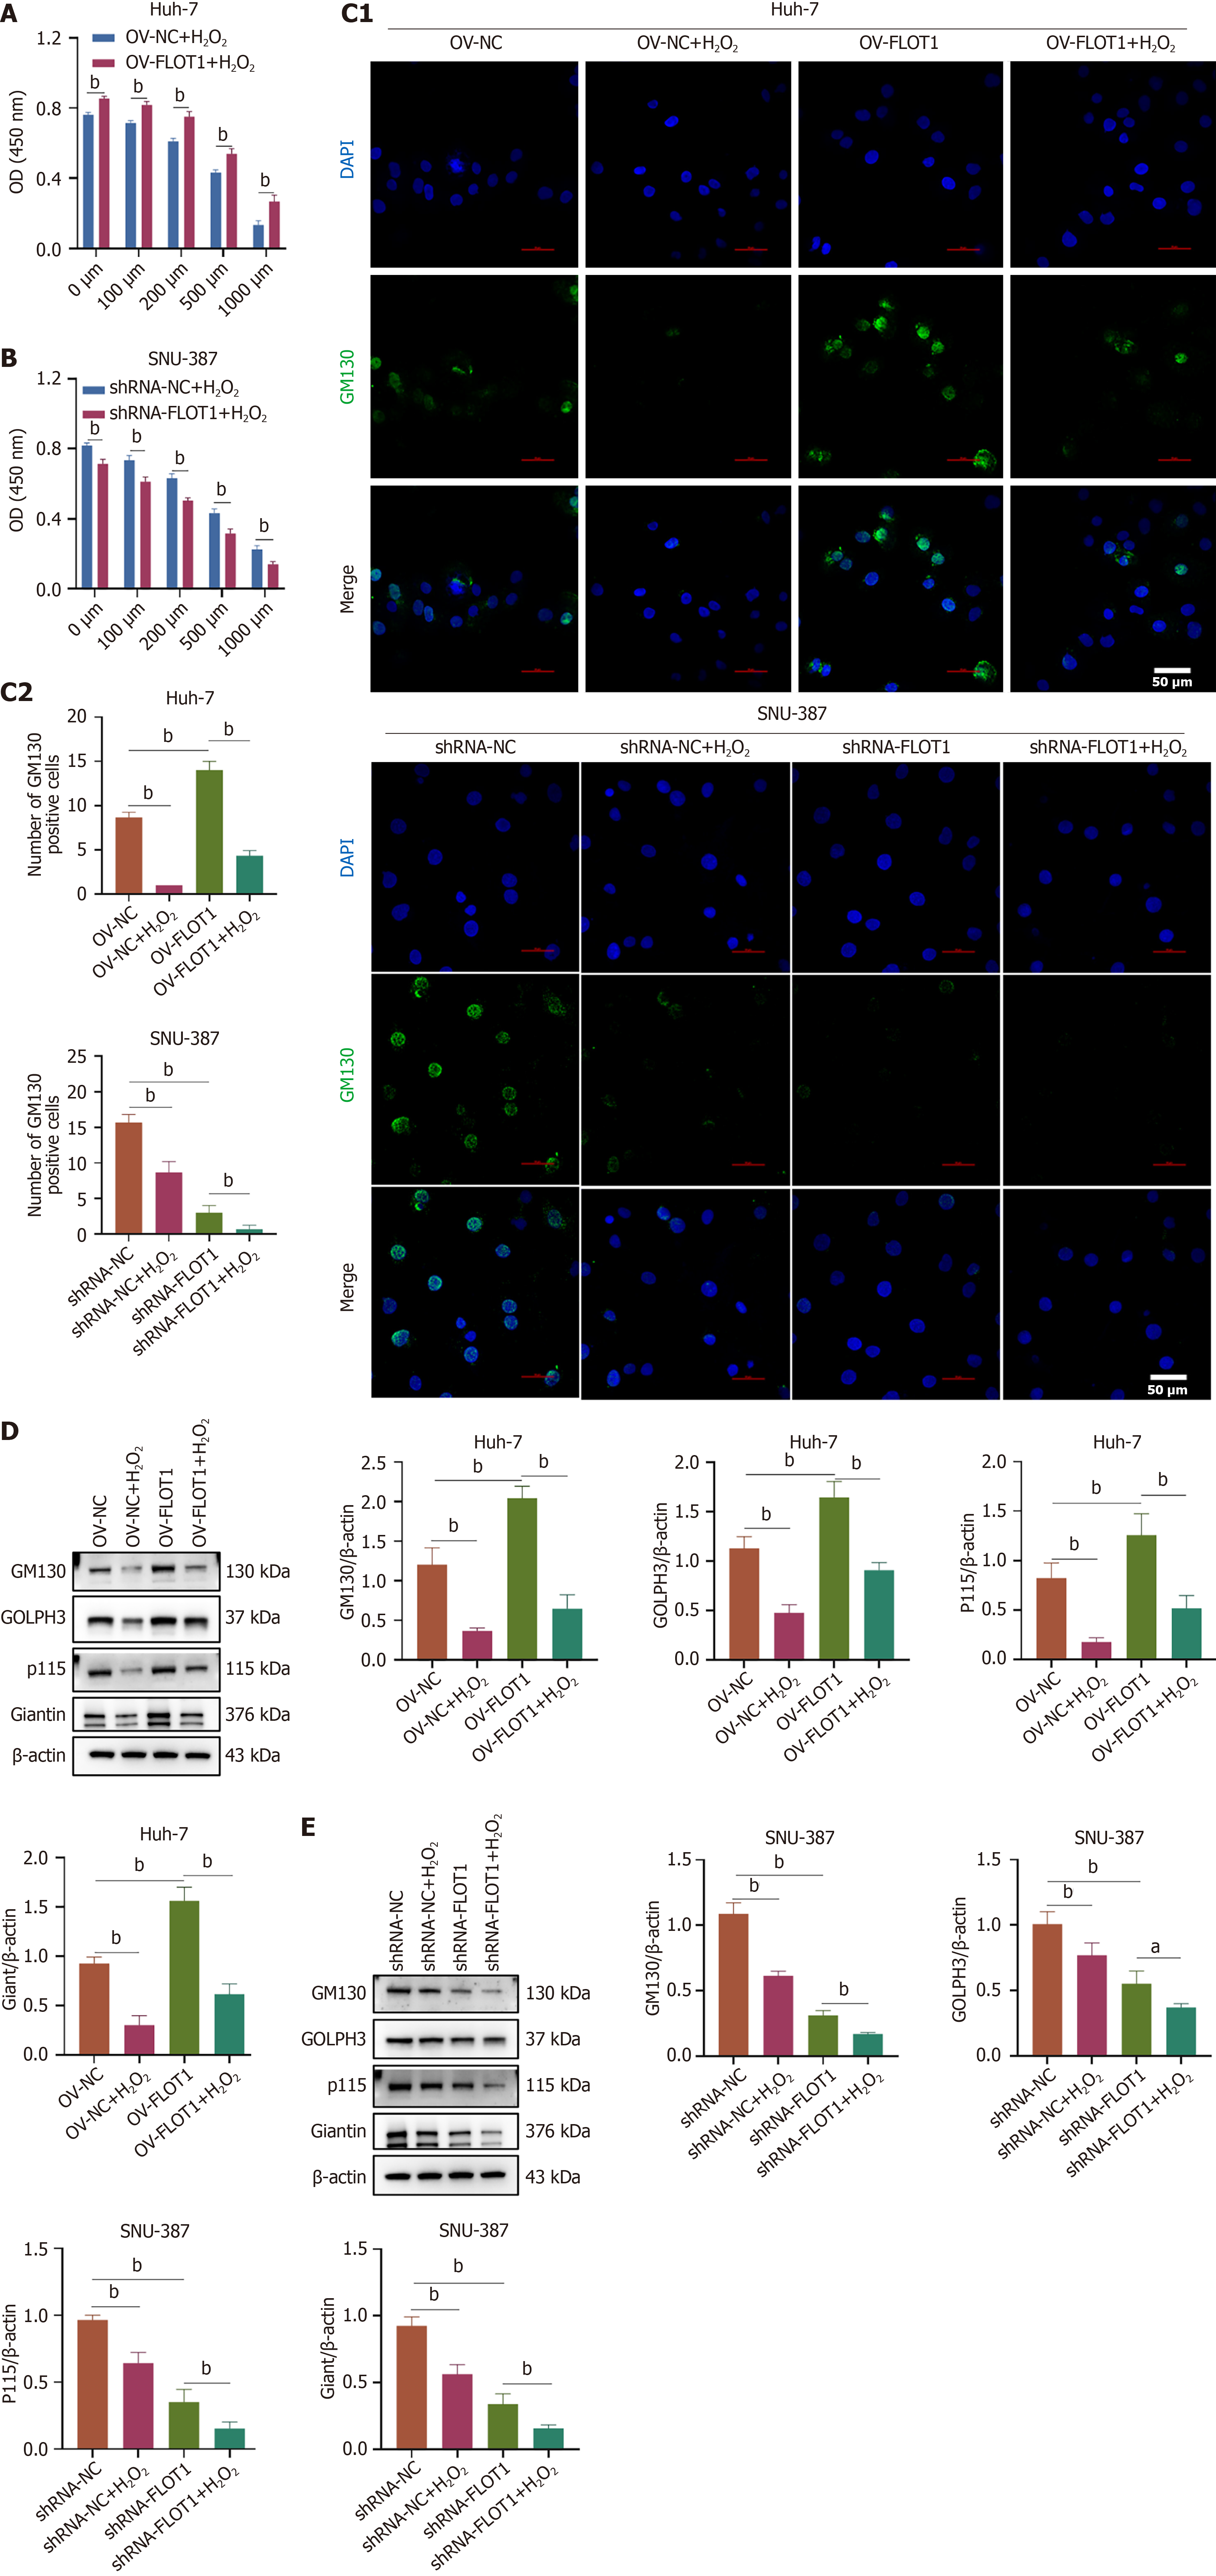
Figure 3 Flotillin-1 promotes Golgi stress in hepatocellular carcinoma.
A and B: Flotillin-1 overexpression was transfected in Huh-7 cells and flotillin-1 short-hairpin RNA was transfected in SNU-387 cells with H2O2 (0, 100, 200, 500, and 1000 μM) stimulation. CCK-8 assay was used to detect cell viability of Huh-7 (A) and SNU-387 (B) cells; C-E: Huh-7 cells and SNU-387 cells were stimulated with H2O2 (1000 μM). Fragmentation of Golgi apparatus was observed by immunofluorescence staining with Golgi marker protein GM130. Scale bar = 50 μm (C). Expression of Golgi stress-related proteins (GM130, giantin, p115, and Golgi phosphoprotein 3) in Huh-7 and SNU-387 cells was detected by western blot (D and E). Values are expressed as mean ± SD (n = 3), and comparisons between two groups were performed using the t-test; comparisons among multiple groups, one-way ANOVA was employed, followed by the LSD test or Tamhane’s T2 test. aP < 0.05, bP < 0.01. FLOT1: Flotillin-1; OV: Overexpression; DAPI: 4’-6-diamidino-2-phenylindole; GM130: Golgi matrix protein 130; shRNA: Short-hairpin RNA; GOLPH3: Golgi phosphoprotein 3.
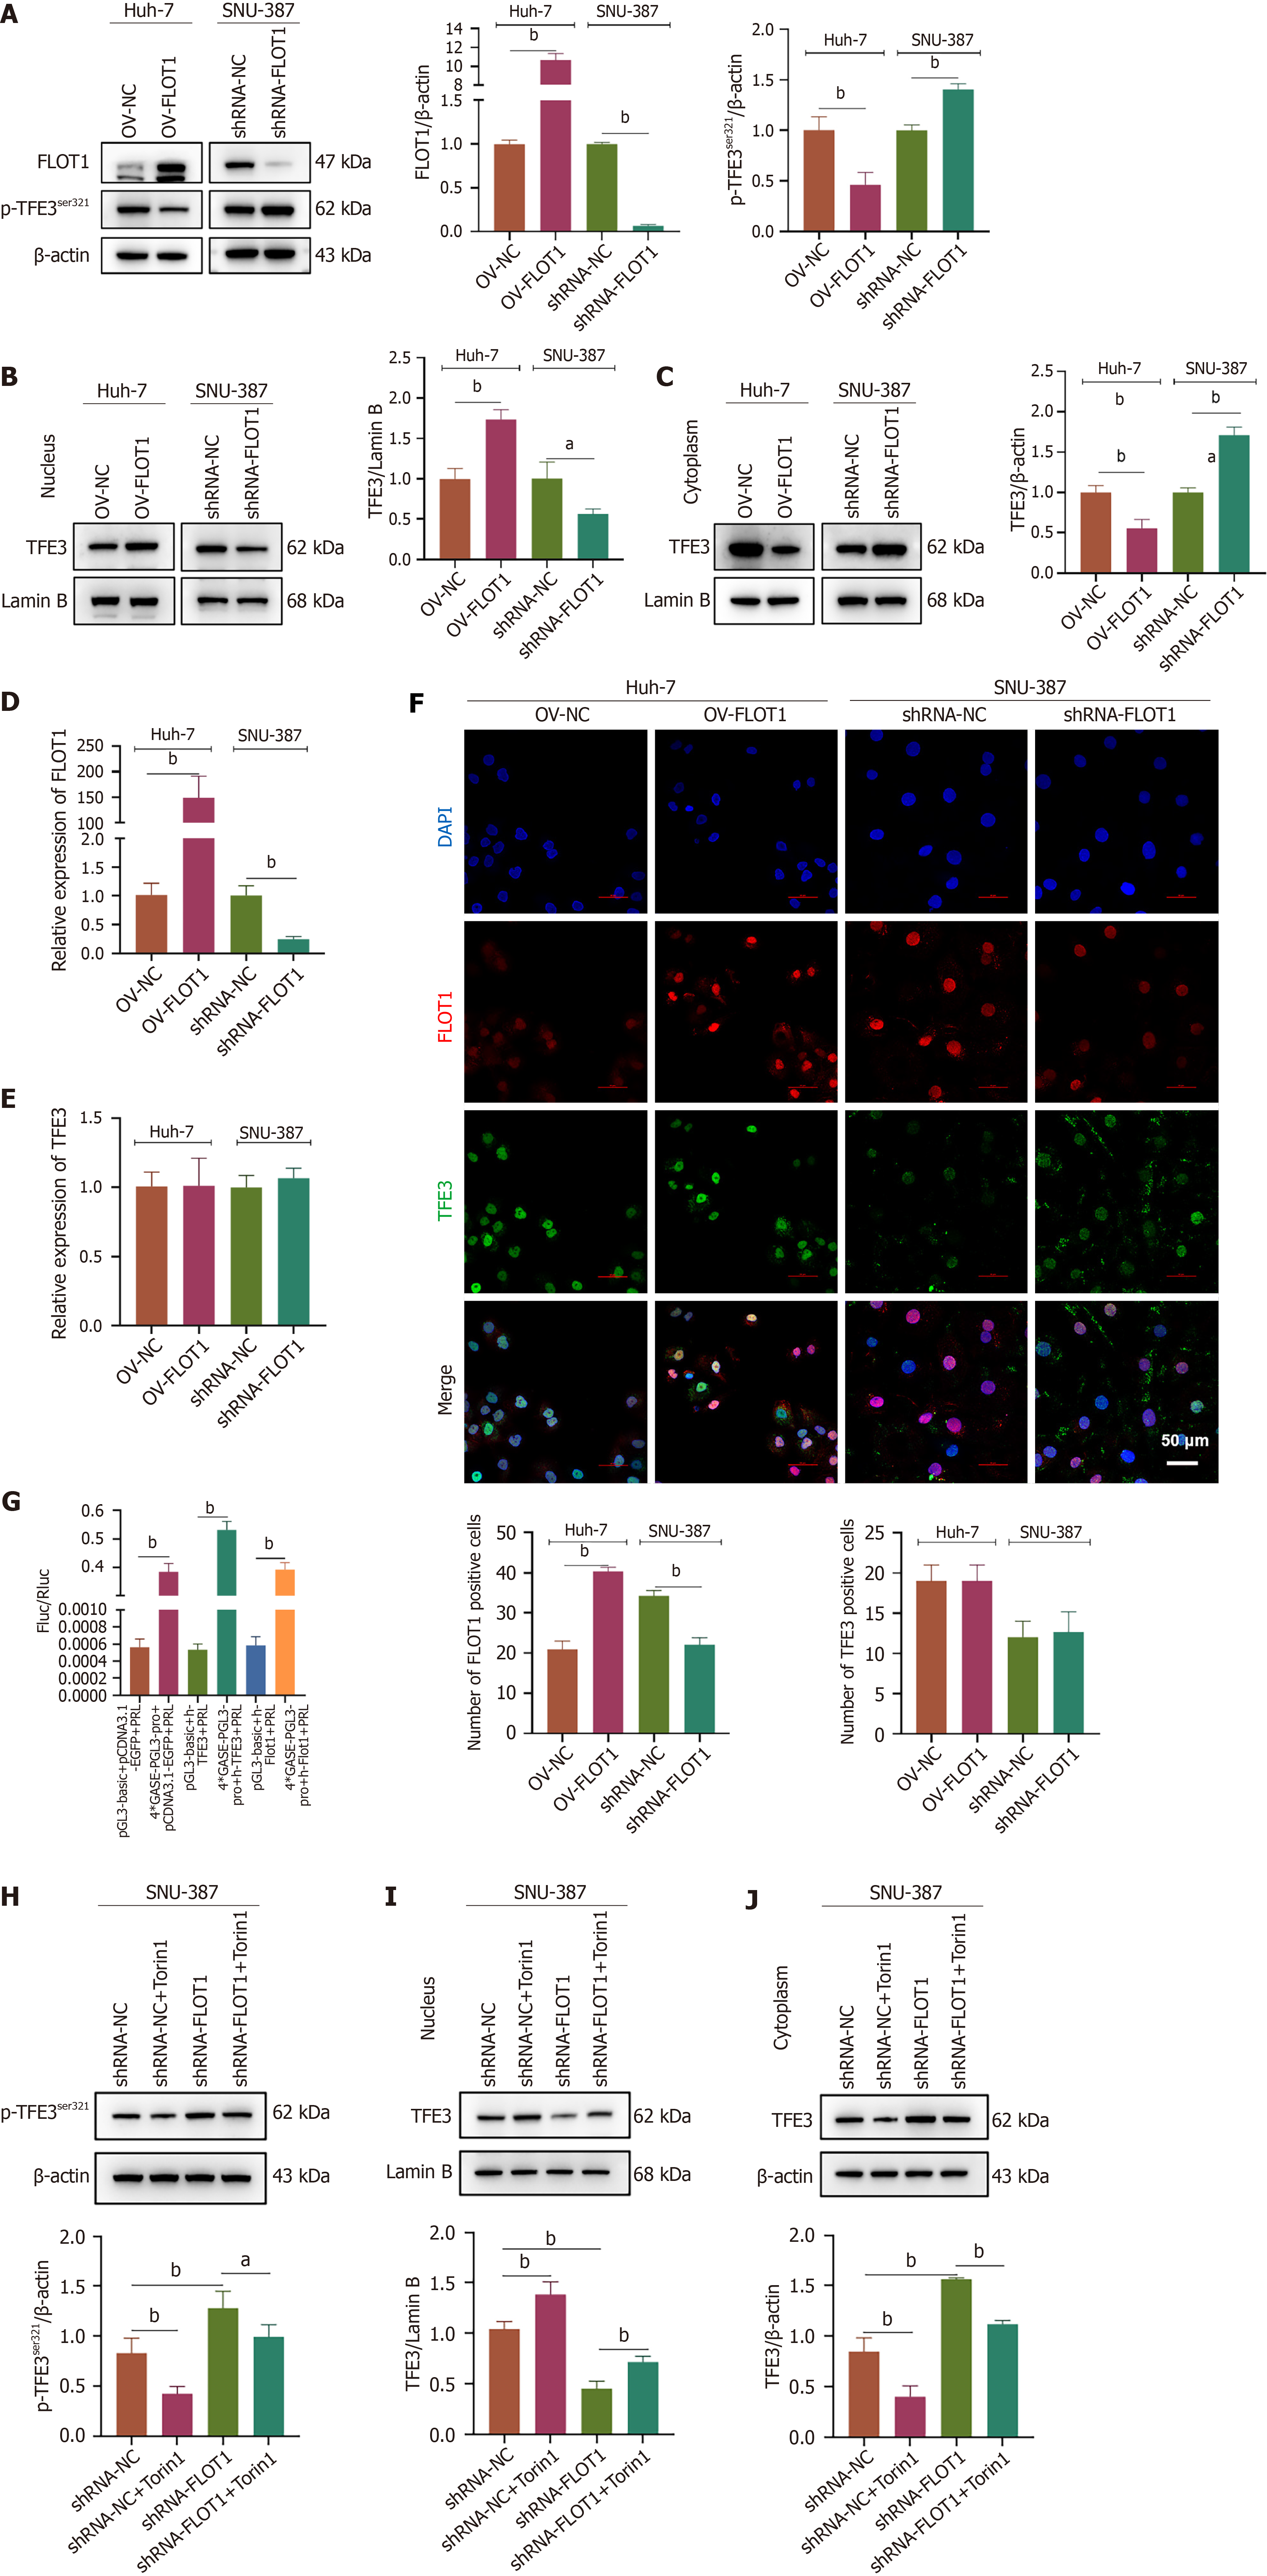
Figure 4 Flotillin-1 promotes the dephosphorylation and nuclear translocation of Golgi stress transcriptional regulator transcription factor E3 by recruiting mechanistic target of rapamycin complex 1/2.
A-F: Flotillin-1 (FLOT1) overexpression was transfected in Huh-7 cells and FLOT1 short-hairpin RNA was transfected in SNU-387 cells (n = 3). Expression of total protein FLOT1 and phosphorylation of transcription factor E3 (TFE3) protein Ser321 (A) was detected by western blot. Expression of TFE3 in the nucleus (B) and cytoplasm (C) was detected by western blot. Expressions of FLOT1 (D) and TFE3 (E) mRNA were detected by quantitative reverse transcription polymerase chain reaction with GAPDH as a reference. Immunofluorescence double staining of FLOT1 and TFE3 expression and localization. Scale bar = 50 μm (F). Values are expressed as mean ± SD (n = 3), and comparisons between two groups were performed using the t-test. aP < 0.05, bP < 0.01; G: Reporter vector GASE_LUC was constructed, and 293T cells were transfected with OV-TFE3 and OV-FLOT1, respectively. After 48 hours of transfection, the dual luciferase reporter assay was performed; H-J: SNU-387 cells were transfected with short-hairpin RNA-FLOT1 and treated with the mechanistic target of rapamycin complex 1/2 inhibitor Torin1. Phosphorylation status of TFE3 Ser321 (H) was assessed via western blot analysis. Additionally, the expression levels of TFE3 in both the nucleus (I) and cytoplasm (J) were evaluated using western blot. Values are expressed as mean ± SD (n = 3), comparisons among multiple groups, one-way ANOVA was employed, followed by LSD test or Tamhane’s T2 test. aP < 0.05, bP < 0.01. FLOT1: Flotillin-1; OV: Overexpression; TFE3: Transcription factor E3; shRNA: Short-hairpin RNA.
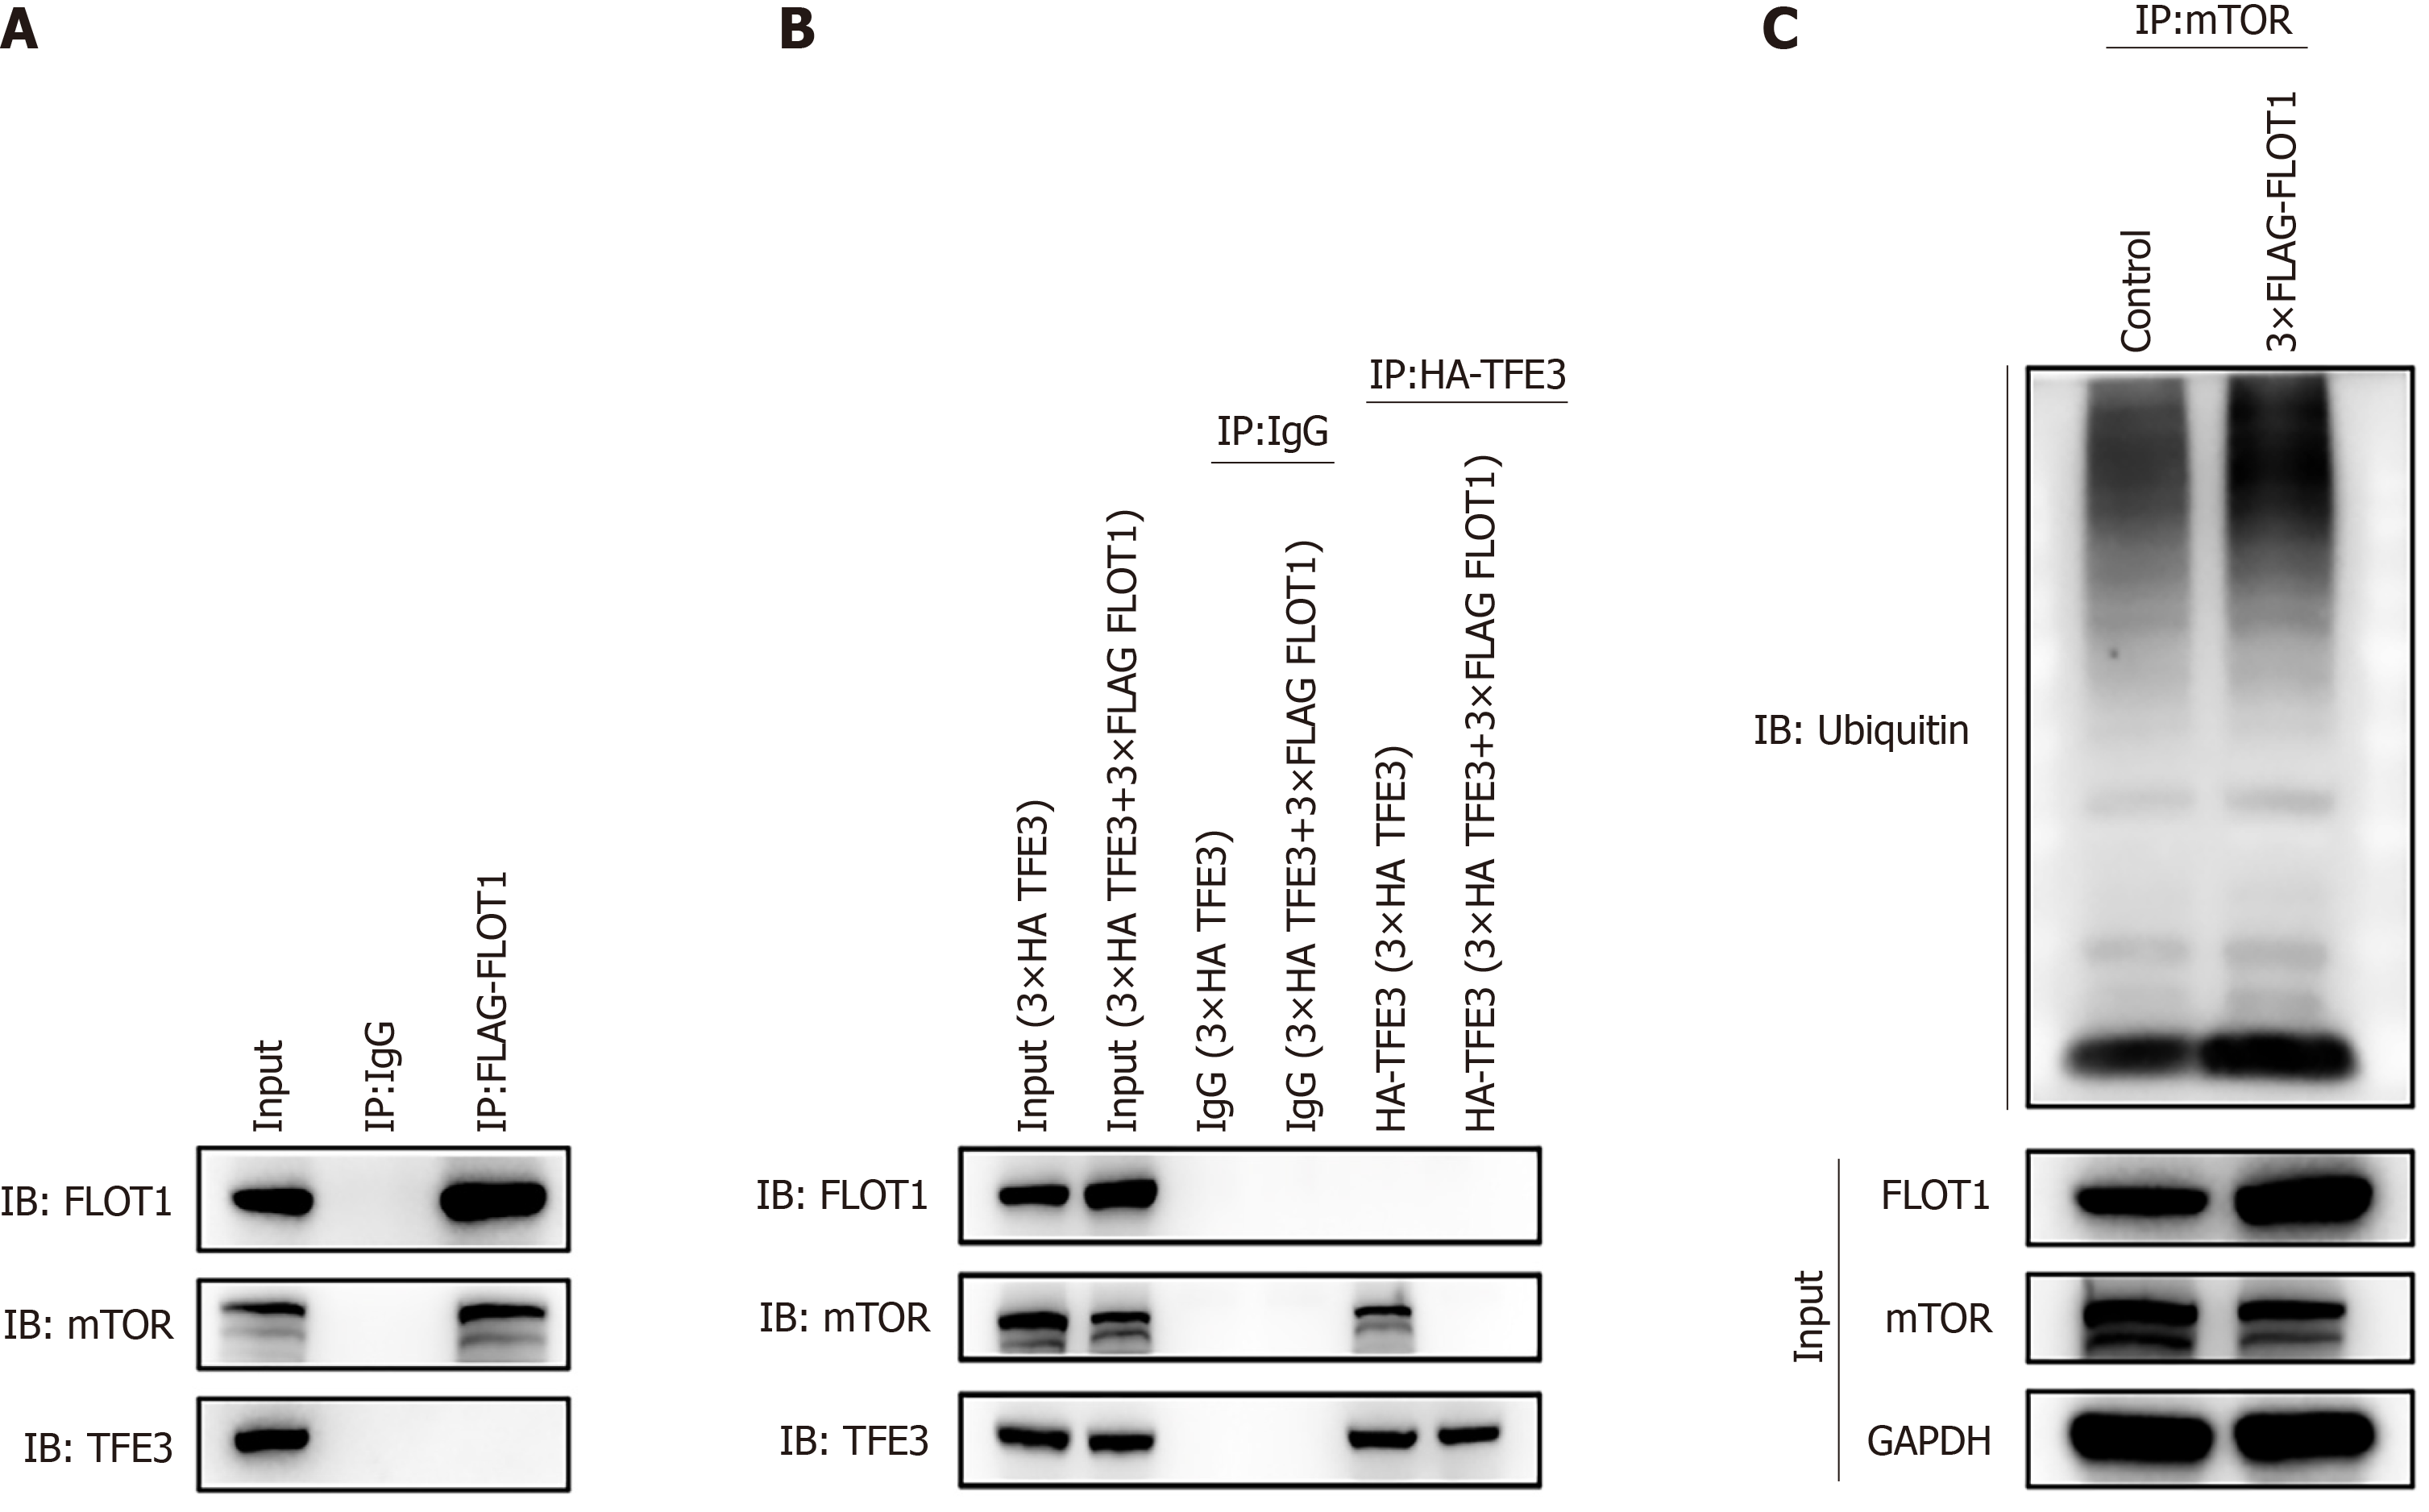
Figure 5 Co-immunoprecipitation verified that flotillin-1 enhanced transcription factor E3 dephosphorylation and nuclear translocation by recruiting and inhibiting mechanistic target of rapamycin complex 1/2 protein and promoting its ubiquitination.
A: Expression of flotillin-1 (FLOT1), mechanistic target of rapamycin (mTOR), and transcription factor E3 (TFE3) protein after immunoprecipitation (IP) (FALG-FLOT1) was detected by western blotting; 293T cells were divided into the Input, immunoglobulin G (IgG), and FLAG-FLOT1 groups. The Input group was the total protein sample without IP treatment after protein extraction; IgG group was the IgG isotype of FLOT1 antibody or TFE3 antibody as the negative control group; the FALG-FLOT1 group was the samples treated by IP with FLOT1 antibody. Immunoblotting (IB) was conducted using antibodies for detecting FLOT1, mTOR, and TFE3 proteins; B: Expression of FLOT1, mTOR, and TFE3 protein following IP with HA-TFE3. Again, 293T cells were divided into the Input (3 × HA TFE3), Input (3 × HA TFE3 + 3 × FLAG FLOT1), IgG (3 × HA TFE3 + 3 × FLAG FLOT1), IgG (3 × HA TFE3 + 3 × FLAG FLOT1), HA-TFE3 (3 × HA TFE3 + 3 × FLAG FLOT1), and HA-TFE3 (3 × HA TFE3 + 3 × FLAG FLOT1) groups. The Input group was the total protein sample without IP treatment after protein extraction; HA-TFE3 group comprised the samples treated by IP with TFE3 antibody; IgG group was the IgG isotype of TFE3 antibody as the negative control group; IB was conducted using antibodies for detecting FLOT1, mTOR, and TFE3 proteins; C: Expression of ubiquitin (Ub) protein after IP (mTOR) was detected by western blotting. Here also, 293T cells were divided into the control and 3 × FLAG-FLOT1 groups. IP was performed using the mTOR group as the sample antibody, while IB was conducted using Ub as the antibody for subsequent western blotting detection. FLOT1: Flotillin-1; TFE3: Transcription factor E3; mTOR: Mechanistic target of rapamycin.
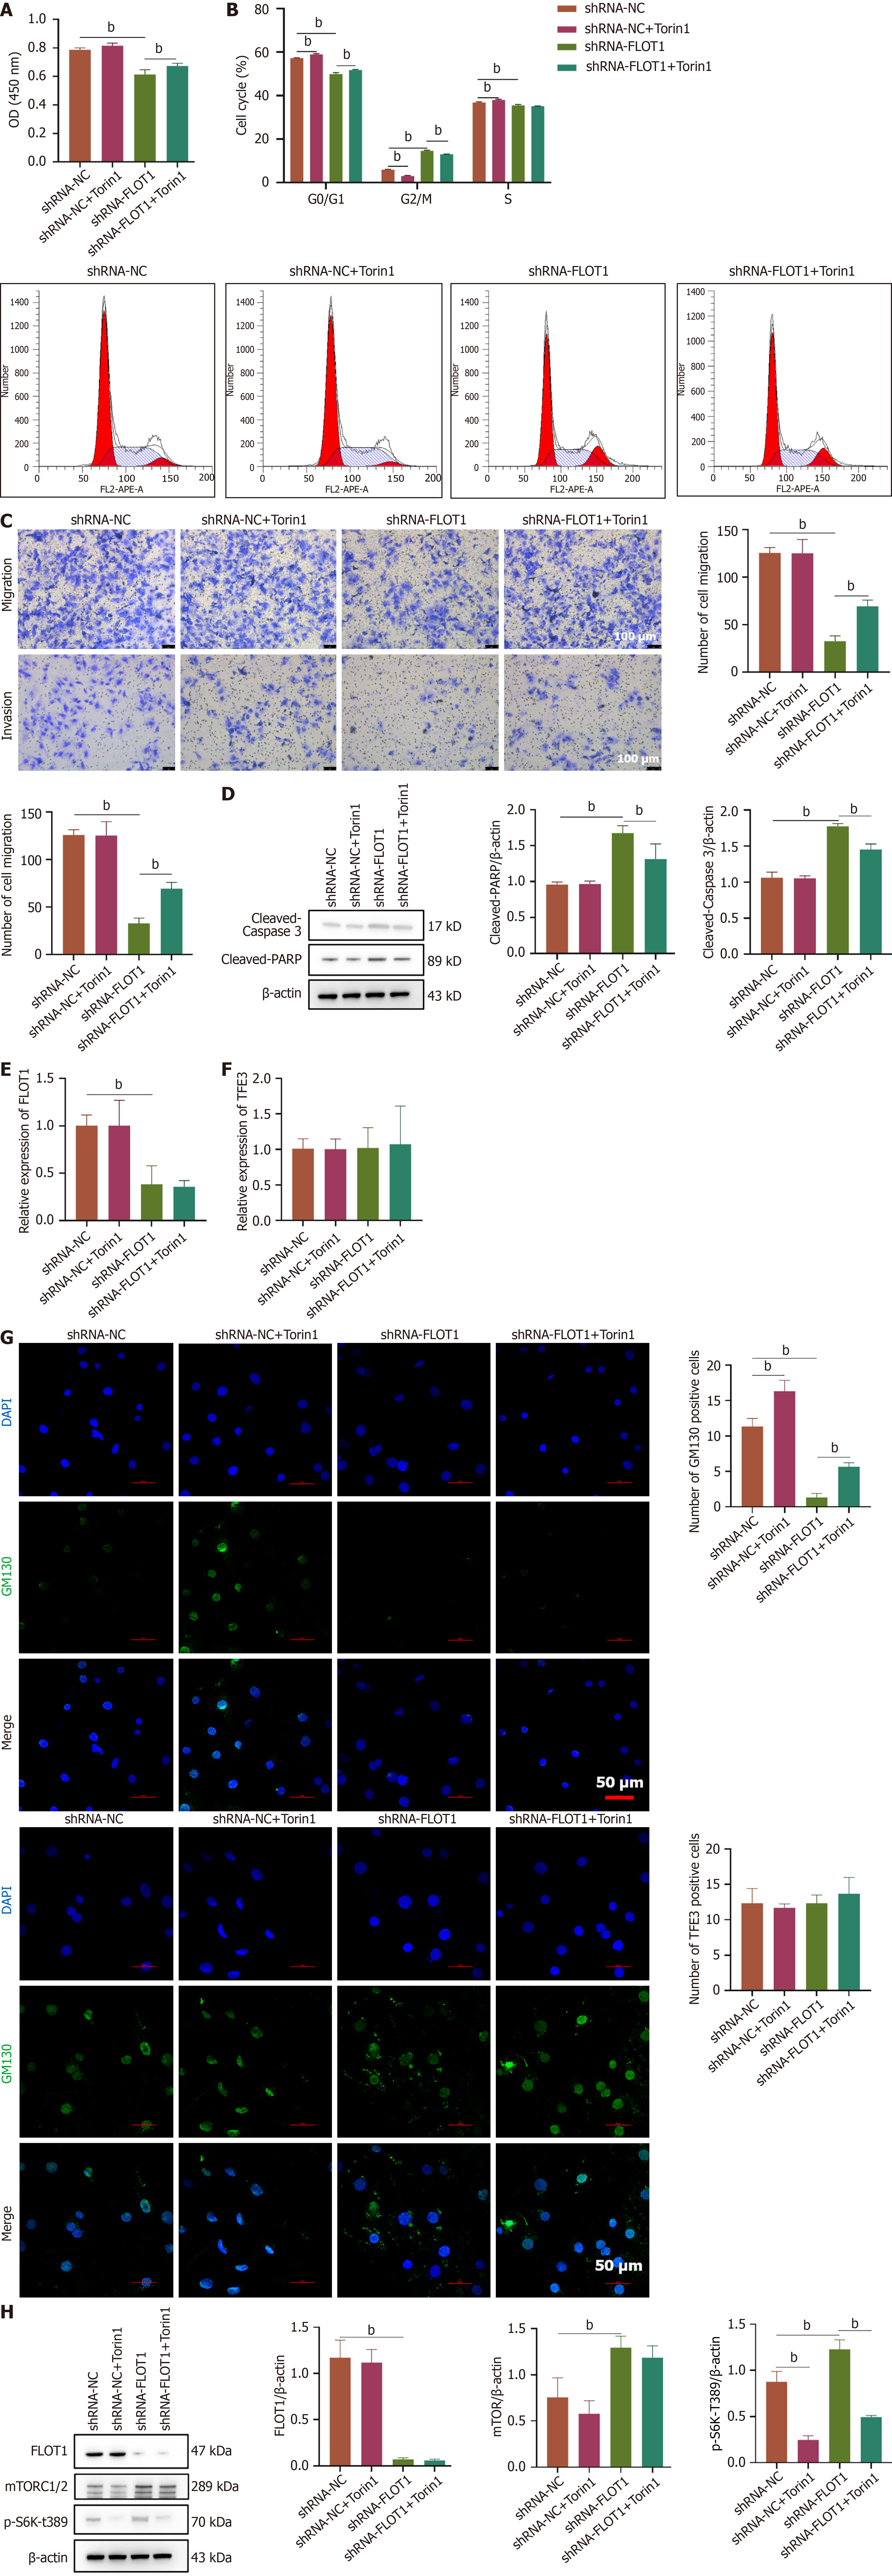
Figure 6 Flotillin-1 regulates Golgi stress homeostasis by inhibiting mechanistic target of rapamycin complex 1/2 and transcription factor E3 nuclear translocation to maintain the proliferation and survival of hepatocellular carcinoma.
SNU-387 cells were transfected with short-hairpin RNA-flotillin-1 (FLOT1) and treated with the mechanistic target of rapamycin complex 1/2 inhibitor Torin1. A: CCK-8 assay was used to detect cells viability of SNU-387 cells; B: Cell cycle was measured by flow cytometry; C: Cell invasion and migration ability of SNU-387 cells; D-F: Expressions of FLOT1 and transcription factor E3 mRNA were detected by quantitative reverse transcription polymerase chain reaction with GAPDH as a reference; G: Immunofluorescence staining of Golgi matrix protein 130 and transcription factor E3 expression and localization. Scale bar = 50 μm; H: Apoptosis-related proteins [cleaved-caspase 3 and cleaved-poly(ADP-ribose) polymerase] were detected by western blot. Expressions of FLOT1 total proteins, mechanistic target of rapamycin complex 1/2, and p-S6K-T389 were evaluated using western blot. Values are expressed as mean ± SD (n = 3), comparisons among multiple groups, one-way ANOVA was employed, followed by the LSD test or Tamhane’s T2 test. aP < 0.05, bP < 0.01. shRNA: Short-hairpin RNA; FLOT1: Flotillin-1; PARP: Poly(ADP-ribose) polymerase; TFE3: Transcription factor E3; mTOR: Mechanistic target of rapamycin; DAPI: 4’-6-diamidino-2-phenylindole; GM130: Golgi matrix protein 130; mTORC1/2: Mechanistic target of rapamycin complex 1/2.
- Citation: Zhang L, Bai CZ, Shan JY, Xue HL, Zheng SM, Chen YL, Tang SH. Flotillin-1 promotes the progression of hepatocellular carcinoma by activating TFE3-mediated Golgi stress response via inhibition of mTORC1/2. World J Gastroenterol 2025; 31(29): 106895
- URL: https://www.wjgnet.com/1007-9327/full/v31/i29/106895.htm
- DOI: https://dx.doi.org/10.3748/wjg.v31.i29.106895


