©The Author(s) 2025.
World J Gastroenterol. Jul 7, 2025; 31(25): 105518
Published online Jul 7, 2025. doi: 10.3748/wjg.v31.i25.105518
Published online Jul 7, 2025. doi: 10.3748/wjg.v31.i25.105518
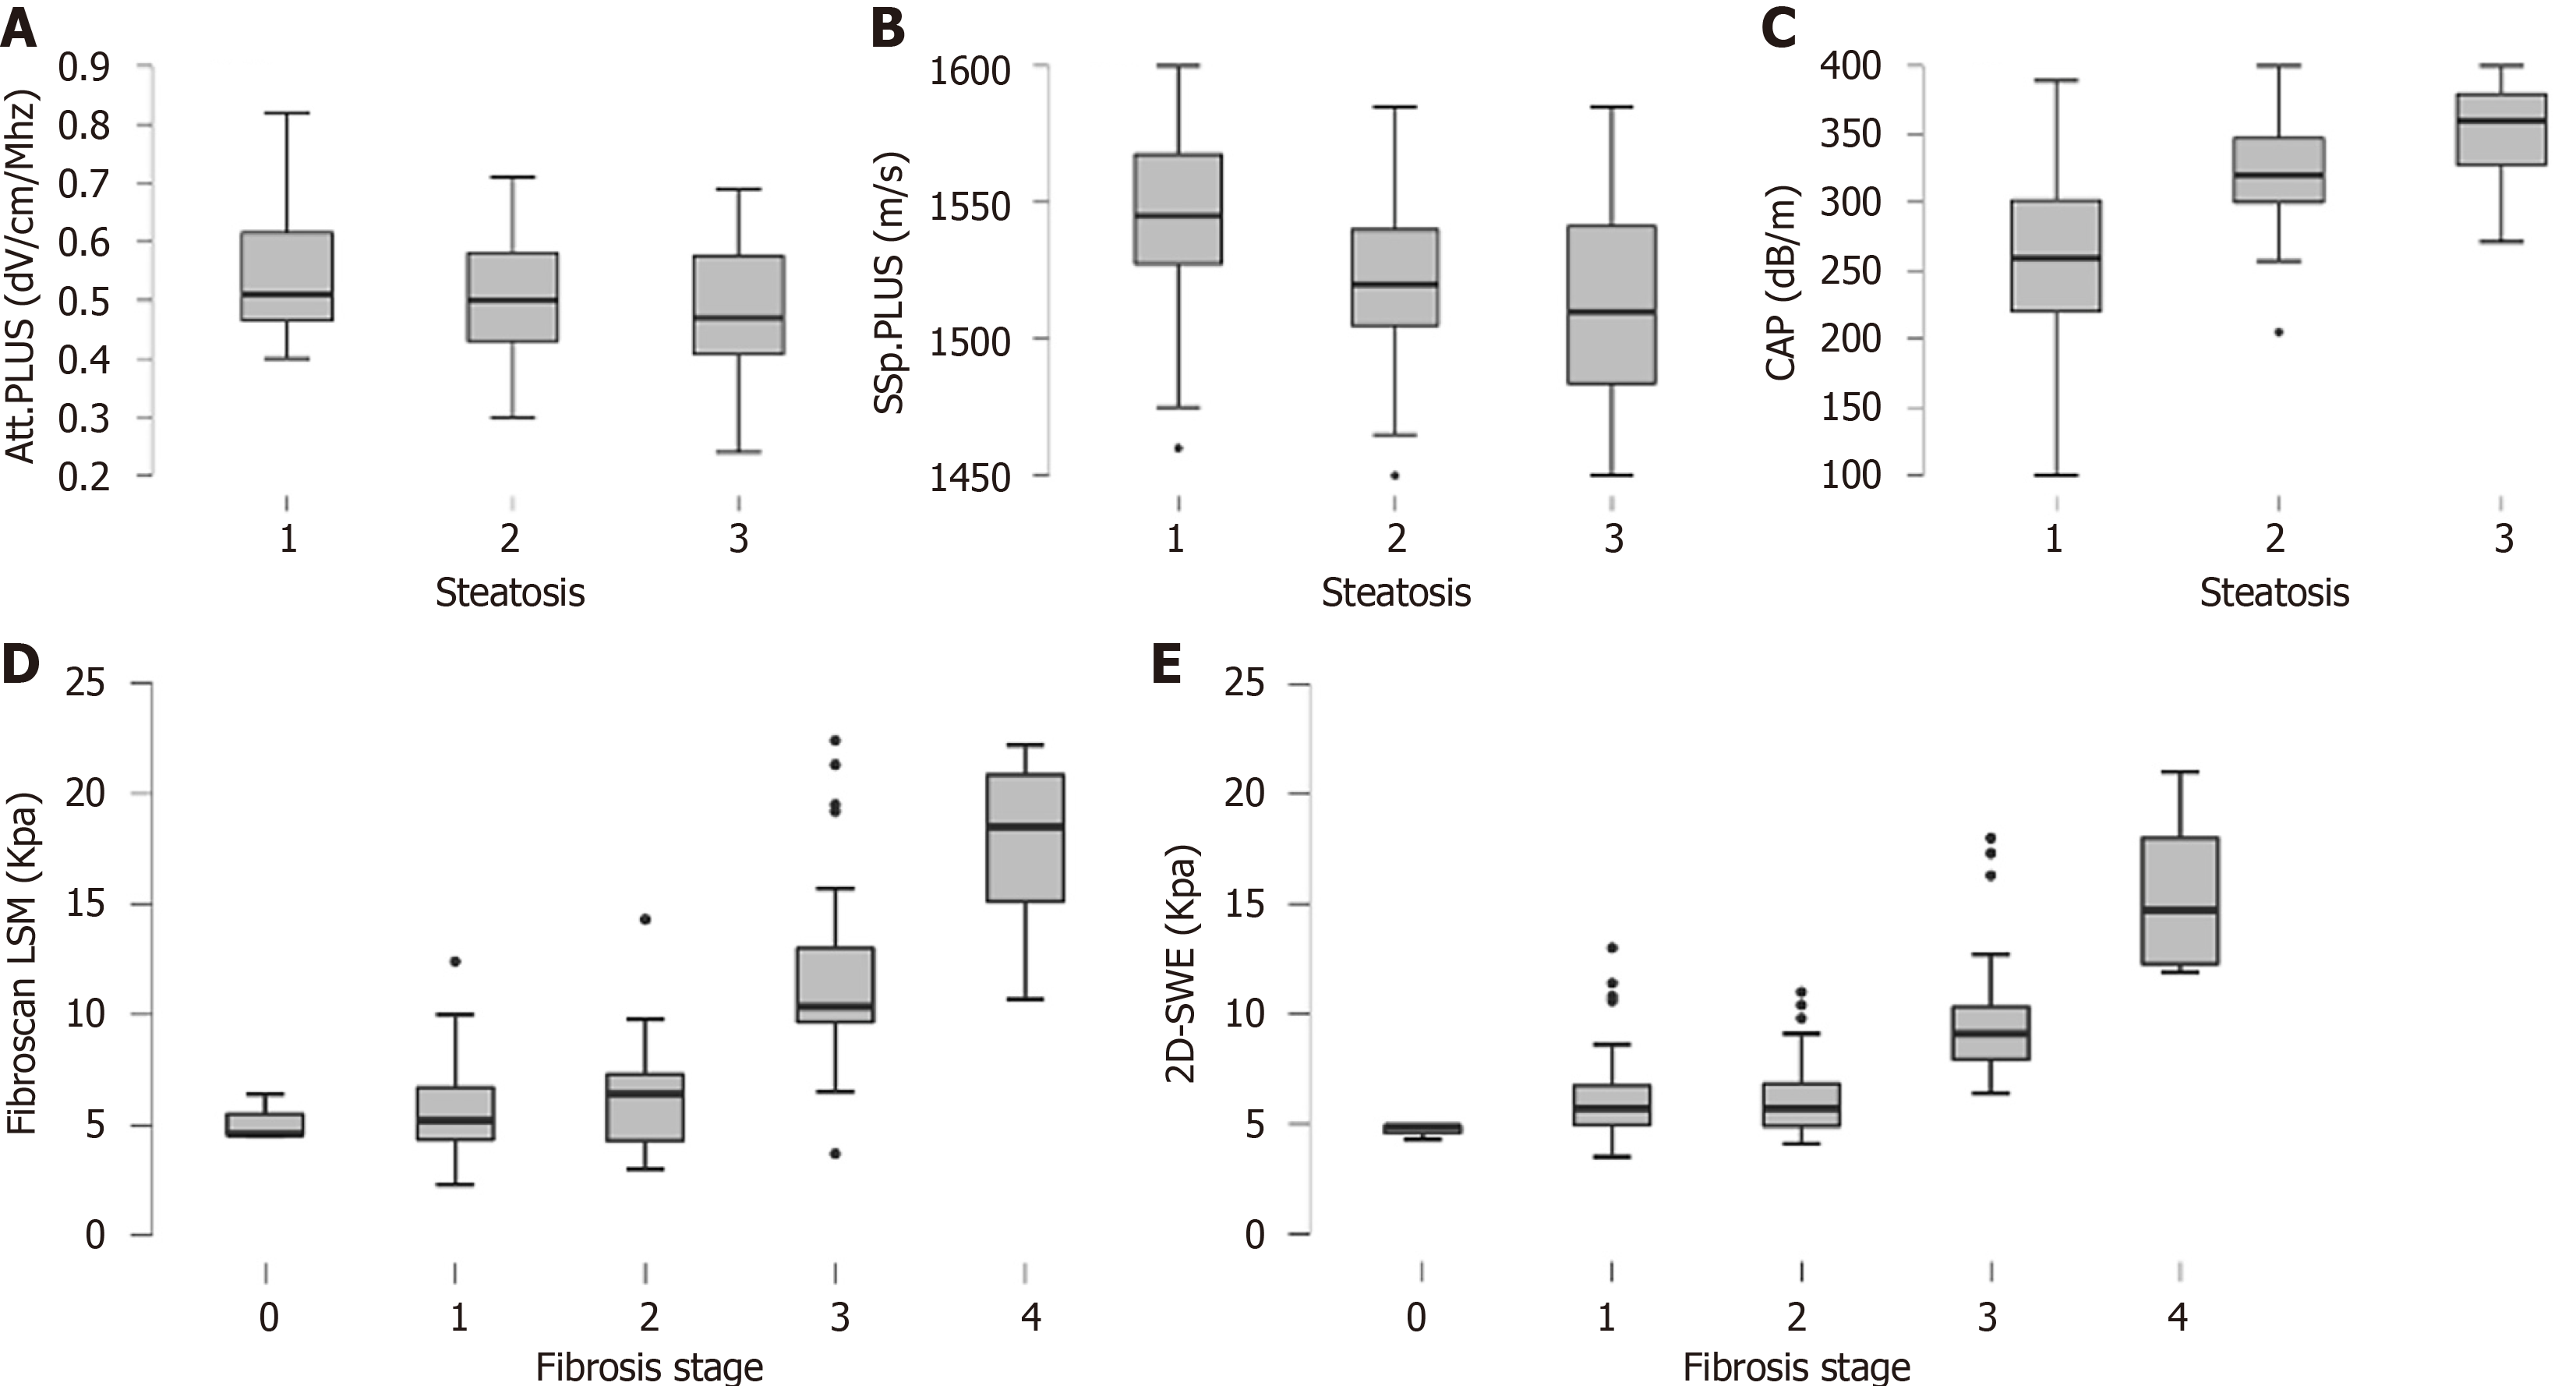
Figure 1 Histological steatosis grade and distribution of liver stiffness measurements according to fibrosis stage.
A: Attenuation plane-wave ultrasound; B: Sound speed plane-wave ultrasound; C: Controlled attenuation parameter; D: Fibroscan score; E: Two-dimensional shear-wave elastography. Boxes represent the interquartile range, and the horizontal line inside the boxes represents the median value of each parameter. CAP: Controlled attenuation parameter; Att.PLUS: Attenuation plane-wave ultrasound; SSp.PLUS: Sound speed plane-wave ultrasound; LSM: Liver stiffness measurement; 2D-SWE: Two-dimensional shear wave elastography.
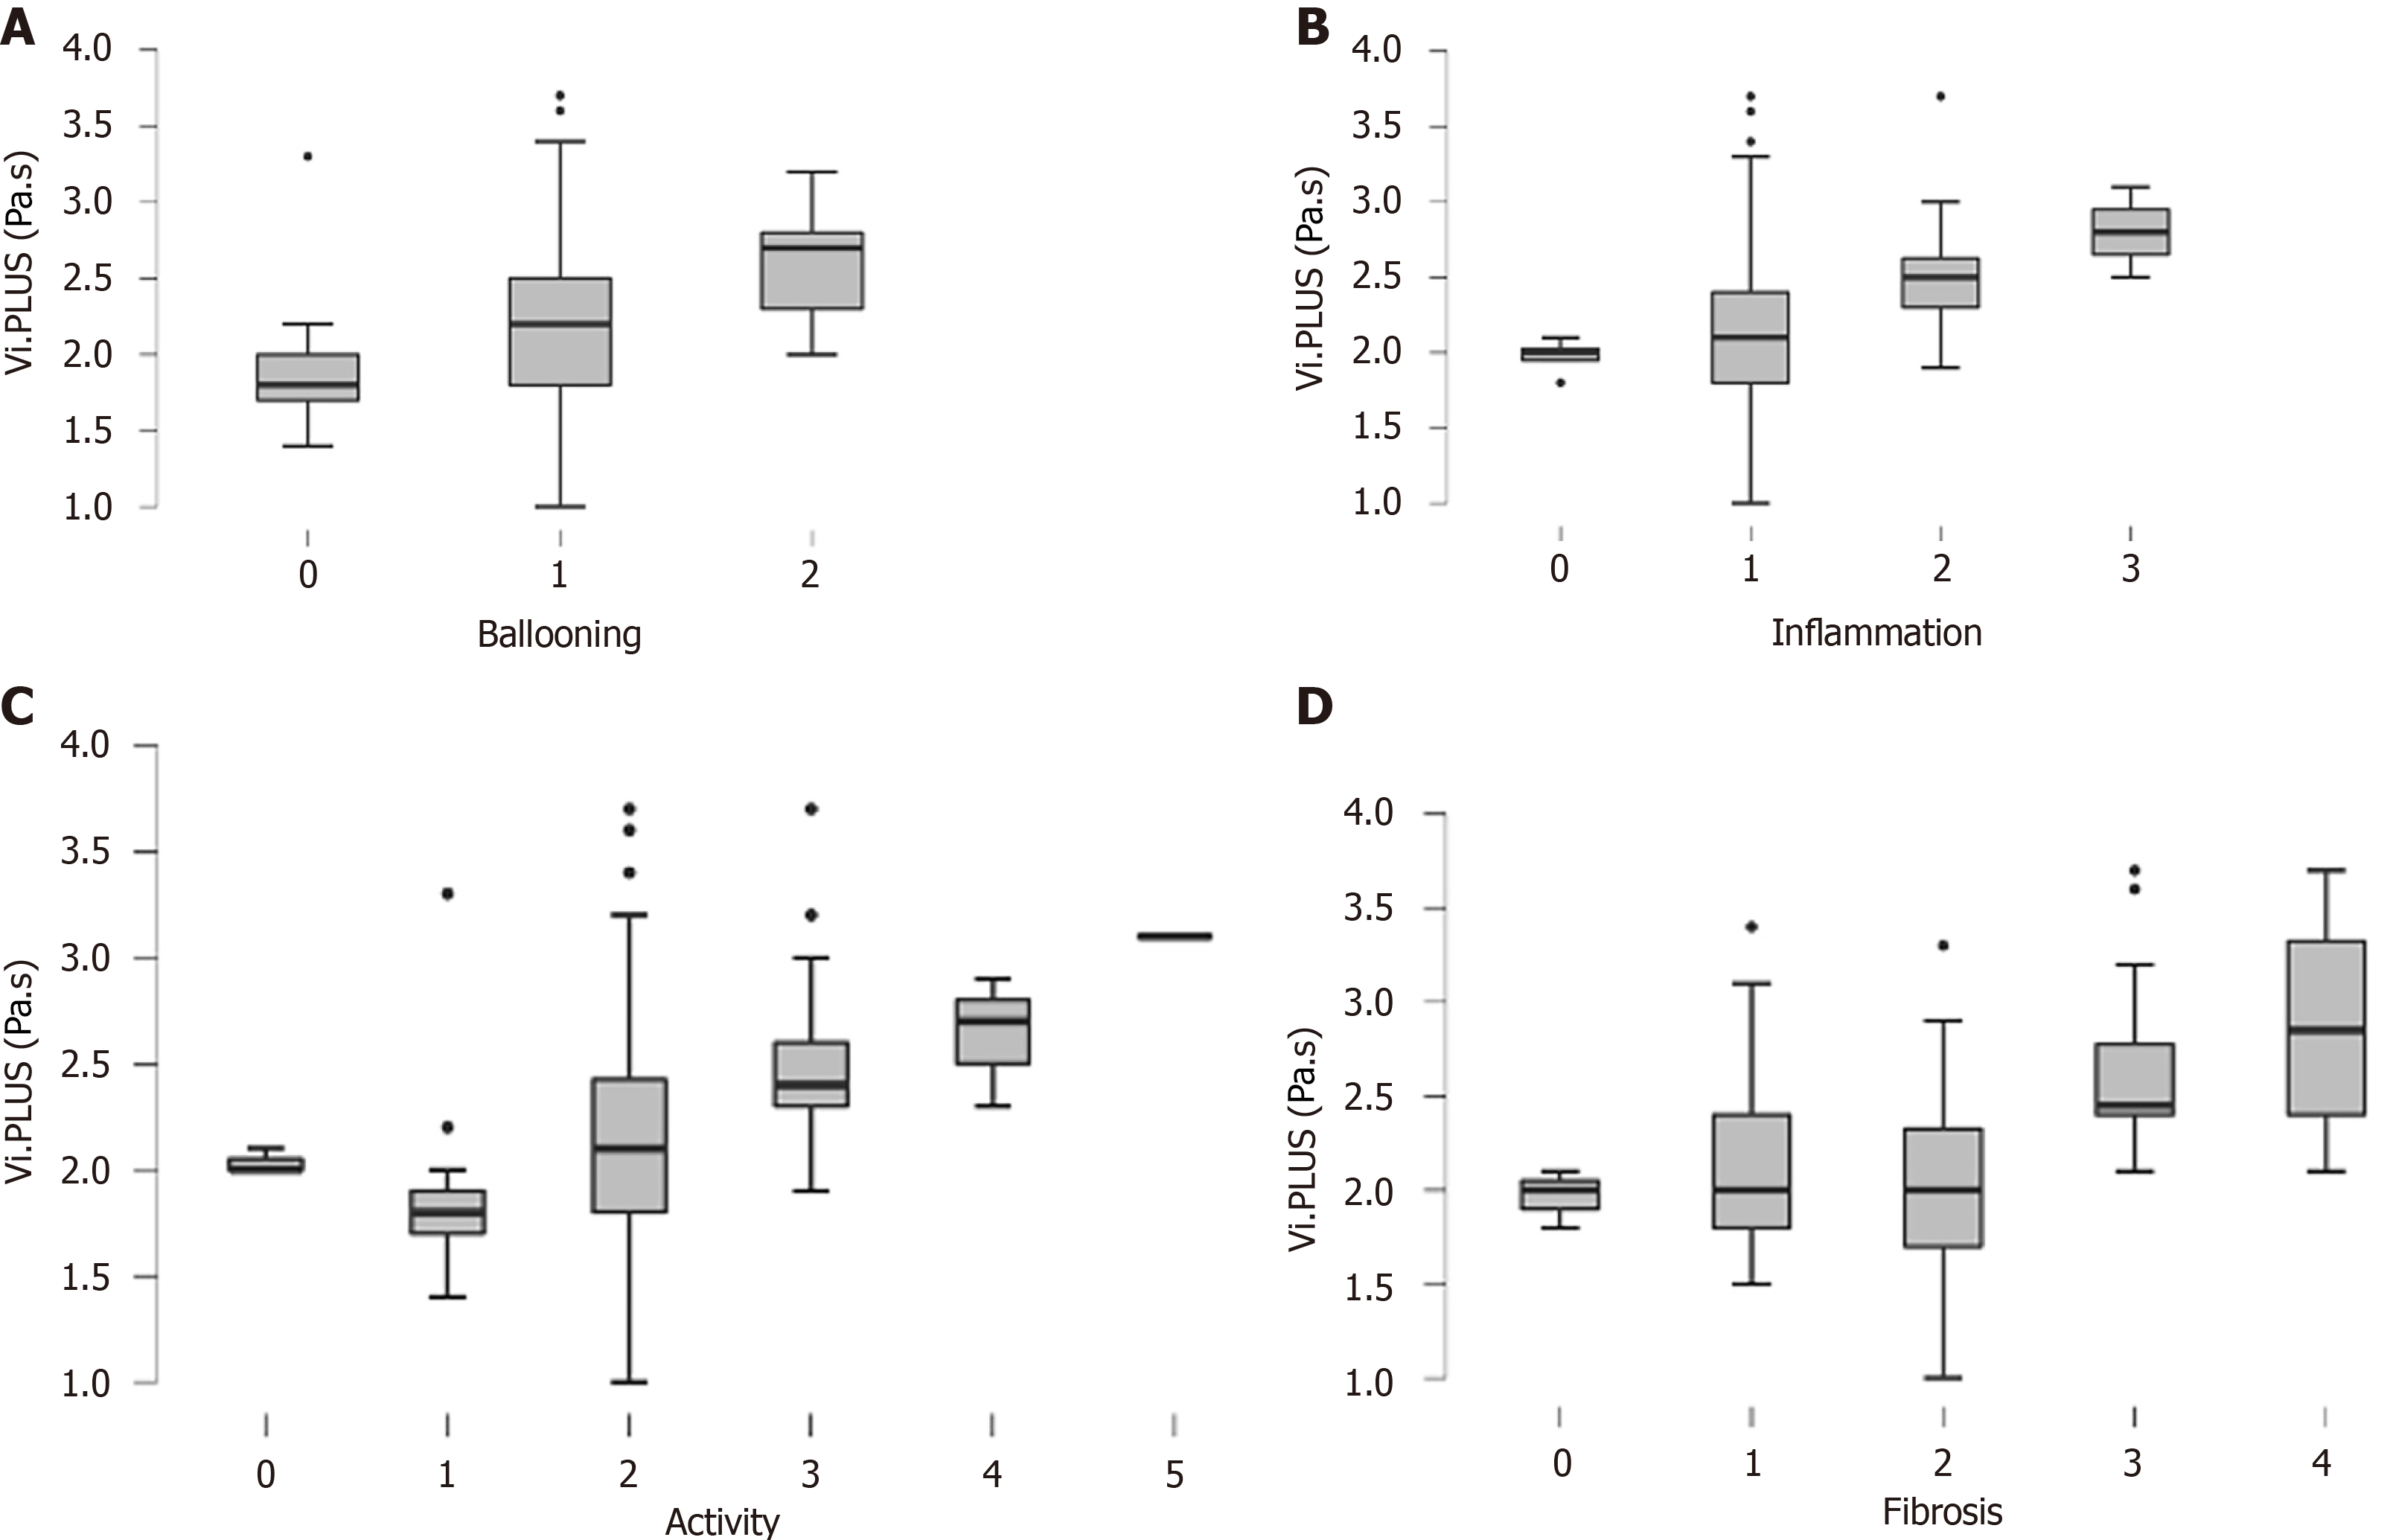
Figure 2 Distribution of viscosity plane-wave ultrasound values according to histological features.
A: According to hepatocyte ballooning grade; B: Lobular inflammation grade; C: Disease activity; D: Liver fibrosis. Boxes represent the interquartile range, and the horizontal line inside the boxes represents the median value of each parameter. Vi.PLUS: Viscosity plane-wave ultrasound.
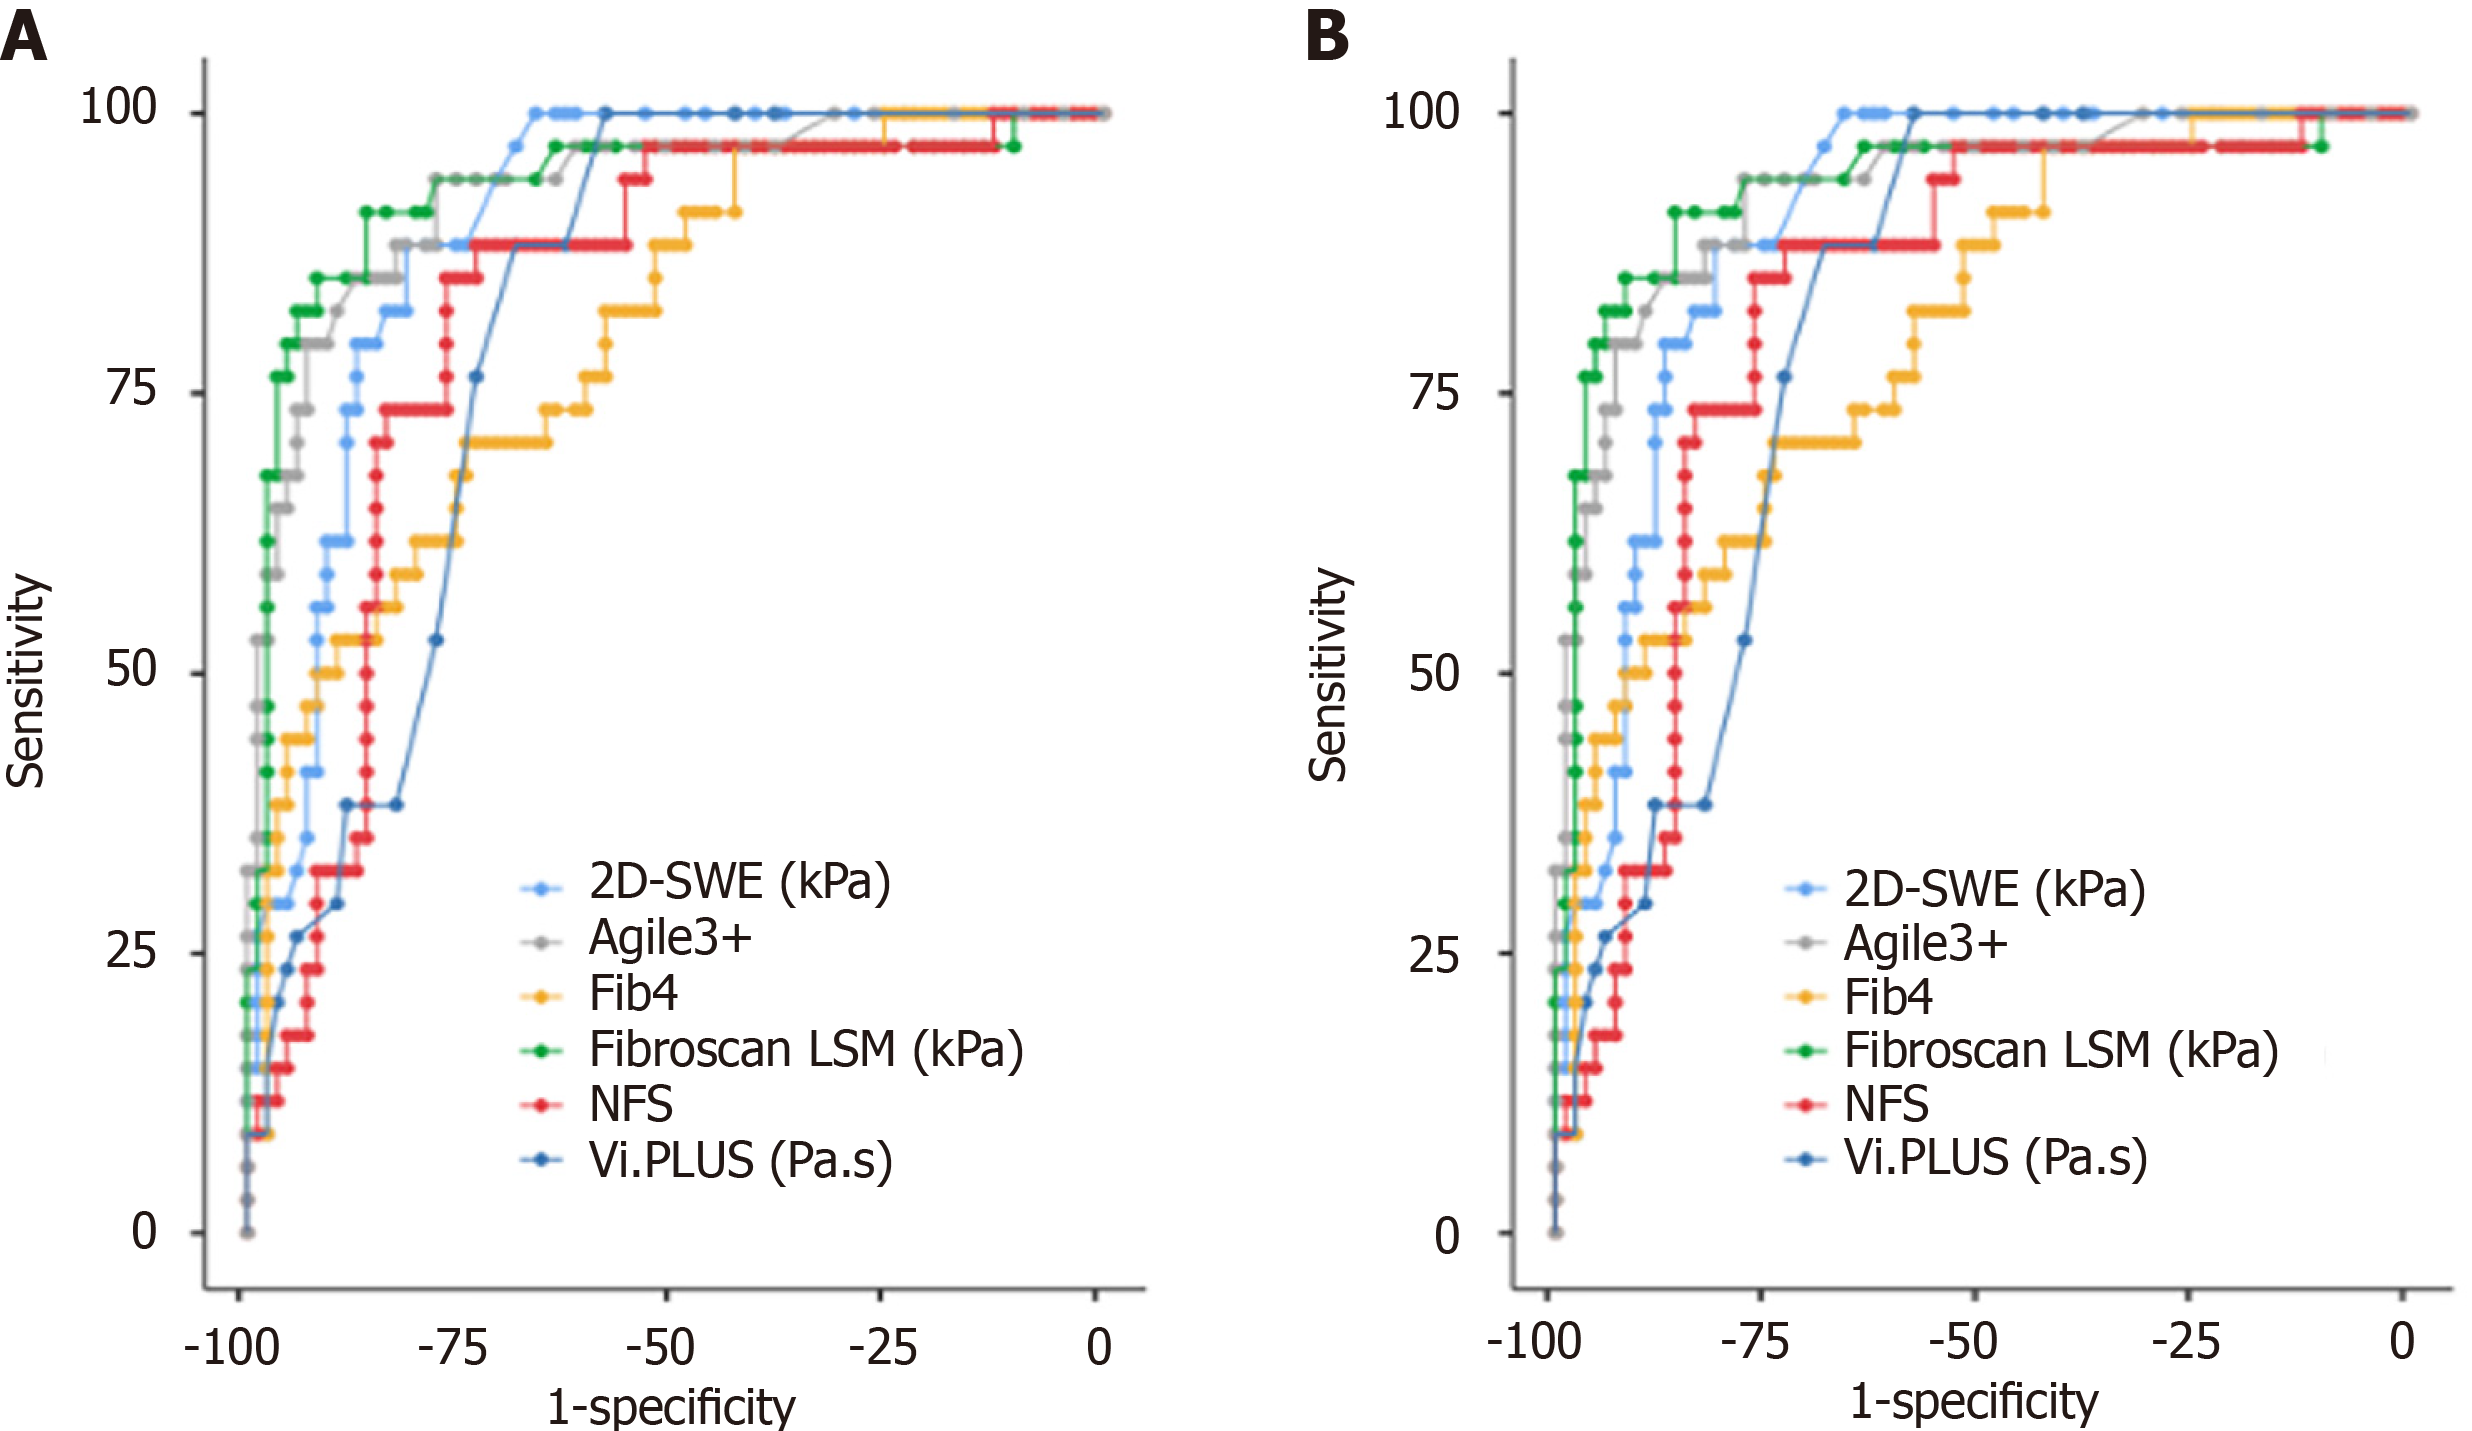
Figure 3 Performance of non-invasive diagnostic tests (transient elastography, two-dimensional shear wave elastography, viscosity plane-wave ultrasound, nonalcoholic fatty liver disease fibrosis score, Agile3 +, and fibrosis-4) for predicting significant fibrosis and advanced fibrosis.
A and B: Receiver operating characteristic curves for the performance of non-invasive diagnostic tests (transient elastography, two-dimensional shear wave elastography, viscosity plane-wave ultrasound, nonalcoholic fatty liver disease fibrosis score, Agile3 +, and fibrosis-4) in the detection of significant fibrosis (A) or advanced fibrosis (B). 2D-SWE: Two-dimensional shear wave elastography; Vi.PLUS: Viscosity plane-wave ultrasound; Fib-4: Fibrosis-4; NFS: Nonalcoholic fatty liver disease fibrosis score; LSM: Liver stiffness measurement.
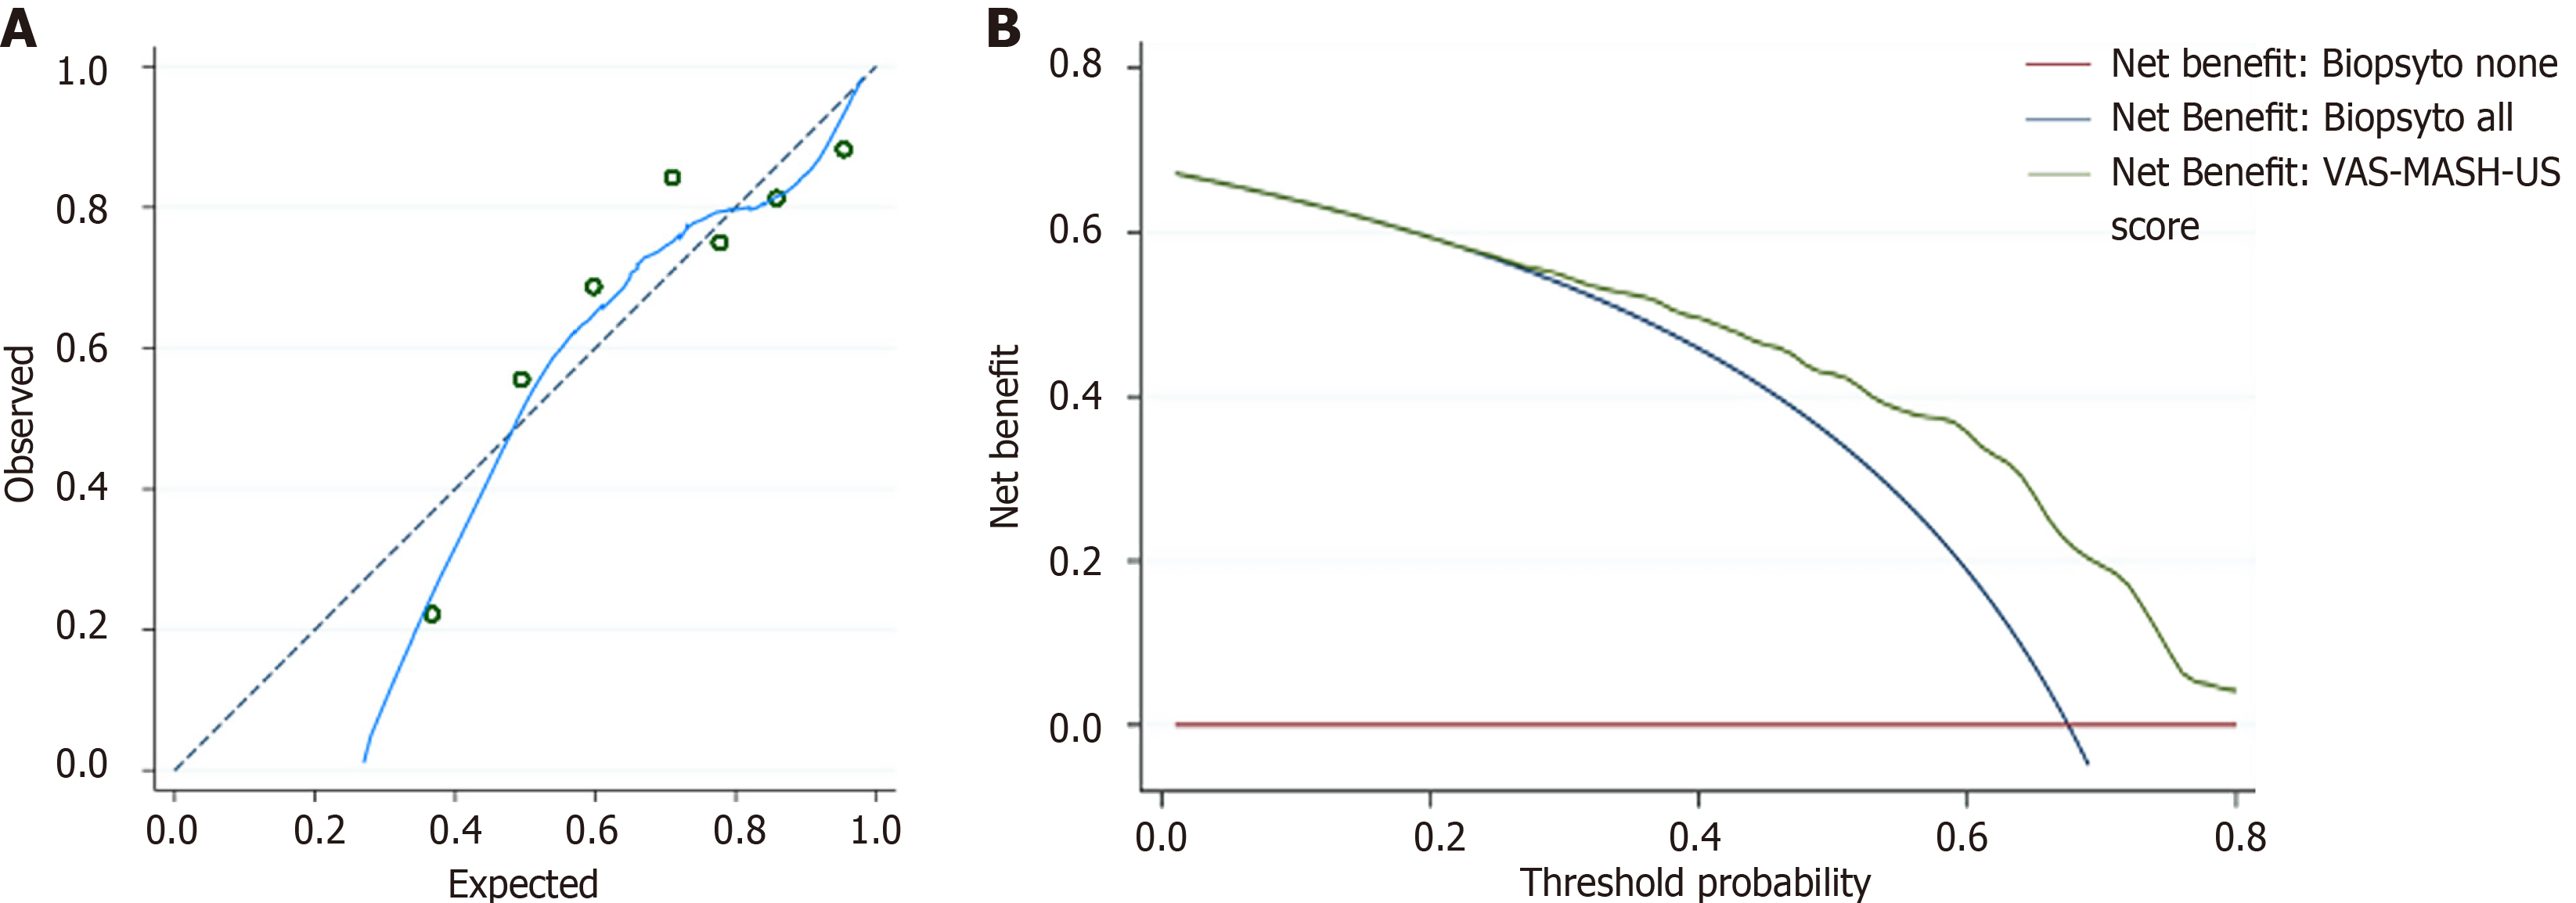
Figure 4 Calibration plot and decision curve analysis for the assessment of metabolic dysfunction-associated steatohepatitis diagnostic performance and net clinical benefit of viscosity-aspartate aminotransferase-speed of sound metabolic dysfunction-associated steatohepatitis ultrasound score.
A: Calibration plot was a visual tool to assess the agreement between predicted risk of metabolic dysfunction-associated steatohepatitis (MASH) according to viscosity-aspartate aminotransferase-speed of sound (VAS) MASH ultrasound (US) score and real prevalence of MASH in different percentiles of population stratified for VAS-MASH-US score. We stratified the population in seven groups (> 15 patients for each group) according to the VAS-MASH-US (green dots). Blue line represents the estimated calibration line for the entire population. Dotted line represents the perfect calibration line; B: Decision curves of the VAS-MASH-US score for the diagnosis of MASH in comparison with default strategies of performing liver biopsy to all patients (“biopsy to all”) or to none (“biopsy to none”). Threshold probability was plotted on the horizontal axis and net benefit on the vertical axis, illustrating the trade-offs between benefit (true positives) and harm (false positives) as the threshold probability (preference) was varied across a range of reasonable threshold probabilities. Net benefit on the vertical axis was expressed in units of true positives per person. For instance, a difference in net benefit of 0.1 at a given threshold probability between using the VAS-MASH-US score to select patients for liver biopsy or perform liver biopsy to all patients could be interpreted as using the VAS-MASH-US score to select patients for liver biopsy instead of perform liver biopsy to all patients increases the number of MASH detected by 10 per 100 patients, without changing the number of unnecessary biopsies. VAS-MASH-US: Viscosity-aspartate aminotransferase-speed of sound metabolic dysfunction-associated steatohepatitis ultrasound.
- Citation: Liguori A, Ainora ME, Di Gialleonardo L, Viceconti N, Petrucci L, Esposto G, Giustiniani MC, Mignini I, Borriello R, Galasso L, Paratore M, Garcovich M, Riccardi L, Pompili M, Grieco A, Gasbarrini A, Miele L, Zocco MA. Multiparametric ultrasound for non-invasive assessment of liver steatosis, fibrosis, and inflammation in metabolic dysfunction-associated steatotic liver disease. World J Gastroenterol 2025; 31(25): 105518
- URL: https://www.wjgnet.com/1007-9327/full/v31/i25/105518.htm
- DOI: https://dx.doi.org/10.3748/wjg.v31.i25.105518


