Copyright
©The Author(s) 2025.
World J Gastroenterol. Jun 21, 2025; 31(23): 106949
Published online Jun 21, 2025. doi: 10.3748/wjg.v31.i23.106949
Published online Jun 21, 2025. doi: 10.3748/wjg.v31.i23.106949
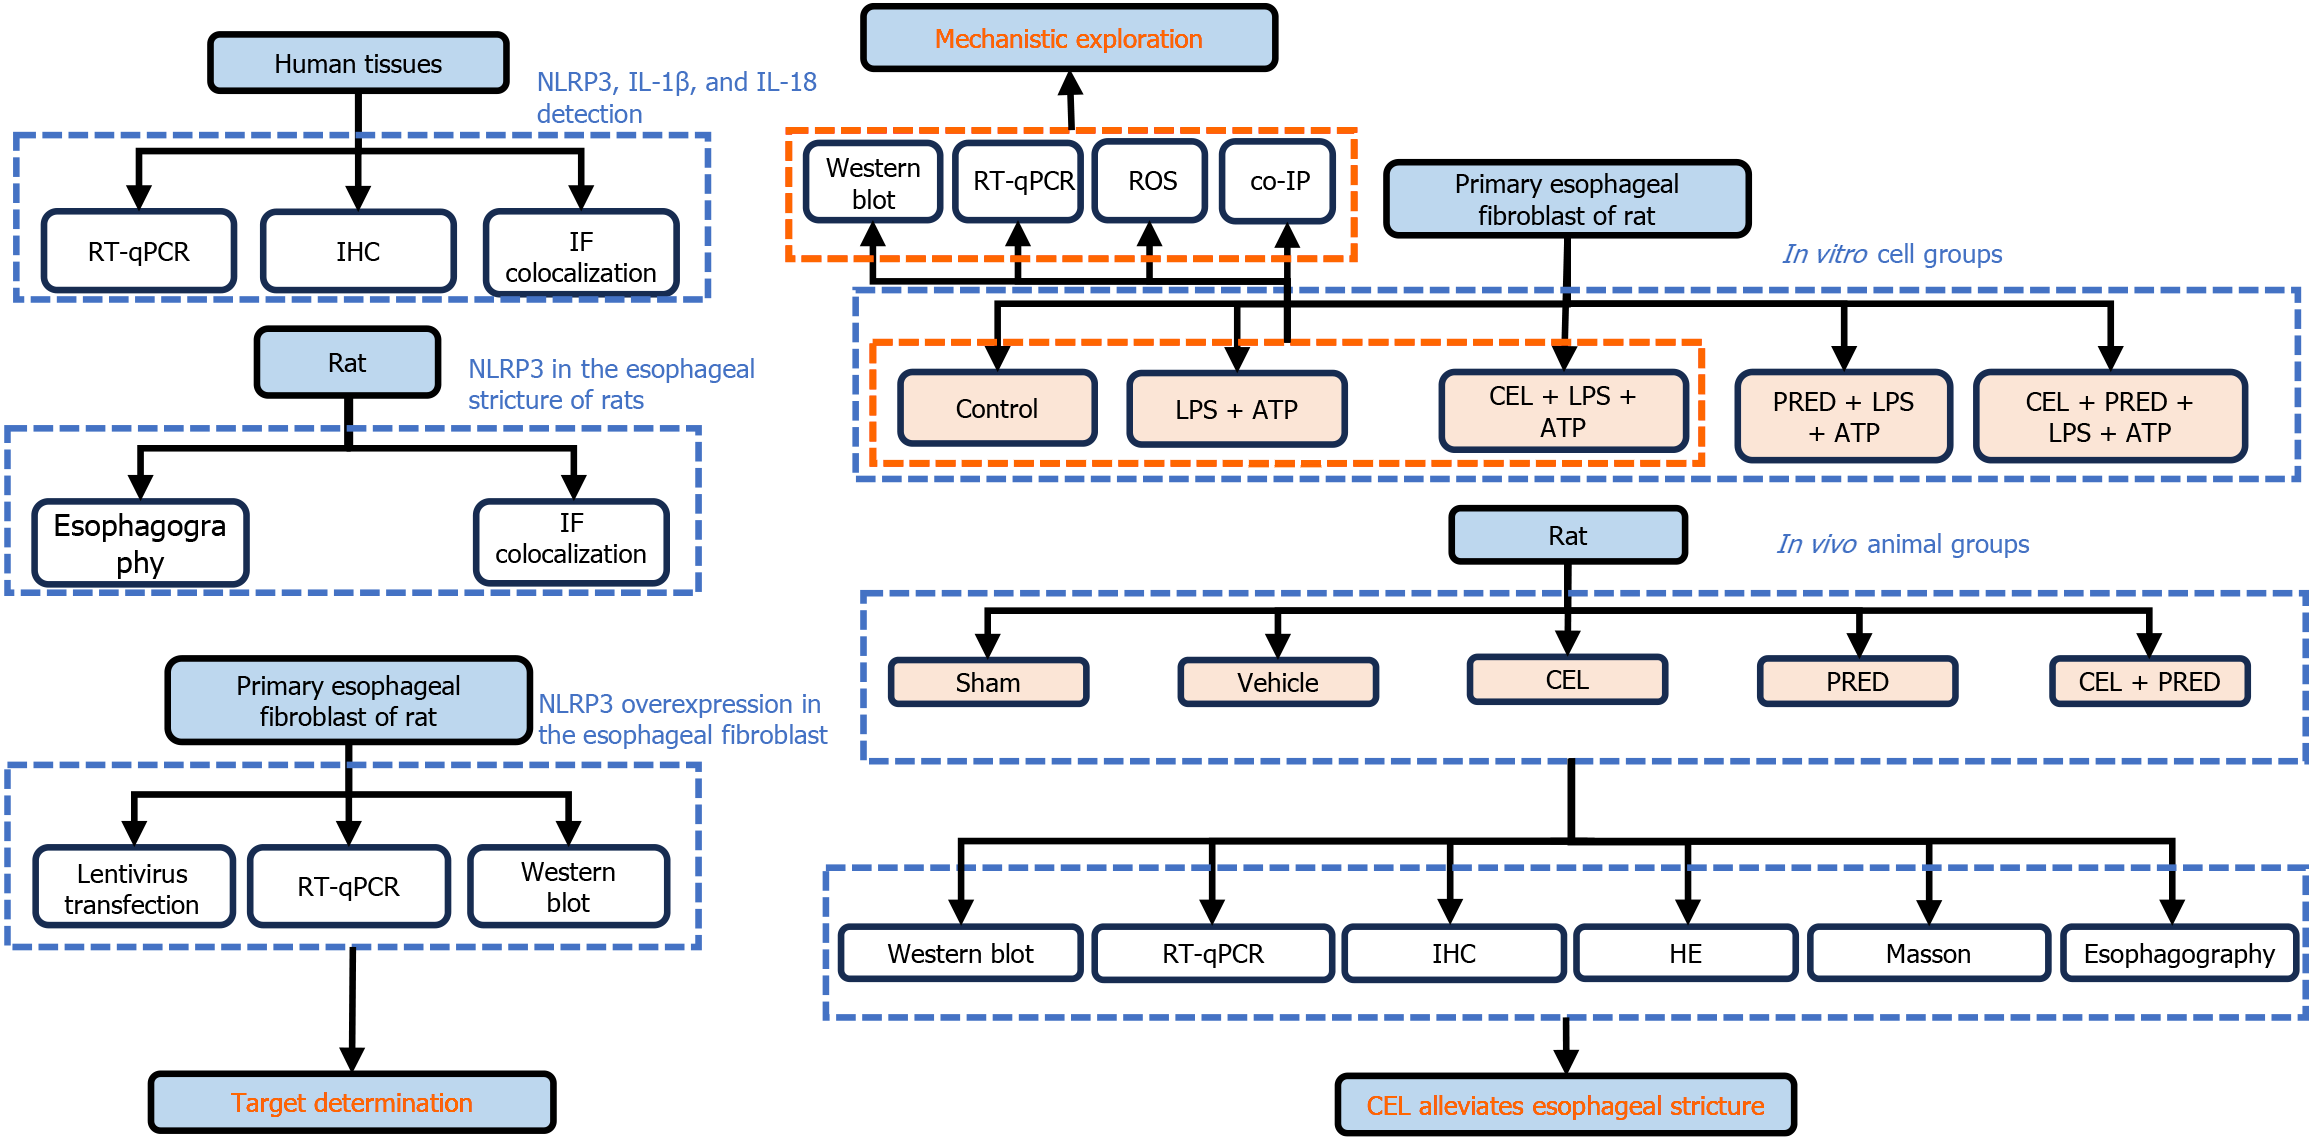
Figure 1 Schematic diagram of the study design.
NLRP3: NLR family pyrin domain containing 3; IL: Interleukin; RT-qPCR: Reverse transcription and quantitative real-time PCR; IHC: Immunohistochemistry; IF: Immunofluorescence; ROS: Reactive oxygen species; CEL: Celastrol; PRED: Prednisolone; LPS: Lipopolysaccharide; ATP: Adenosine triphosphate; HE: Hematoxylin-eosin.
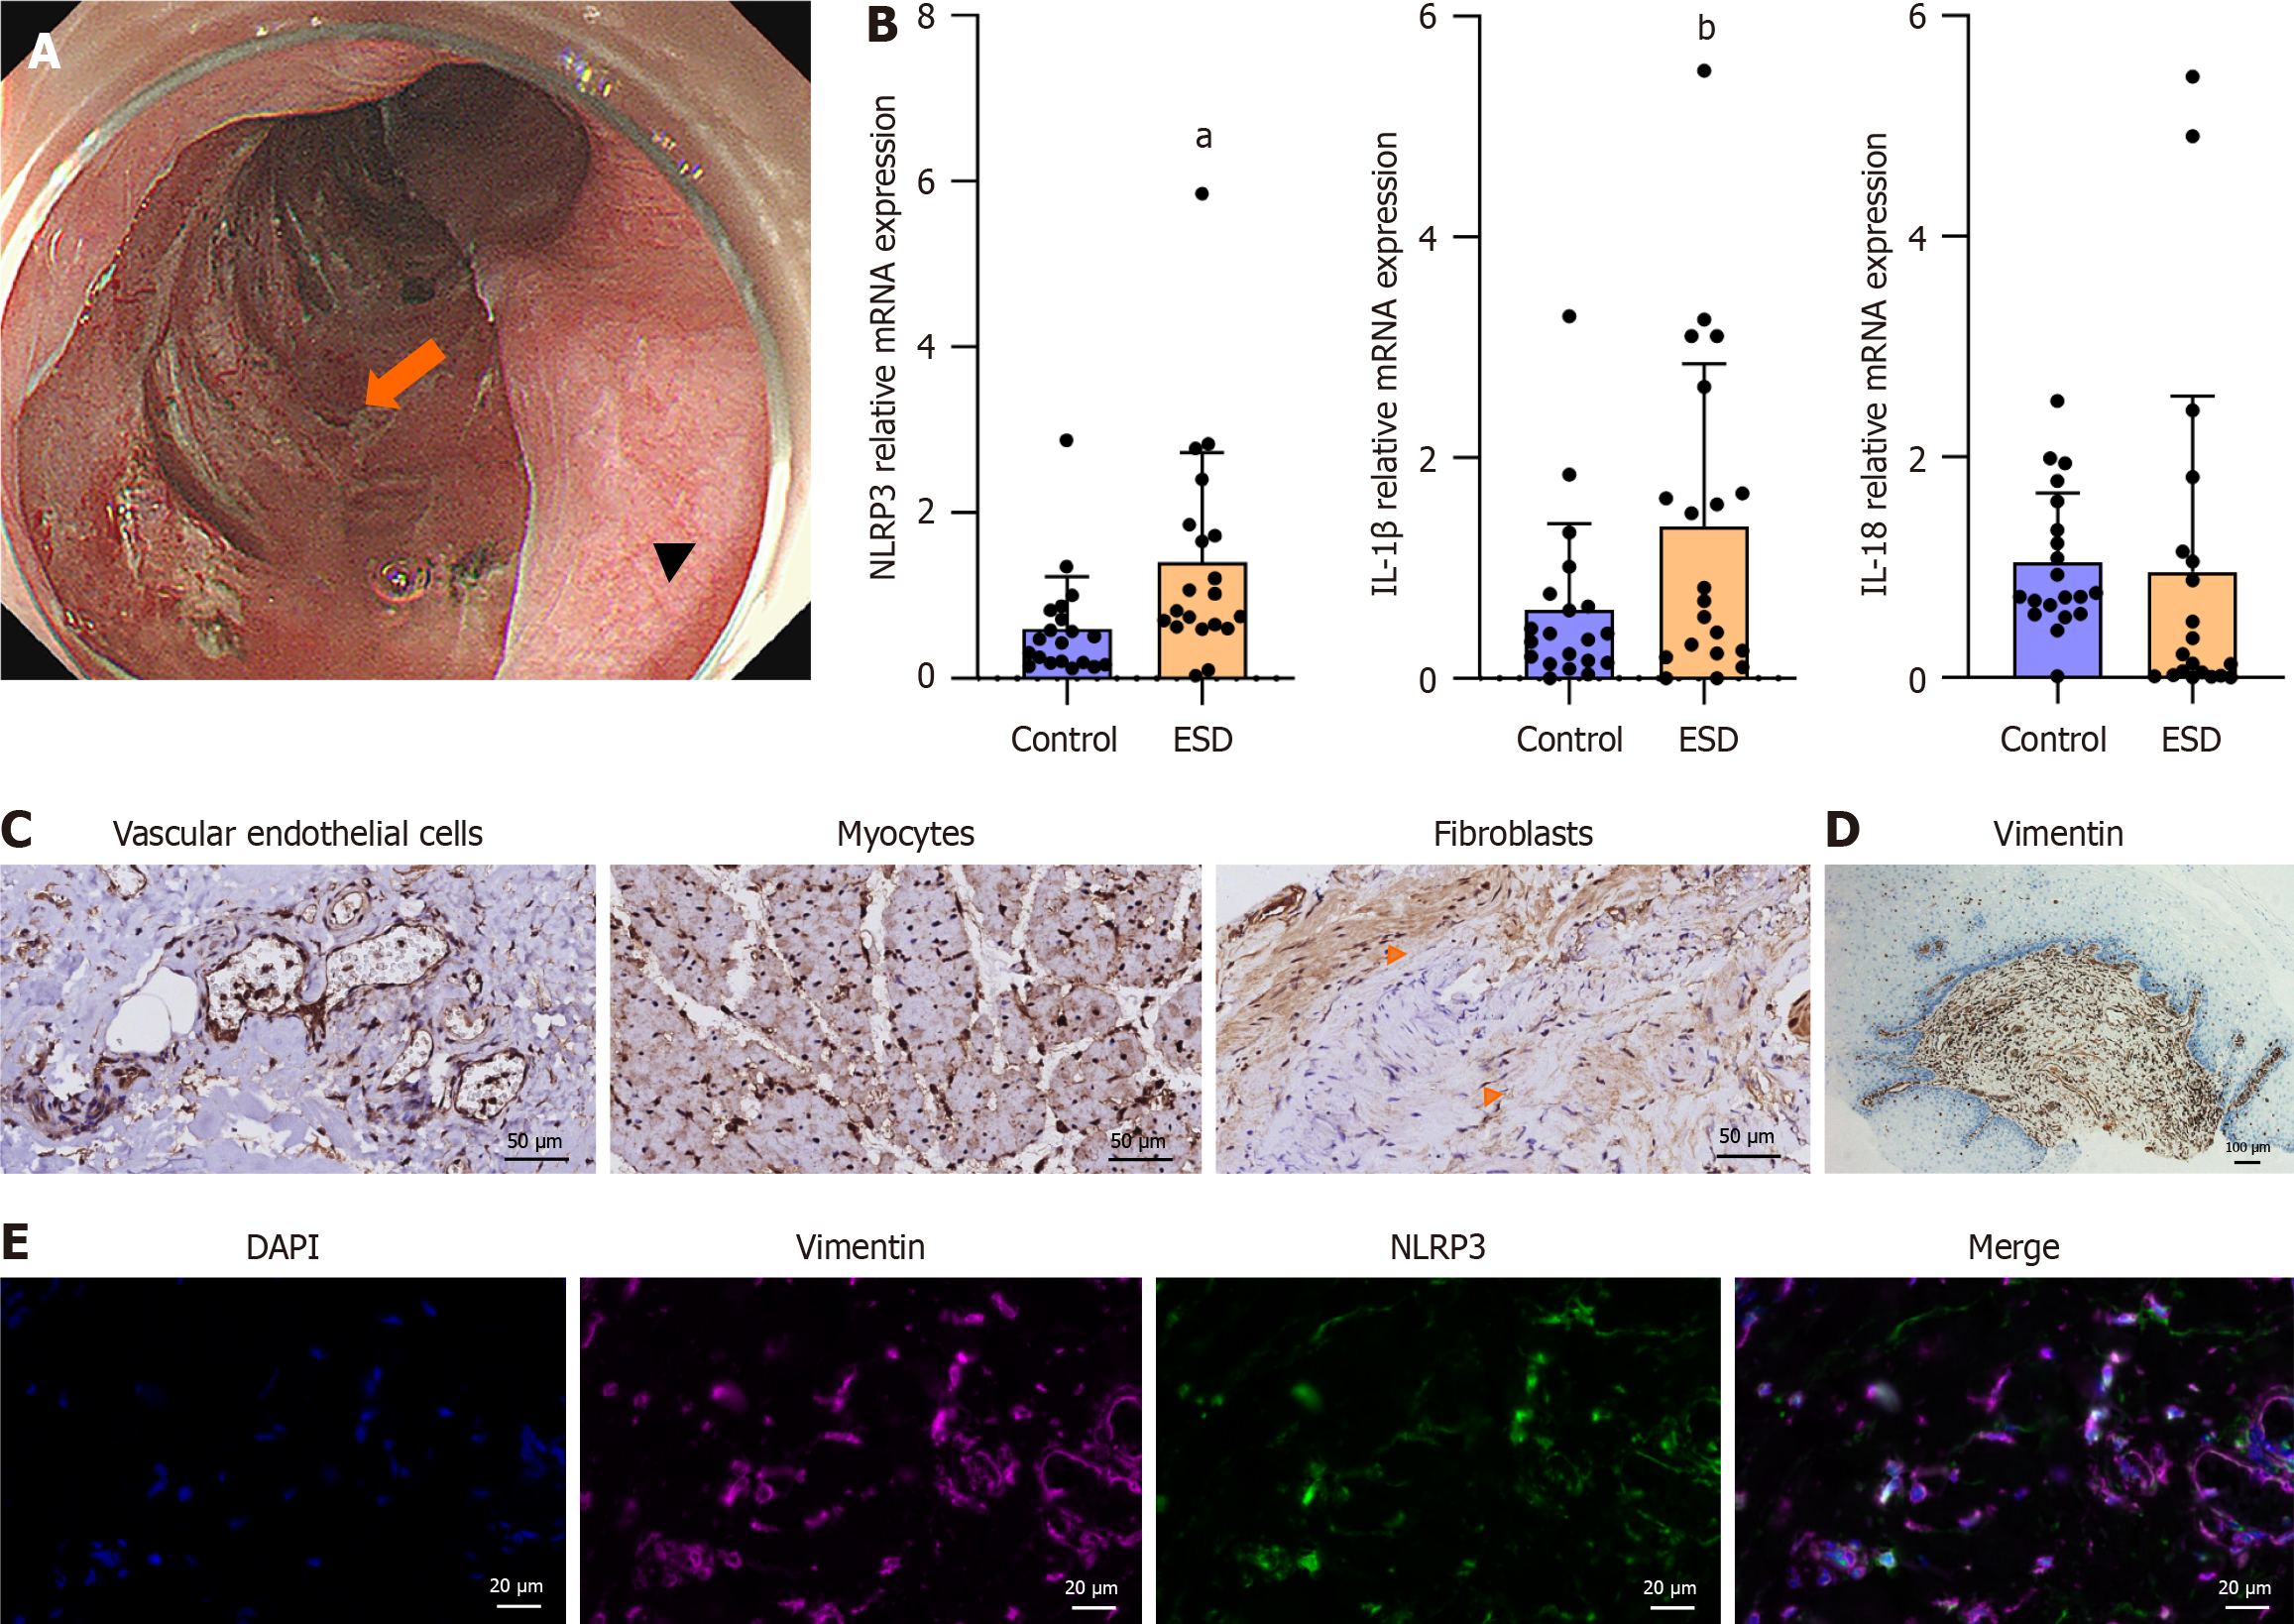
Figure 2 NLR family pyrin domain containing 3 associated inflammatory mediators in the endoscopic submucosal dissection resection bed.
A: Tissue acquisition site in the post-endoscopic submucosal dissection (ESD) esophagus. Arrowhead: The ESD resection bed; Arrow: The normal esophageal mucosa; B: mRNA levels of NLR family pyrin domain containing 3 (NLRP3), interleukin (IL)-1β, and IL-18 (presented as the mean ± SD). Control: Tissues from normal esophageal mucosa; ESD: Tissues from the resection bed. Statistical analysis was performed using the Wilcoxon signed-rank test, aP = 0.009; bP = 0.02; C: Immunohistochemistry (IHC) of NLRP3 in the post-ESD resection bed: Vascular endothelial cells, myocytes, and fibroblasts (arrows). Scale bar = 50 μm; D: IHC of vimentin in human tissues from post-ESD esophageal stricture. Scale bar = 100 μm; E: Dual labeling for NLRP3 and vimentin was performed in human tissues from the resection bed. Scale bar = 20 μm. ESD: Endoscopic submucosal dissection; IL: Interleukin; NLRP3: NLR family pyrin domain containing 3.
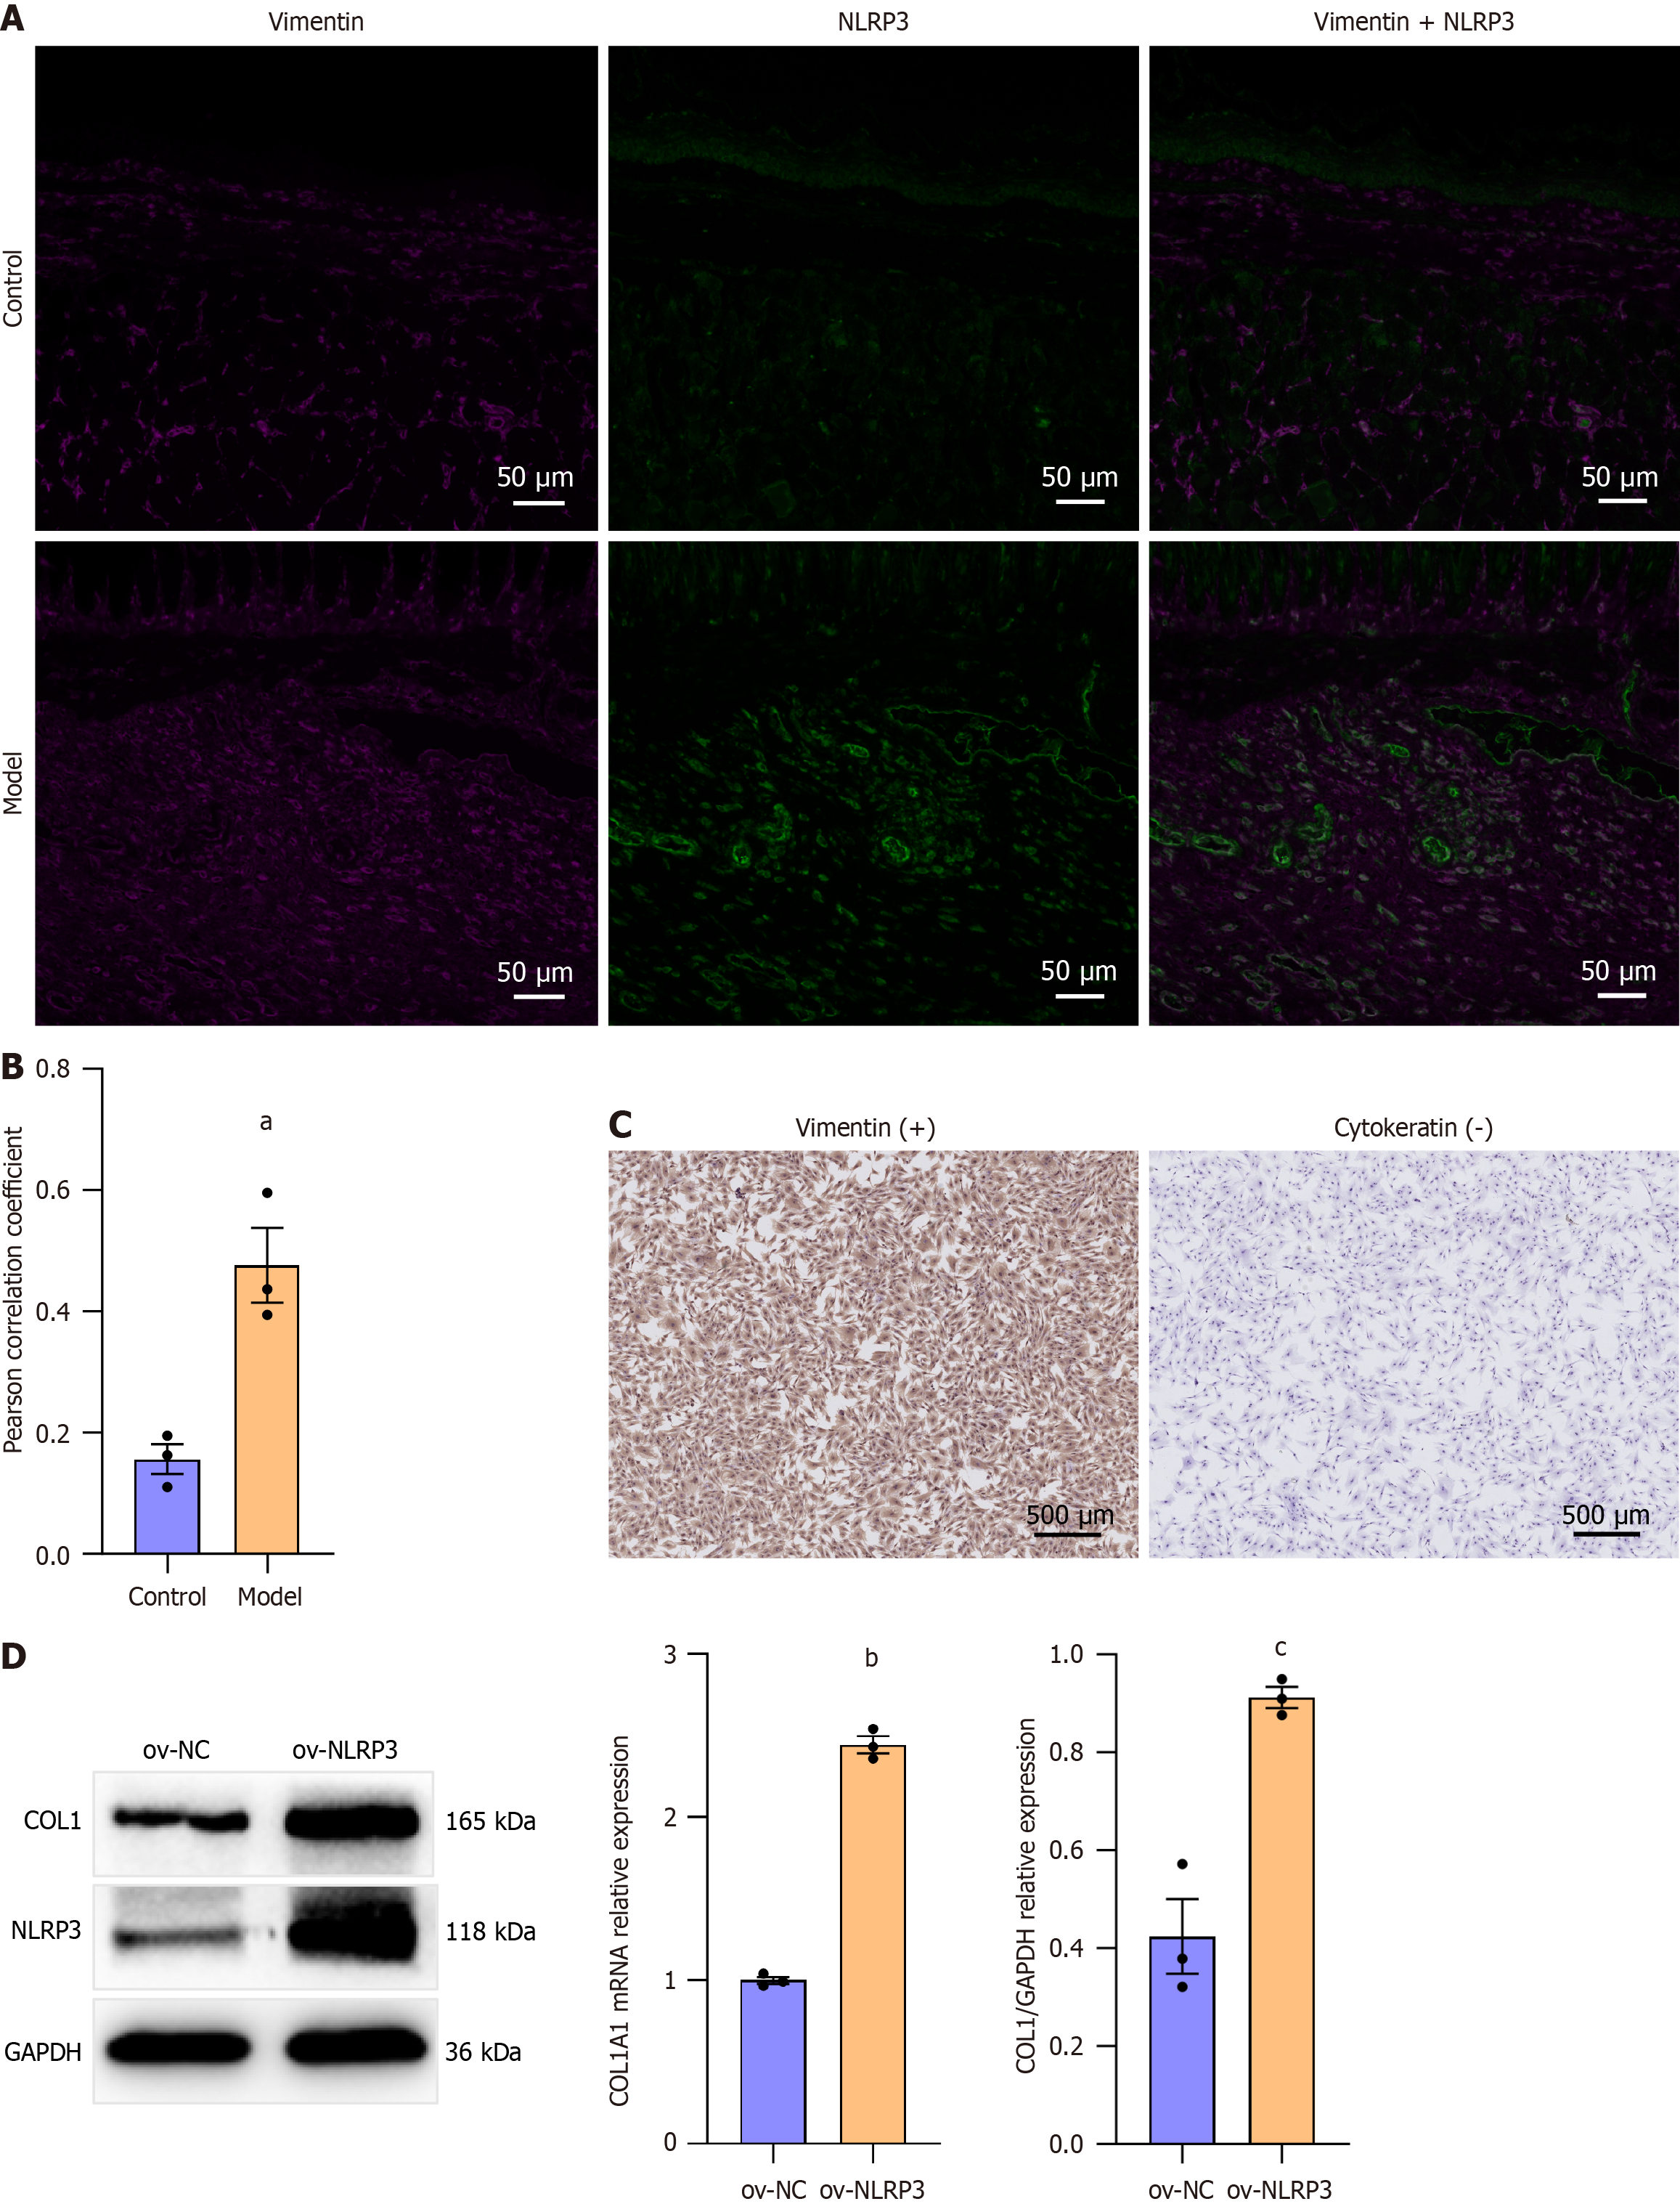
Figure 3 NLR family pyrin domain containing 3 expression in rat esophageal fibroblasts in the narrowed esophagus.
A: Representative Immunofluorescence image of NLR family pyrin domain containing 3 (NLRP3) and vimentin colocalization in the healthy esophagus (control) and fibrotic esophagus (model) in rats. Scale bar = 50 μm; B: Pearson correlation coefficient of NLRP3 and vimentin in the rat esophagus (presented as mean ± SE). Statistical analysis was performed using the Student’s t test, aP = 0.009; C: Immunohistochemistry of vimentin and cytokeratin 19 in primary rat esophageal fibroblasts (REFs). Scale bar = 500 μm; D: Western blot analysis and mRNA levels of collagen 1 in primary REFs transfected with control or NLRP3 overexpression lentiviral particles for 72 hours (presented as mean ± SE). Statistical analysis was performed using the Student’s t test. bP < 0.001; cP = 0.003; NLRP3: NLR family pyrin domain containing 3; NC: Negative control.
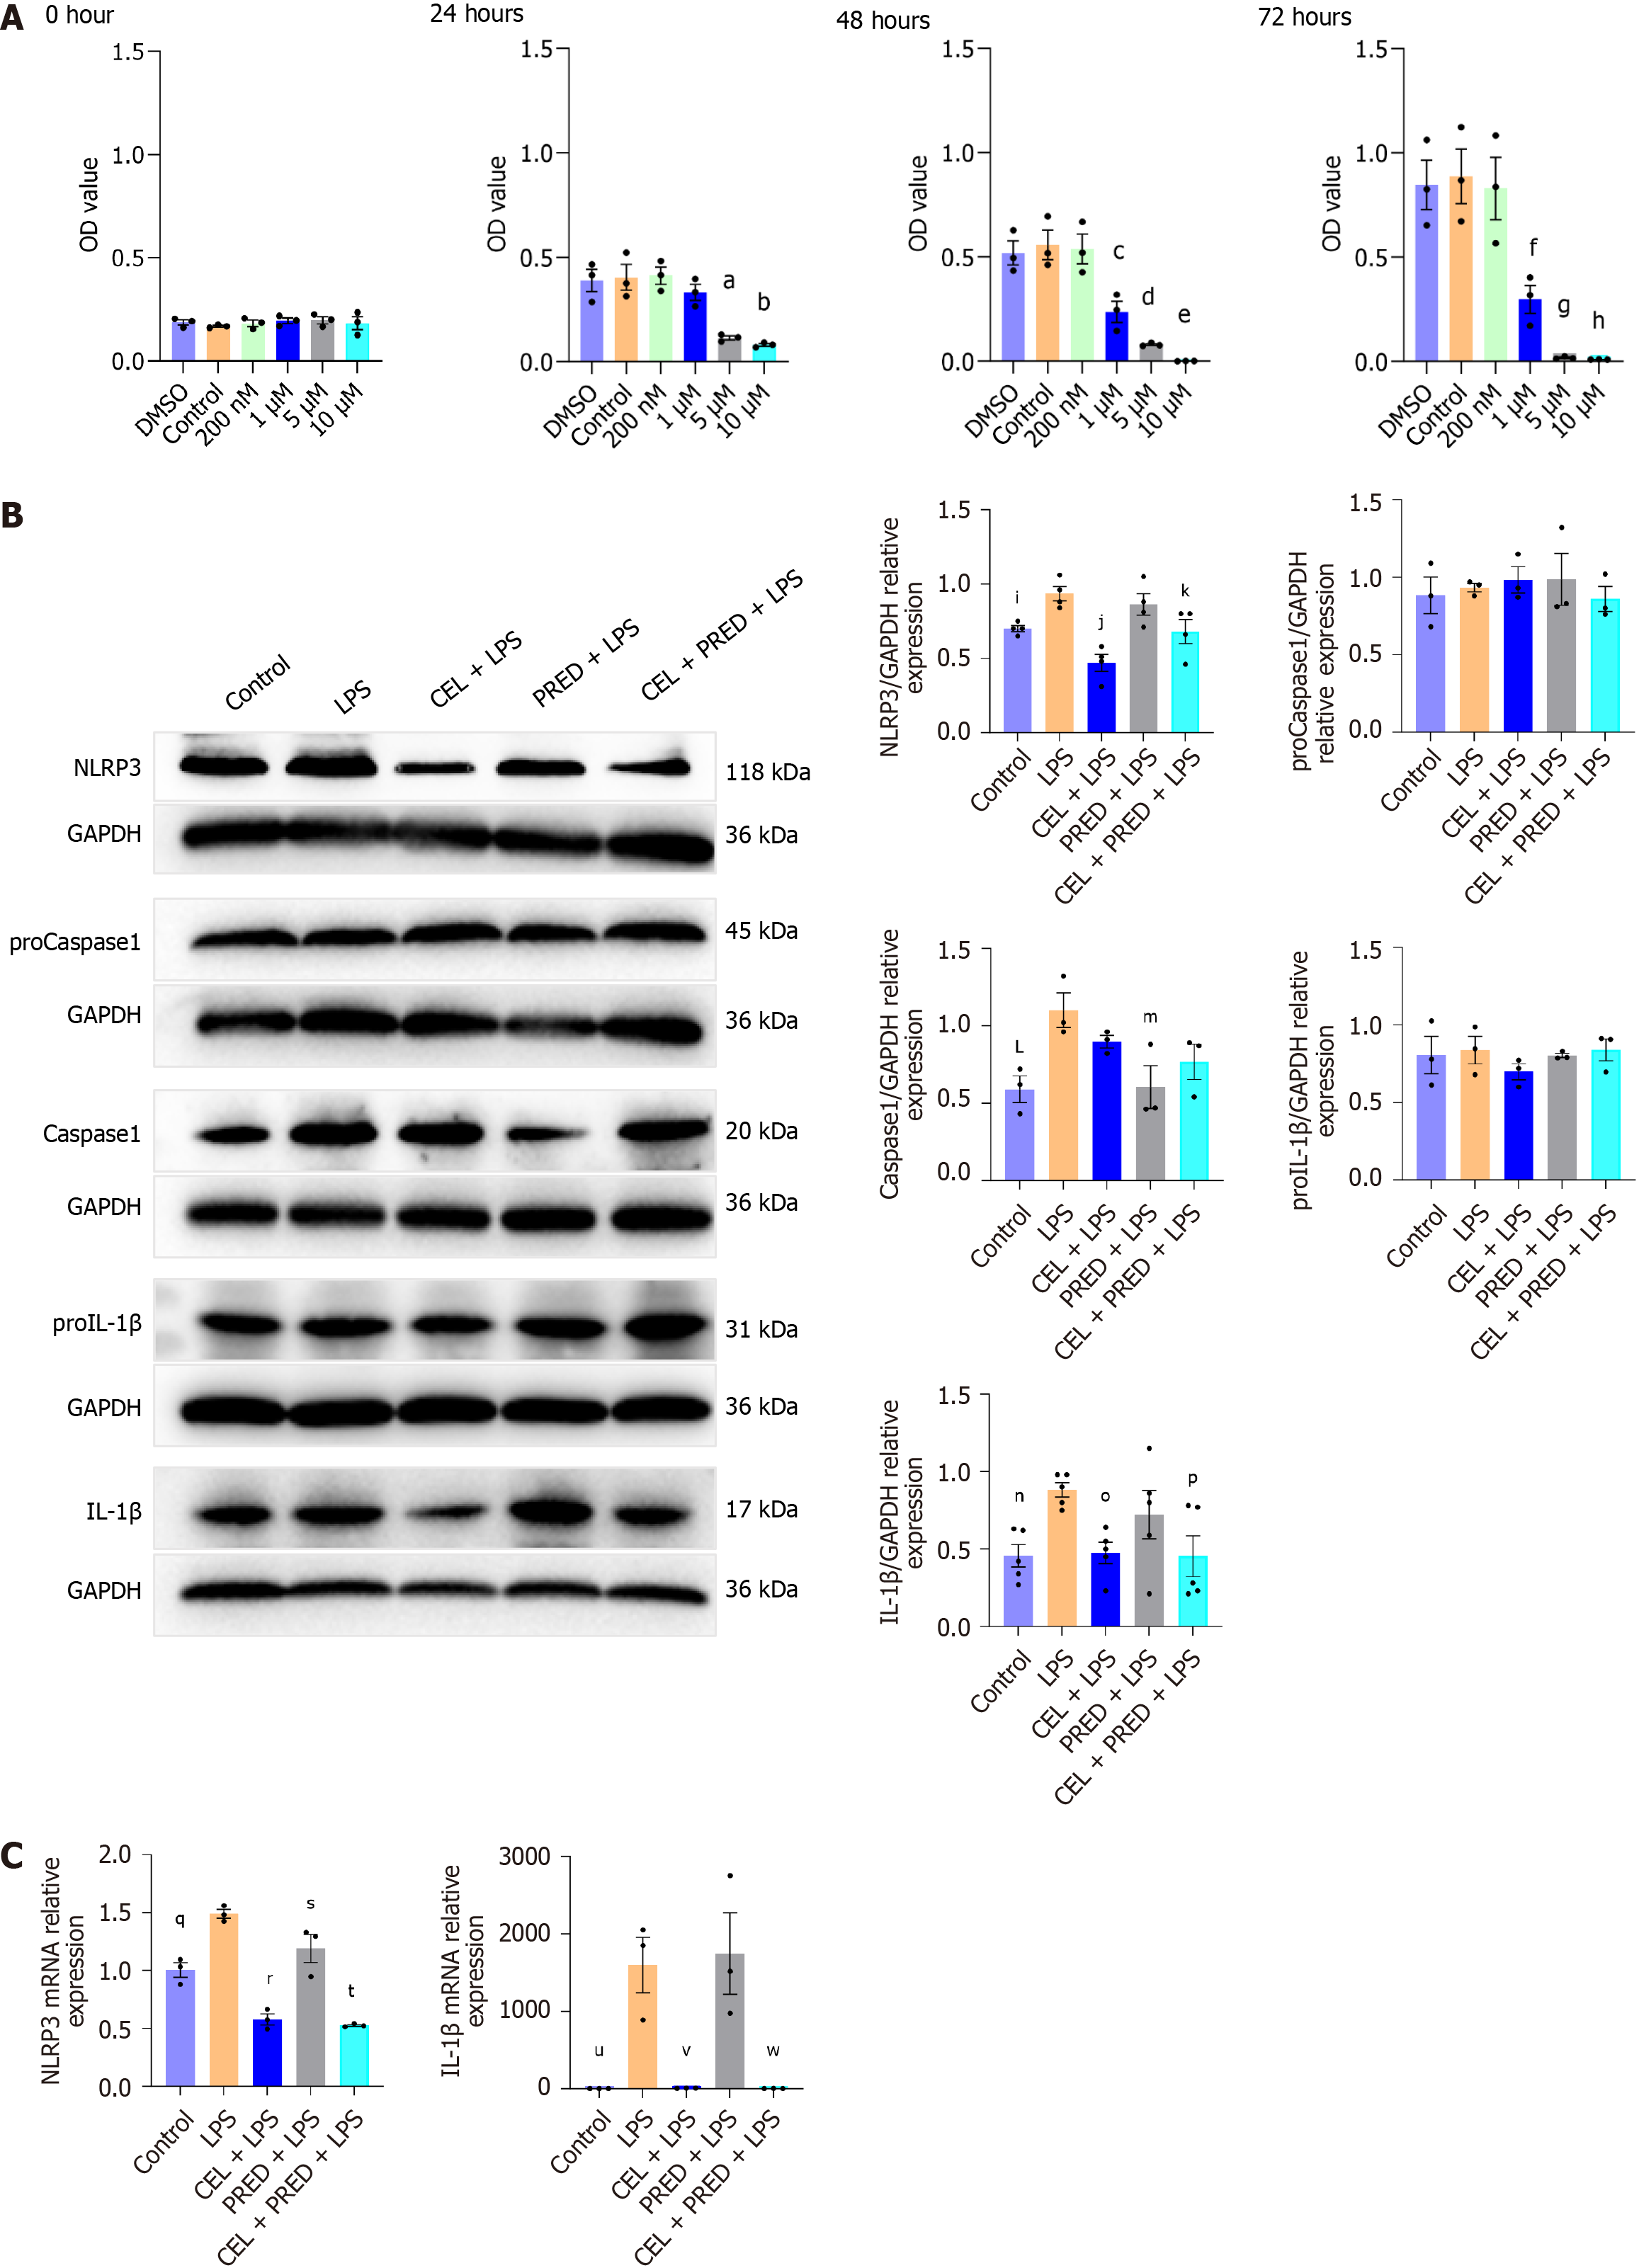
Figure 4 The effect of celastrol on NLR family pyrin domain containing 3 activation in primary rat esophageal fibroblasts.
A: CCK8 assay of celastrol (CEL) in primary rat esophageal fibroblasts (REFs) (presented as mean ± SE). Statistical analysis was performed using Dunnett’s multiple comparison test. Compared with control, aP = 0.001; bP < 0.001; cP = 0.003; dP < 0.001; eP < 0.001; fP = 0.005; gP < 0.001; hP < 0.001; B: Western blot analysis of NLR family pyrin domain containing 3 (NLRP3), proCaspase1, Caspase1, pro-interleukin (IL)-1β, and IL-1β in primary REFs treated as described (presented as mean ± SE). Statistical analysis was performed using Dunnett’s multiple comparison test, with the “lipopolysaccharide (LPS)” group as the control; iP = 0.04; jP < 0.001; kP = 0.03; LP = 0.02; mP = 0.02; nP = 0.03; oP = 0.04; pP = 0.03; C: mRNA levels of NLRP3 and IL-1β in primary REFs treated as described (presented as mean ± SE). Statistical analysis was performed using Dunnett’s multiple comparison test, with the “LPS” group as the control; qP = 0.002; rP < 0.001; sP = 0.03; tP < 0.001; uP = 0.009; vP = 0.009; wP = 0.009; NLRP3: NLR family pyrin domain containing 3; CEL: Celastrol; PRED: Prednisolone; LPS: Lipopolysaccharide.
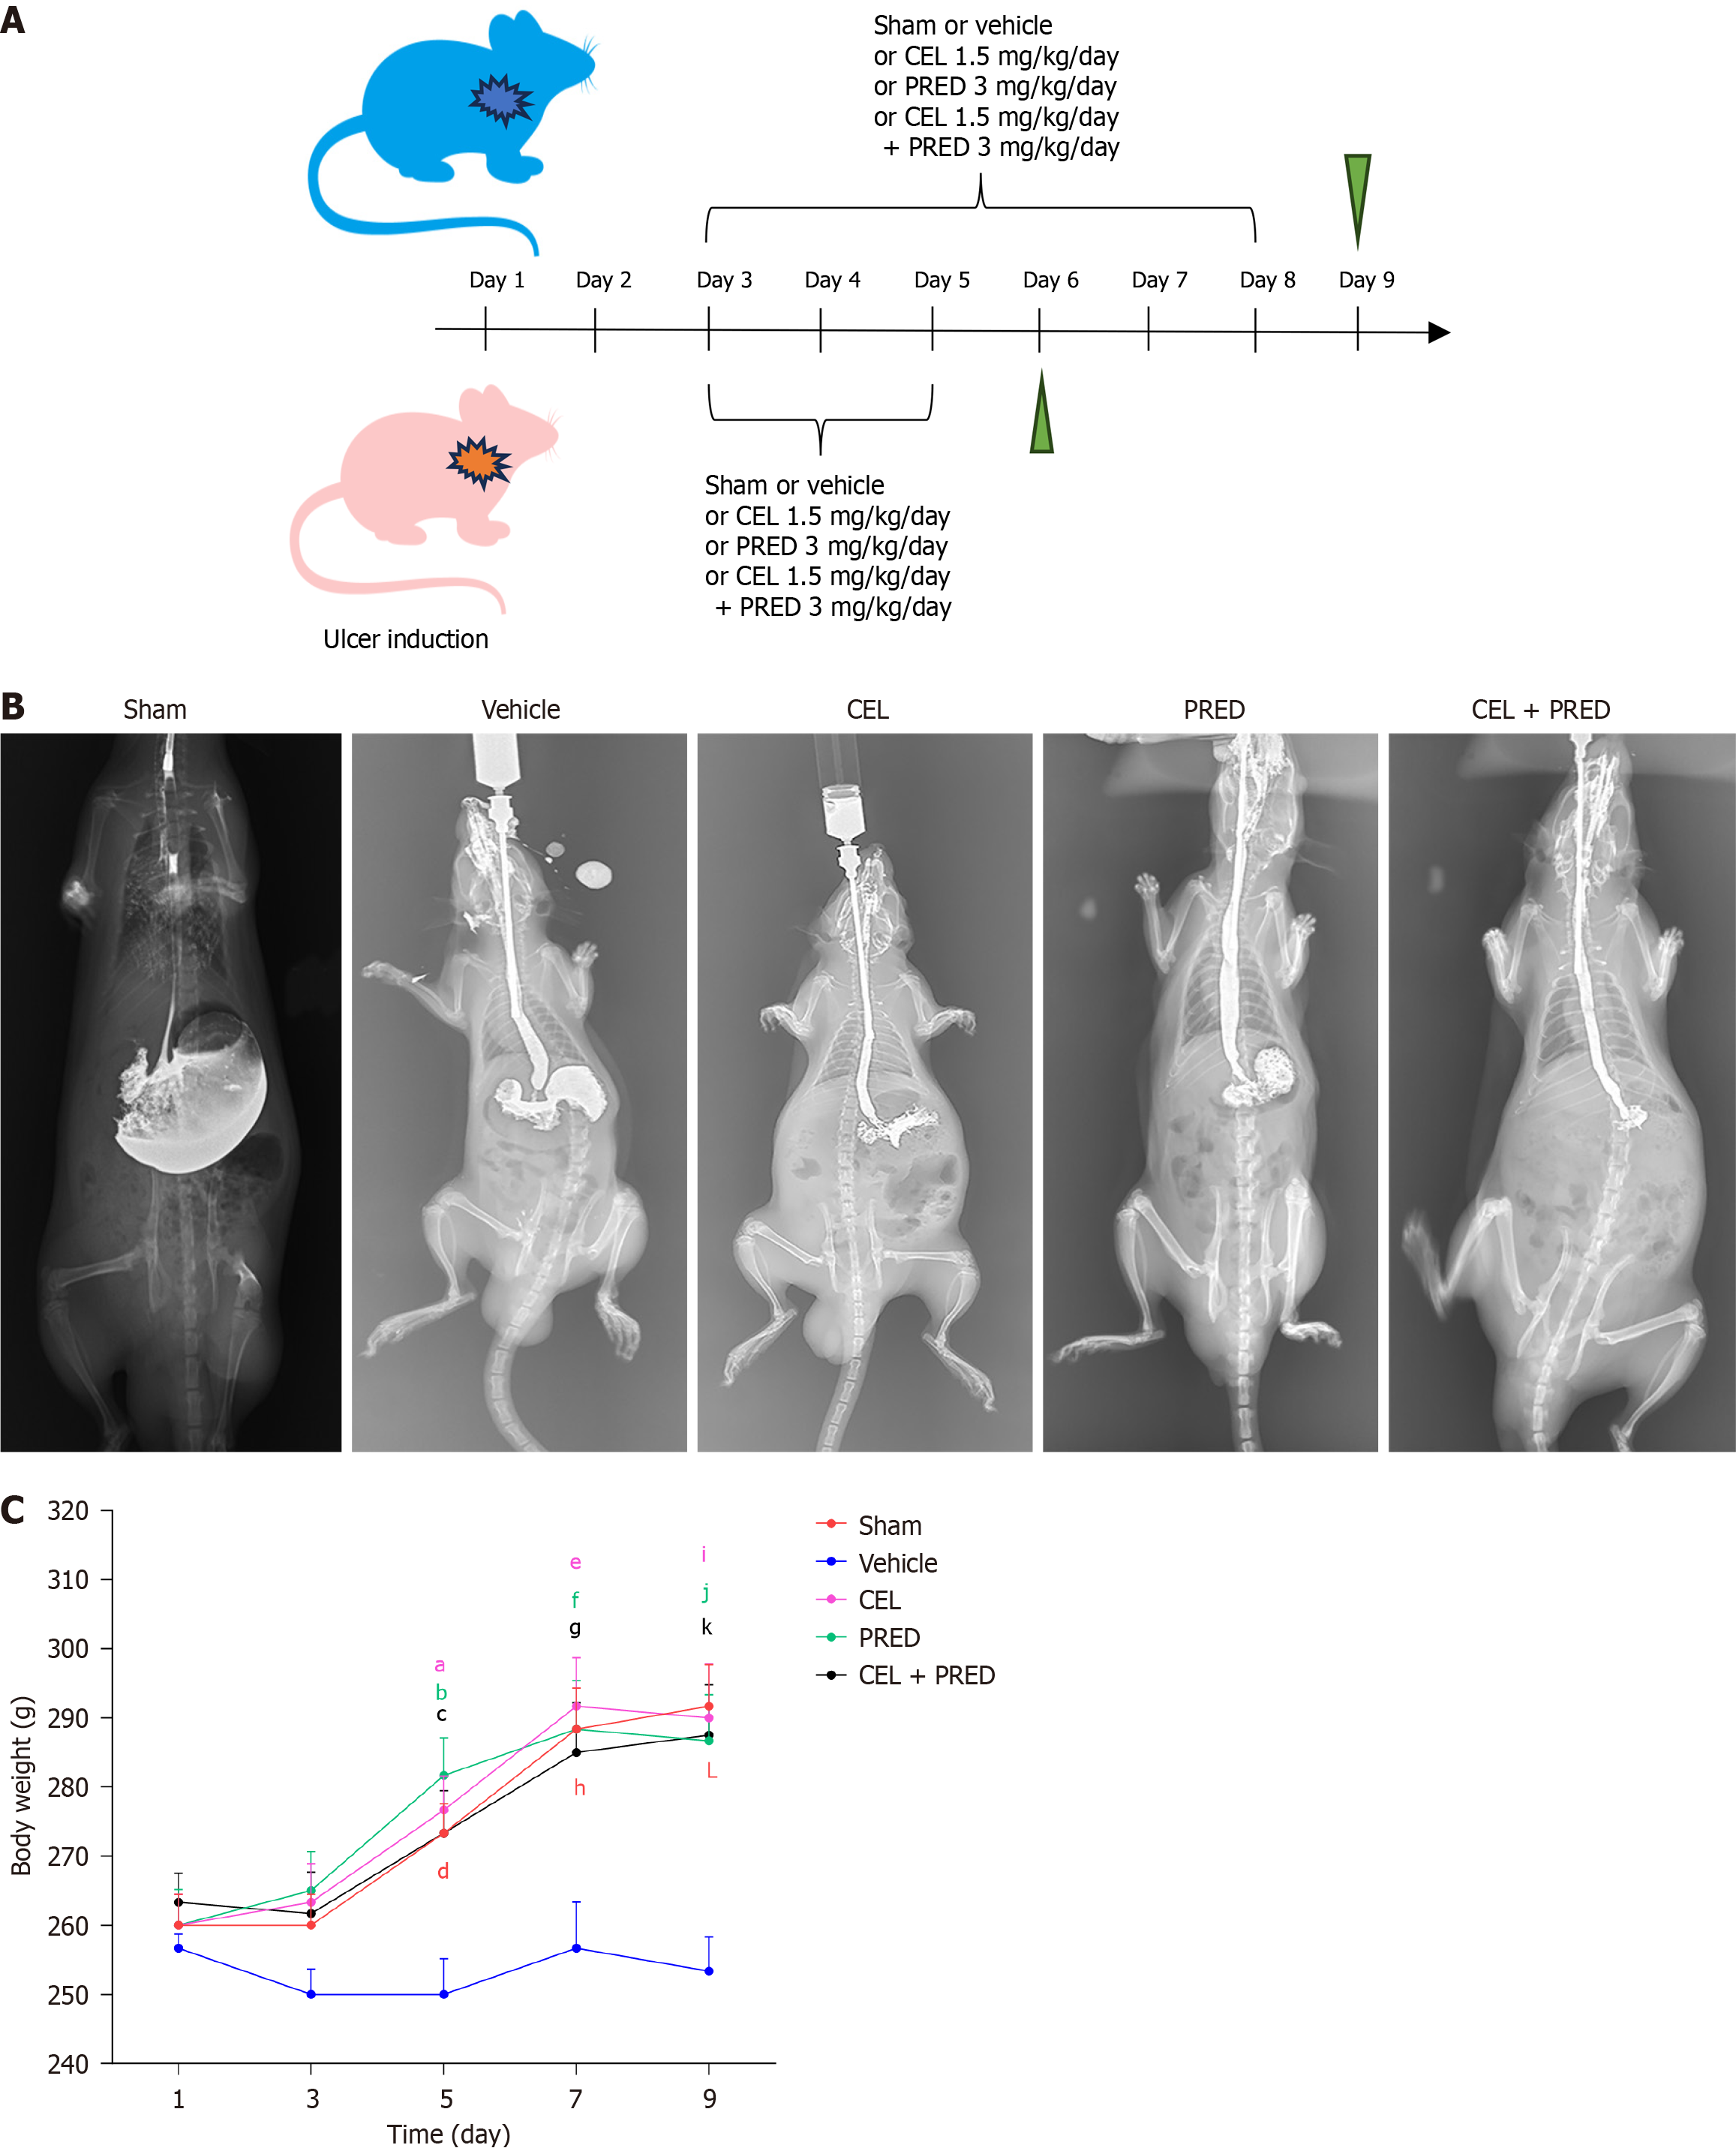
Figure 5 The effect of celastrol in preventing esophageal stricture in vivo.
A: Rats were divided into the following five groups: Sham group, vehicle group, celastrol (CEL) group, prednisolone (PRED) group, and CEL plus PRED group. Inflammation was assessed on day 6, and fibrosis was evaluated on day 9; B: Representative barium esophagography image of esophageal stricture on day 9 in rats; C: Body weight (g) of rats (n = 5 in each group) (presented as mean ± SE). Statistical analysis was performed using Kruskal-Wallis ANOVA test for Day 1 and Day 3 and one-way ANOVA test for Day 5, Day 7, and Day 9, with the “vehicle” group as the control. Only statistically significant comparisons are marked in corresponding colors. aP < 0.001; bP = 0.005; cP = 0.01; dP = 0.01; eP = 0.01; fP = 0.004; gP = 0.02; hP = 0.01; iP = 0.005; jP = 0.002; kP = 0.004; LP = 0.001; NLRP3: NLR family pyrin domain containing 3; CEL: Celastrol; PRED: Prednisolone; LPS: Lipopolysaccharide.
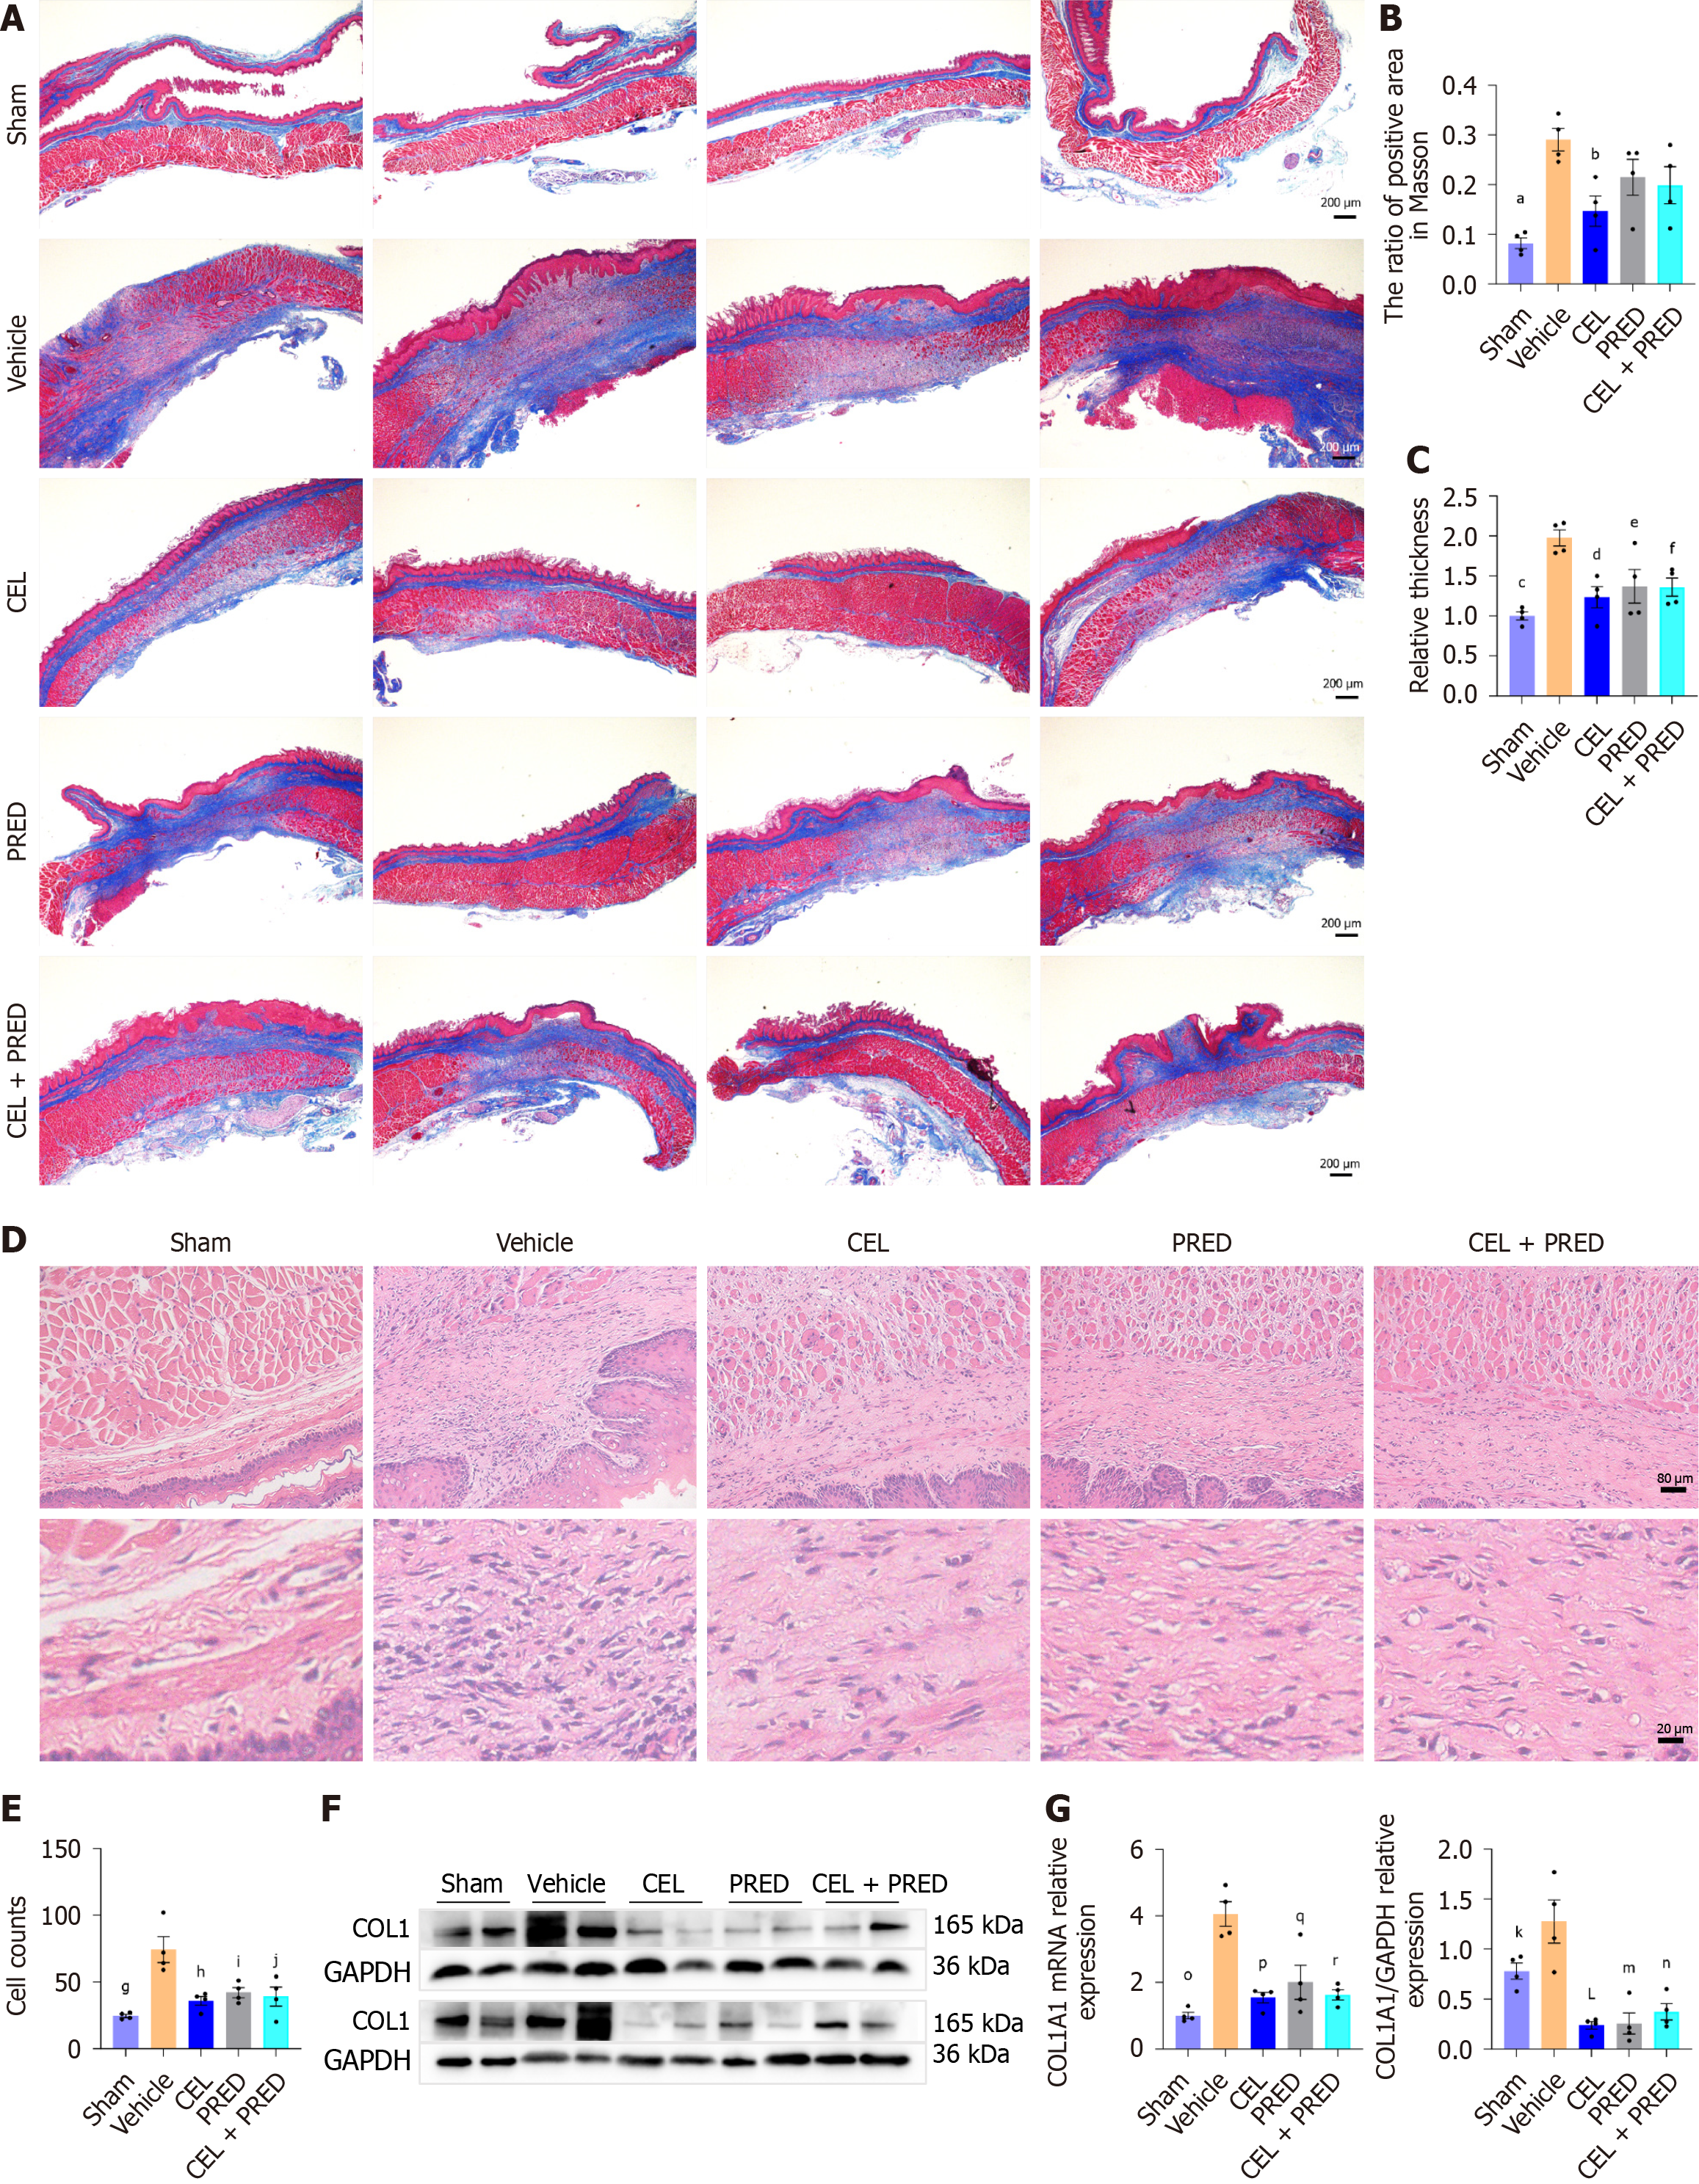
Figure 6 The effect of celastrol in preventing esophageal stricture in vivo.
Data presented as mean ± SE. Statistical analysis was performed using Dunnett’s multiple comparison test, with the “vehicle” group as the control. A: Masson staining image of the esophageal stenosis area. Scale bar = 200 μm; B: Quantitative analysis of Masson staining, aP < 0.001; bP = 0.01; C: Relative thickness of the scar area, cP < 0.001; dP = 0.004, eP = 0.02; fP = 0.02; D: Representative Hematoxylin-eosin (HE) staining image of the esophageal stenosis area in rats on day 9. Scale bar = 80 μm, 20 μm; E: Cell counts in HE staining, gP < 0.001; hP = 0.001; iP = 0.005; jP = 0.002; F: Western blot analysis of Collagen 1 (COL1) in esophageal stenosis tissues on day 9, kP = 0.04; LP < 0.001; mP < 0.001; nP < 0.001; G: mRNA levels of COL1 in esophageal stenosis tissues on day 9, oP < 0.001; pP < 0.001; qP < 0.001; rP < 0.001; NLRP3: NLR family pyrin domain containing 3; CEL: Celastrol; PRED: Prednisolone; LPS: Lipopolysaccharide.
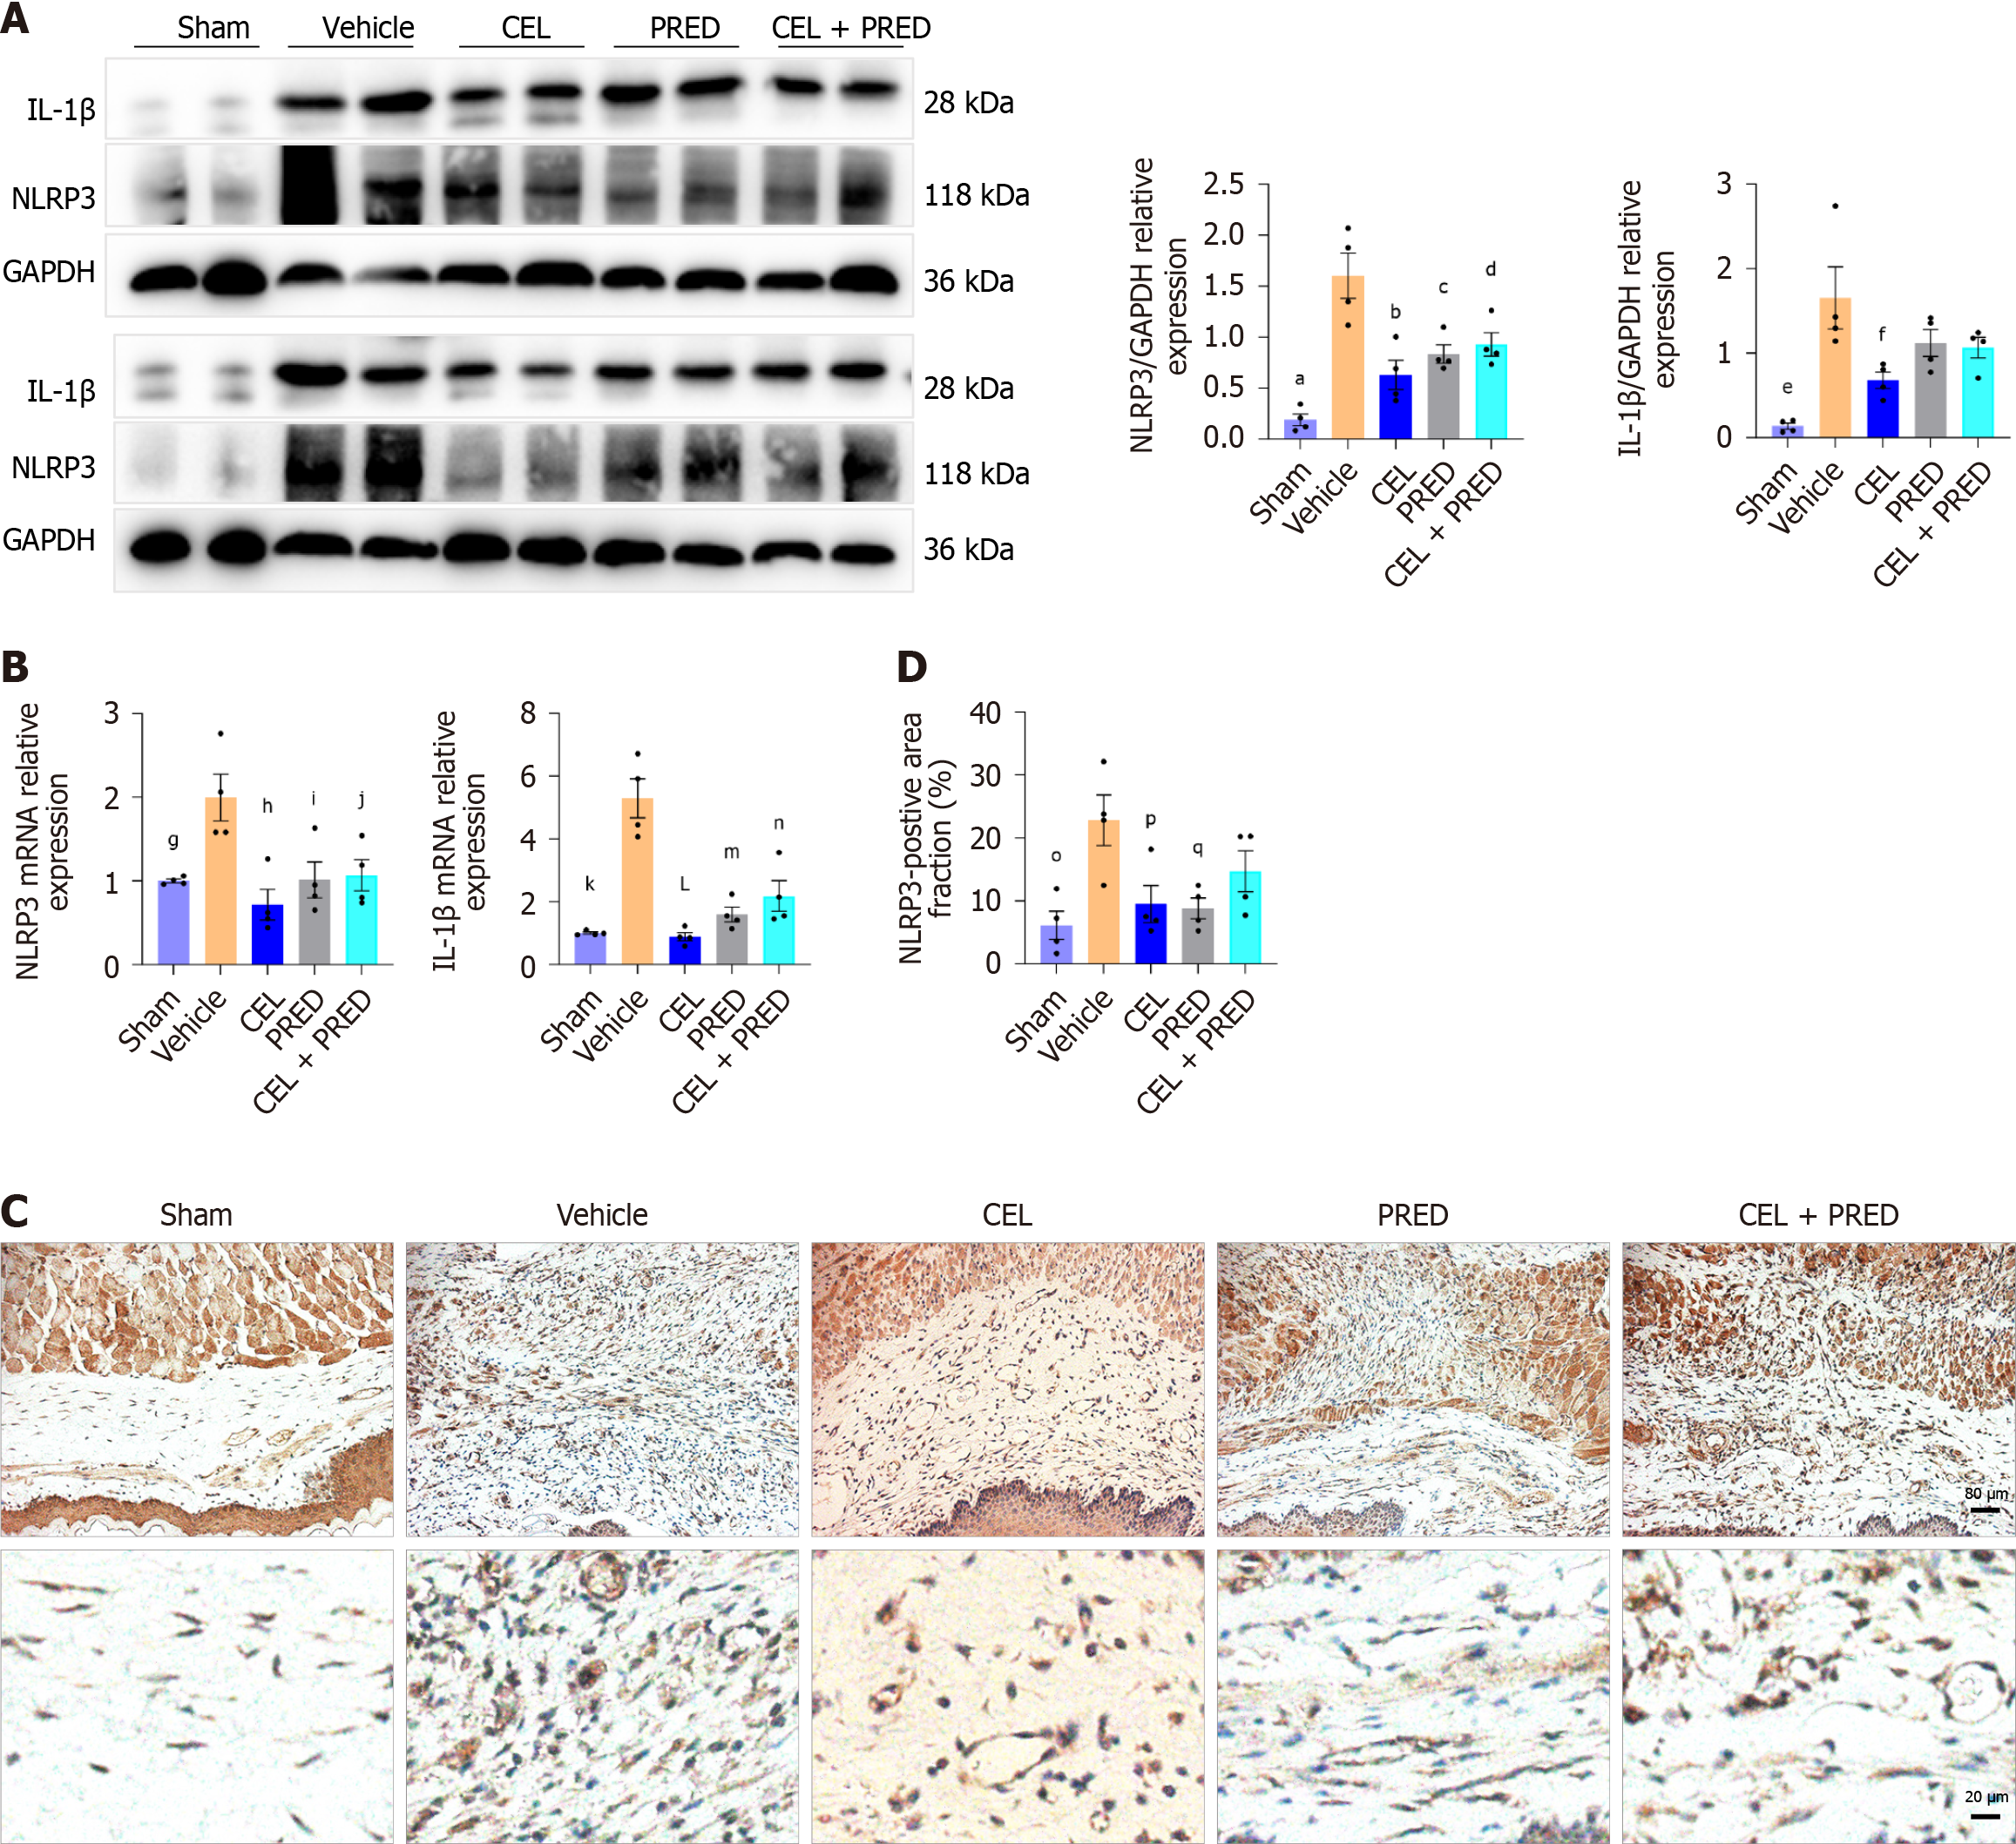
Figure 7 The effect of celastrol on NLR family pyrin domain containing 3 activation in vivo.
Data presented as mean ± SE. Statistical analysis was performed using Dunnett’s multiple comparison test, with the “vehicle” group as the control. A: Western blot analysis of NLR family pyrin domain containing 3 (NLRP3) and interleukin (IL)-1β in the esophageal ulceration area of rat tissues on day 6. aP < 0.001; bP < 0.001; cP = 0.004; dP = 0.01; eP < 0.001; fP = 0.01; B: mRNA levels of NLRP3 and IL-1β in rat esophagus on day 6. gP = 0.009; hP = 0.001; iP = 0.01; jP = 0.02; kP < 0.001; LP < 0.001; mP = 0.002; nP = 0.009; C: Representative immunohistochemistry (IHC) image of NLRP3 in the esophageal ulceration area of rats. Scale bar = 80 μm, 20 μm; D: Quantitative analysis of the NLRP3-positive area (%) for IHC, oP = 0.004; pP = 0.02; qP = 0.01; NLRP3: NLR family pyrin domain containing 3; CEL: Celastrol; PRED: Prednisolone; LPS: Lipopolysaccharide.
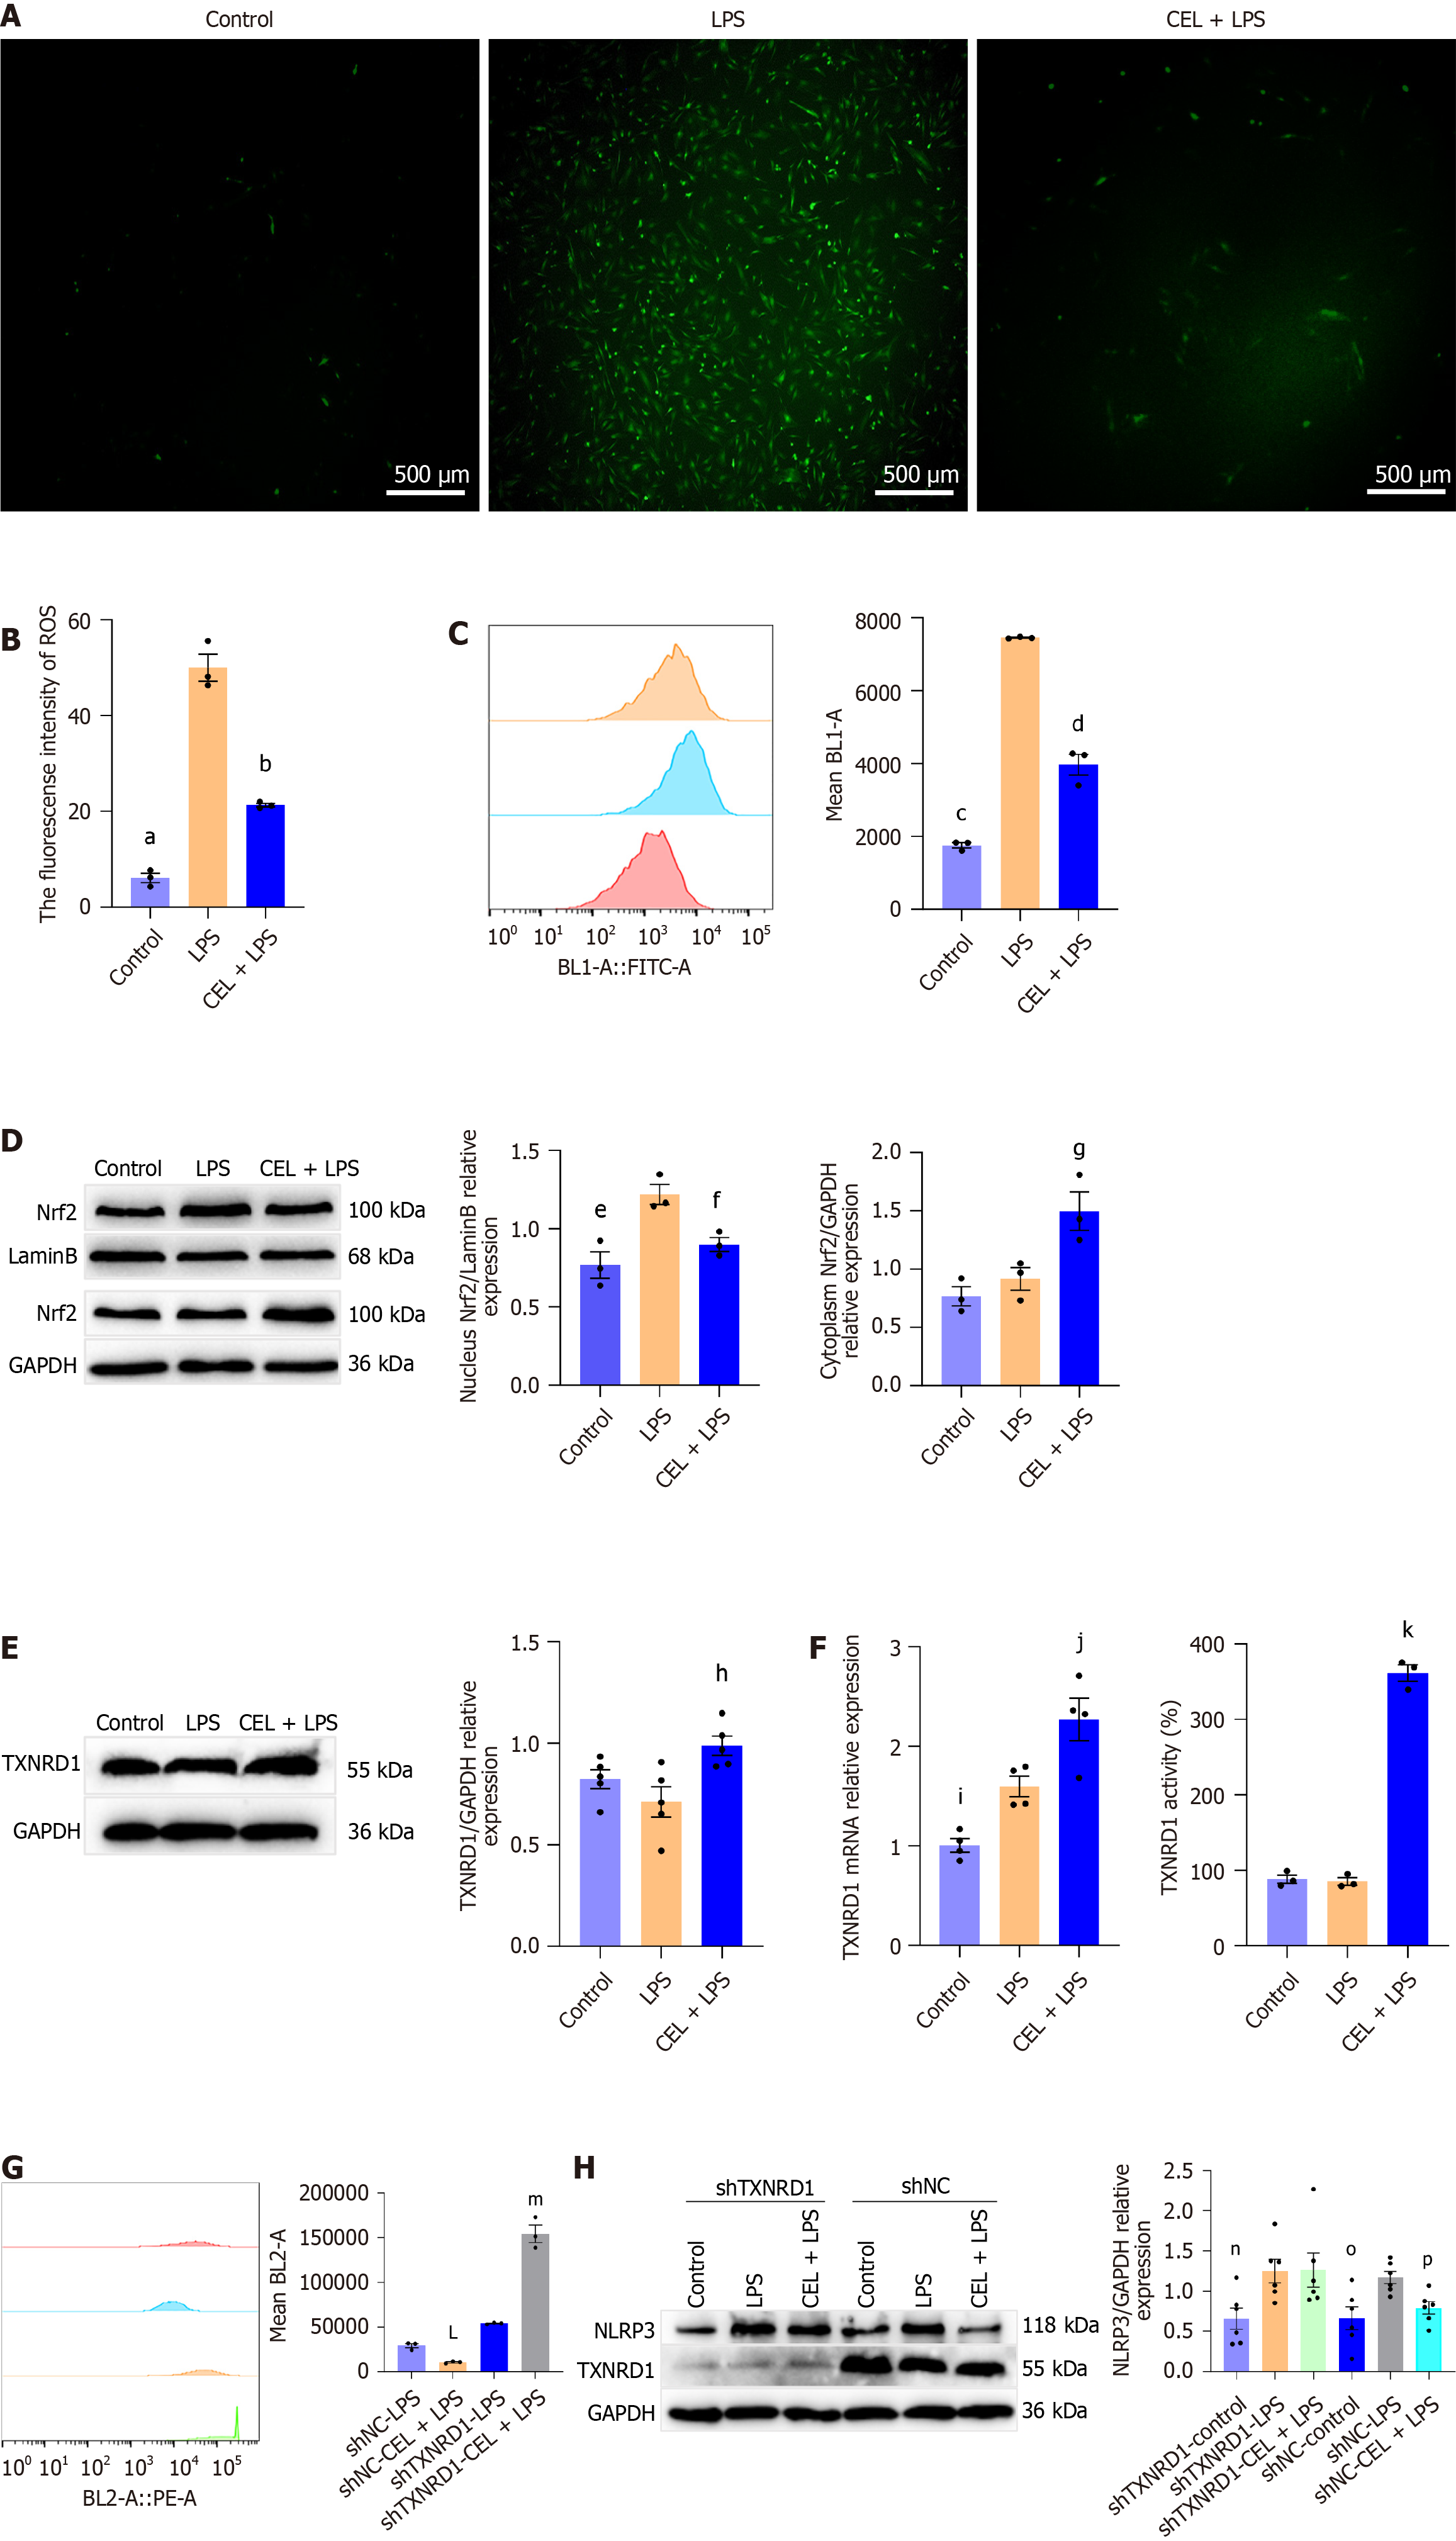
Figure 8 The effect of celastrol on the thioredoxin reductase 1/reactive oxygen species axis.
A: Representative fluorescence image and of intracellular reactive oxygen species (ROS) production detected by DCFH-DA. Scale bar = 500 μm; B: Quantitative analysis of ROS fluorescence intensity (presented as mean ± SE). Statistical analysis was performed using Dunnett’s multiple comparison test, with the “lipopolysaccharide (LPS)” group as the control, aP < 0.001; bP < 0.001; C: Flow cytometry of ROS levels in cells. The mean value of the BL1-A channel represents the ROS production level (presented as mean ± SE). Statistical analysis was performed using Dunnett’s multiple comparison test, with the “LPS” group as the control, cP < 0.001; dP < 0.001; D: Western blot analysis of nuclear factor erythroid 2-related 2 (Nrf2) in the nucleus and cytoplasm indicates nuclear translocation (presented as mean ± SE). Statistical analysis was performed using Dunnett’s multiple comparison test, with the “LPS” group as the control, eP = 0.005; fP = 0.03; fP = 0.03; E and F: mRNA, protein expression levels, and activity of thioredoxin reductase 1 (TXNRD1) (presented as mean ± SE). Statistical analysis was performed using Dunnett’s multiple comparison test, with the “LPS” group as the control, hP = 0.01; iP = 0.03; jP = 0.02; kP < 0.001; G: Flow cytometry of ROS levels in cells transfected with shNC or TXNRD1 shRNA. The mean value of the BL2-A channel represents the ROS production level (presented as mean ± SE). Statistical analysis was performed using the Student’s t test, LP = 0.002 vs shNC-LPS; mP < 0.001 vs shTXNRD1-LPS; H: Western blot analysis of NLR family pyrin domain containing 3 protein expression level in cells with shNC or shRNA of TXNRD1 (presented as mean ± SE). Statistical analysis was performed using Dunnett’s multiple comparison test, with the “shTXNRD1-LPS” or “shNC-LPS” as the control. nP = 0.04 vs shTXNRD1-LPS; oP = 0.007 vs shNC-LPS; pP = 0.04 vs shNC-LPS. NLRP3: NLR family pyrin domain containing 3; CEL: Celastrol; PRED: Prednisolone; LPS: Lipopolysaccharide; TXNRD1: Thioredoxin reductase 1.
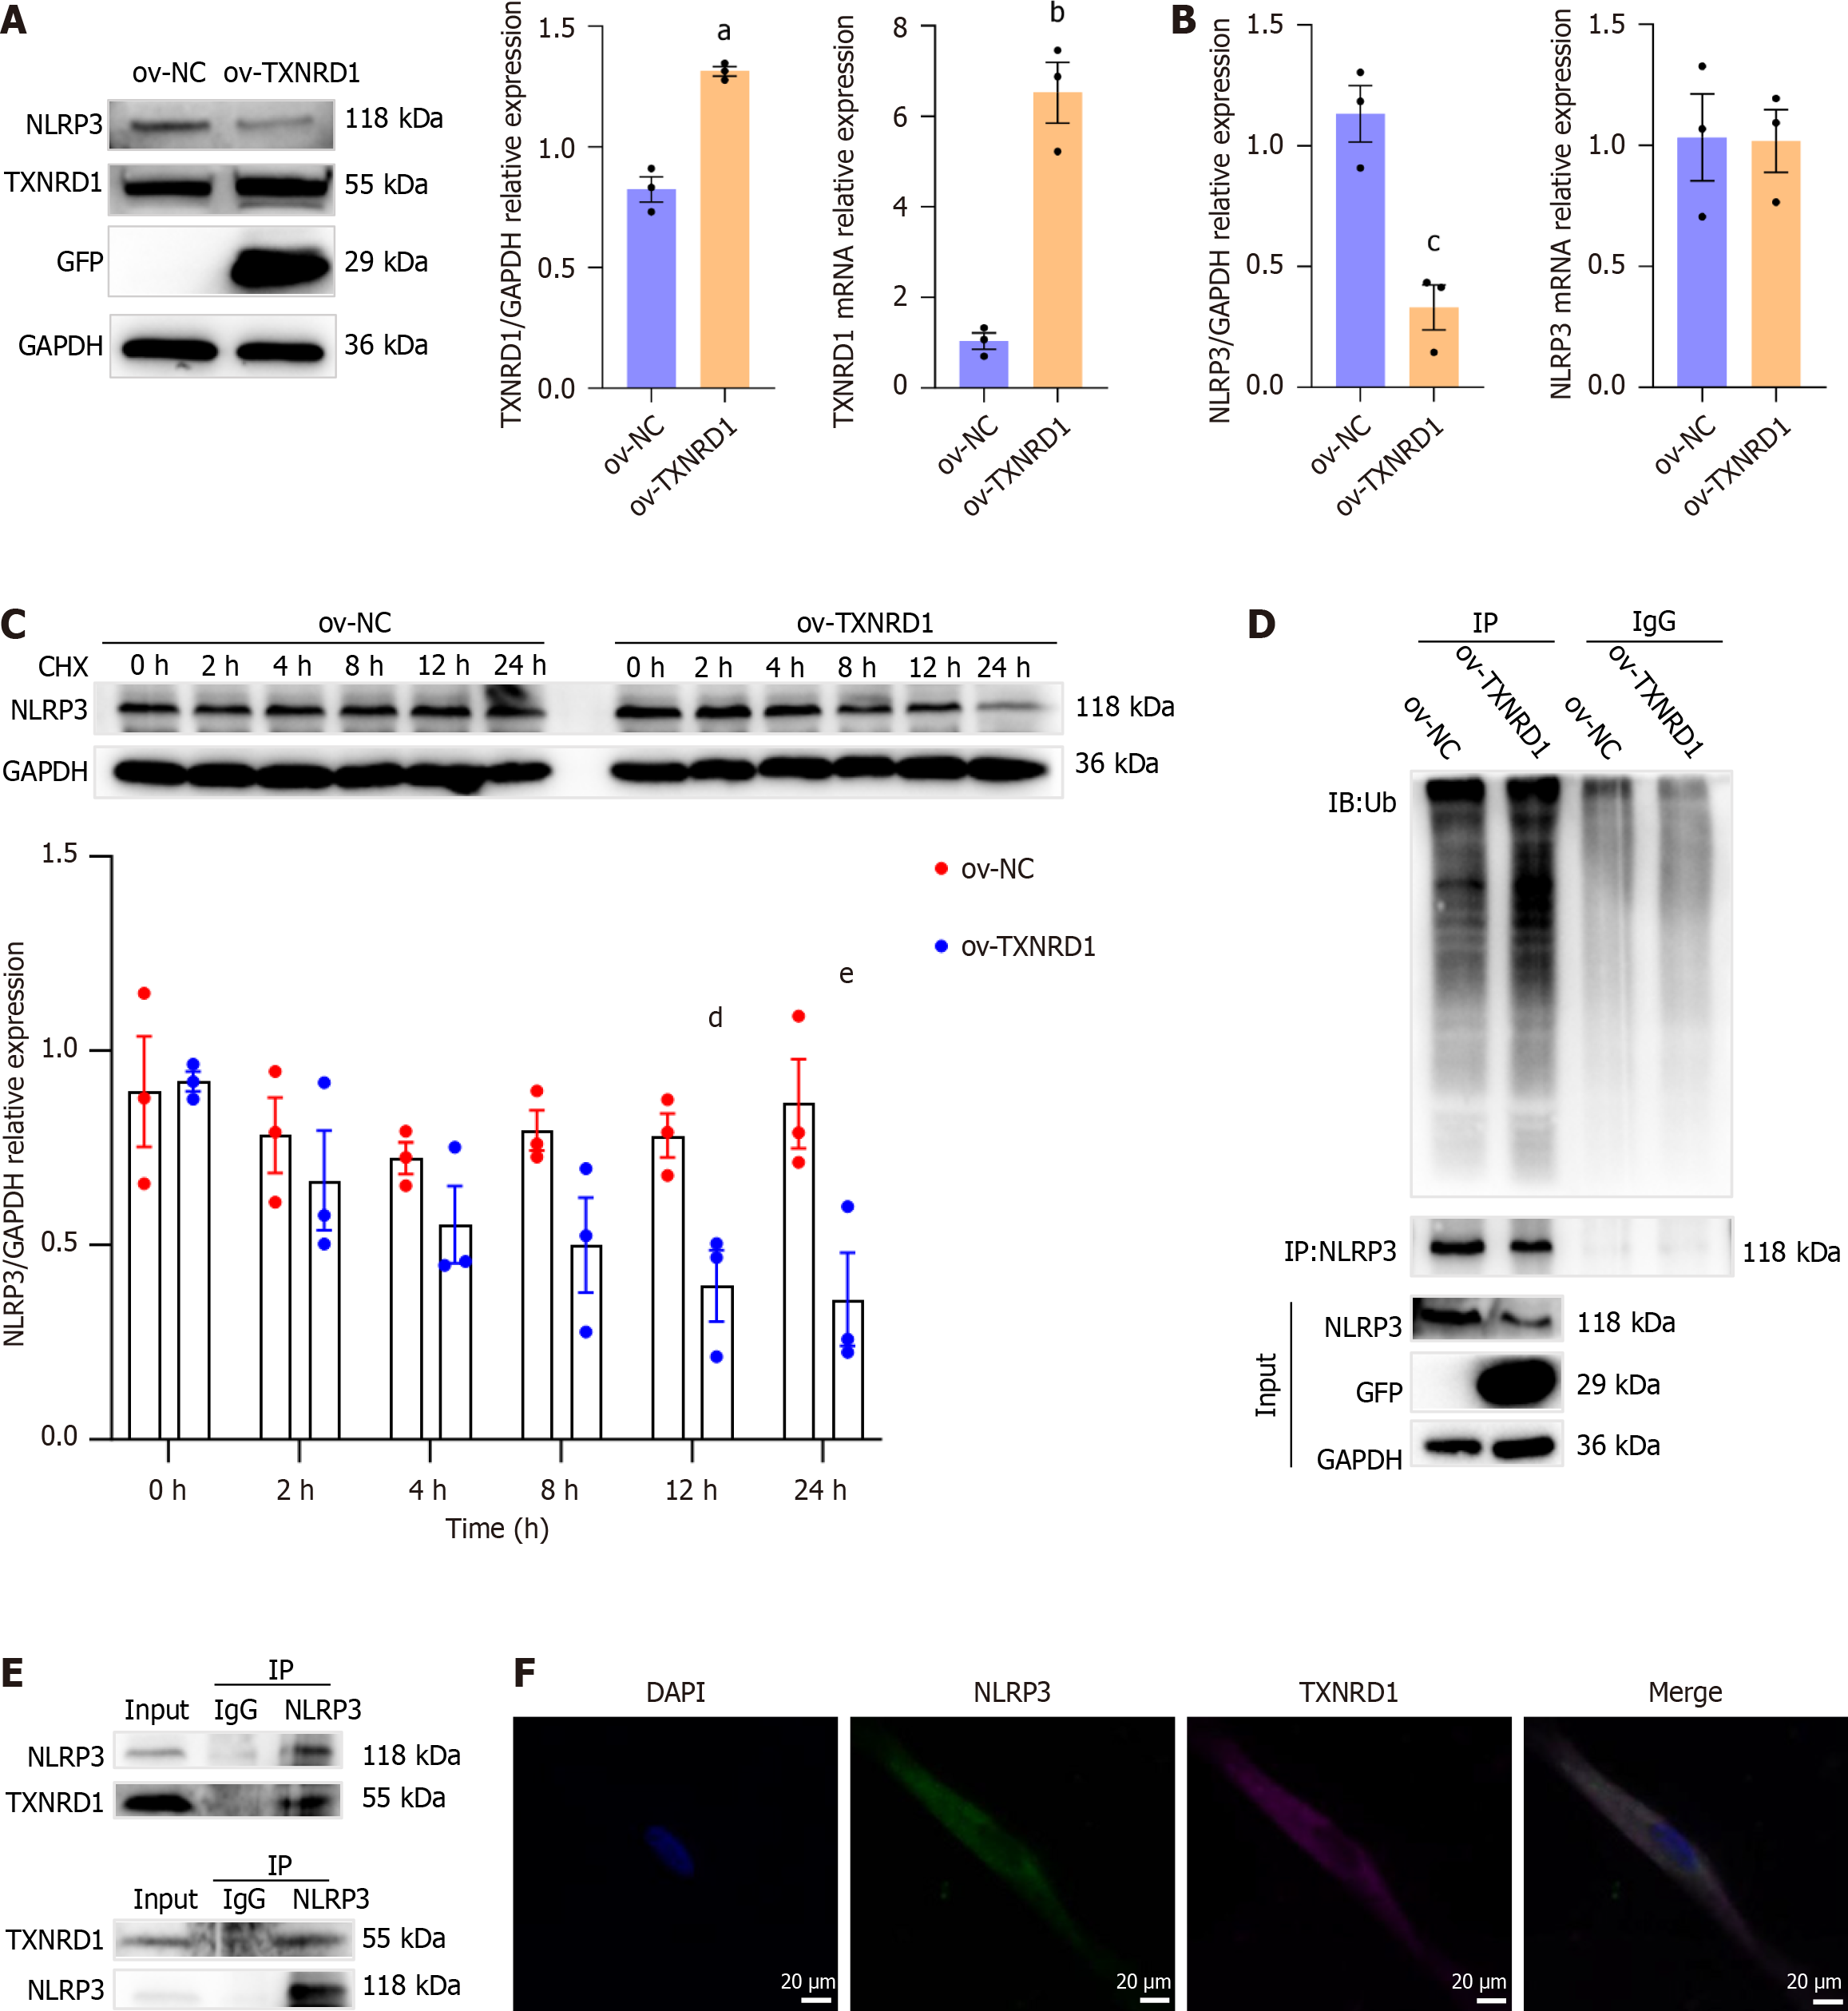
Figure 9 Thioredoxin reductase 1 and NLR family pyrin domain containing 3 interaction in primary rat esophageal fibroblasts.
Data presented as mean ± SE). Statistical analysis was performed using the Student’s t test. A: Western blot analysis of thioredoxin reductase 1 (TXNRD1) and NLR family pyrin domain containing 3 (NLRP3) in the control and TXNRD1-overexpression cells, aP < 0.001; bP = 0.001; B: mRNA and protein levels of NLRP3 in the control and TXNRD1-overexpression groups, cP = 0.006; C: Western blot analysis of NLRP3 in the control and TXNRD1-overexpression groups after incubation with CHX (10 μM) for 0, 2, 4, 8, 12 and 24 hours, dP = 0.02; eP = 0.02; D: Protein levels of NLRP3 ubiquitination in primary rat esophageal fibroblasts (REFs) from the control and TXNRD1-overexpression groups following MG132 (5 μM) treatment for 6 hours (n = 3 in each group); E: Reciprocal co-immunoprecipitation assays showing the TXNRD1-NLRP3 interaction with endogenous proteins in primary REFs (n = 3 in each group); F: Colocalization of TXNRD1 and NLRP3 observed under a fluorescence microscope. Scale bar = 20 μm. NLRP3: NLR family pyrin domain containing 3; CEL: Celastrol; PRED: Prednisolone; LPS: Lipopolysaccharide; TXNRD1: Thioredoxin reductase 1; NC: Negative control.
- Citation: Zhang MX, Wu C, Feng XX, Tian W, Zhao NH, Lu PP, Ding Q, Liu M. Celastrol alleviates esophageal stricture in rats by inhibiting NLR family pyrin domain containing 3 activation. World J Gastroenterol 2025; 31(23): 106949
- URL: https://www.wjgnet.com/1007-9327/full/v31/i23/106949.htm
- DOI: https://dx.doi.org/10.3748/wjg.v31.i23.106949


