Copyright
©The Author(s) 2025.
World J Gastroenterol. May 28, 2025; 31(20): 104891
Published online May 28, 2025. doi: 10.3748/wjg.v31.i20.104891
Published online May 28, 2025. doi: 10.3748/wjg.v31.i20.104891
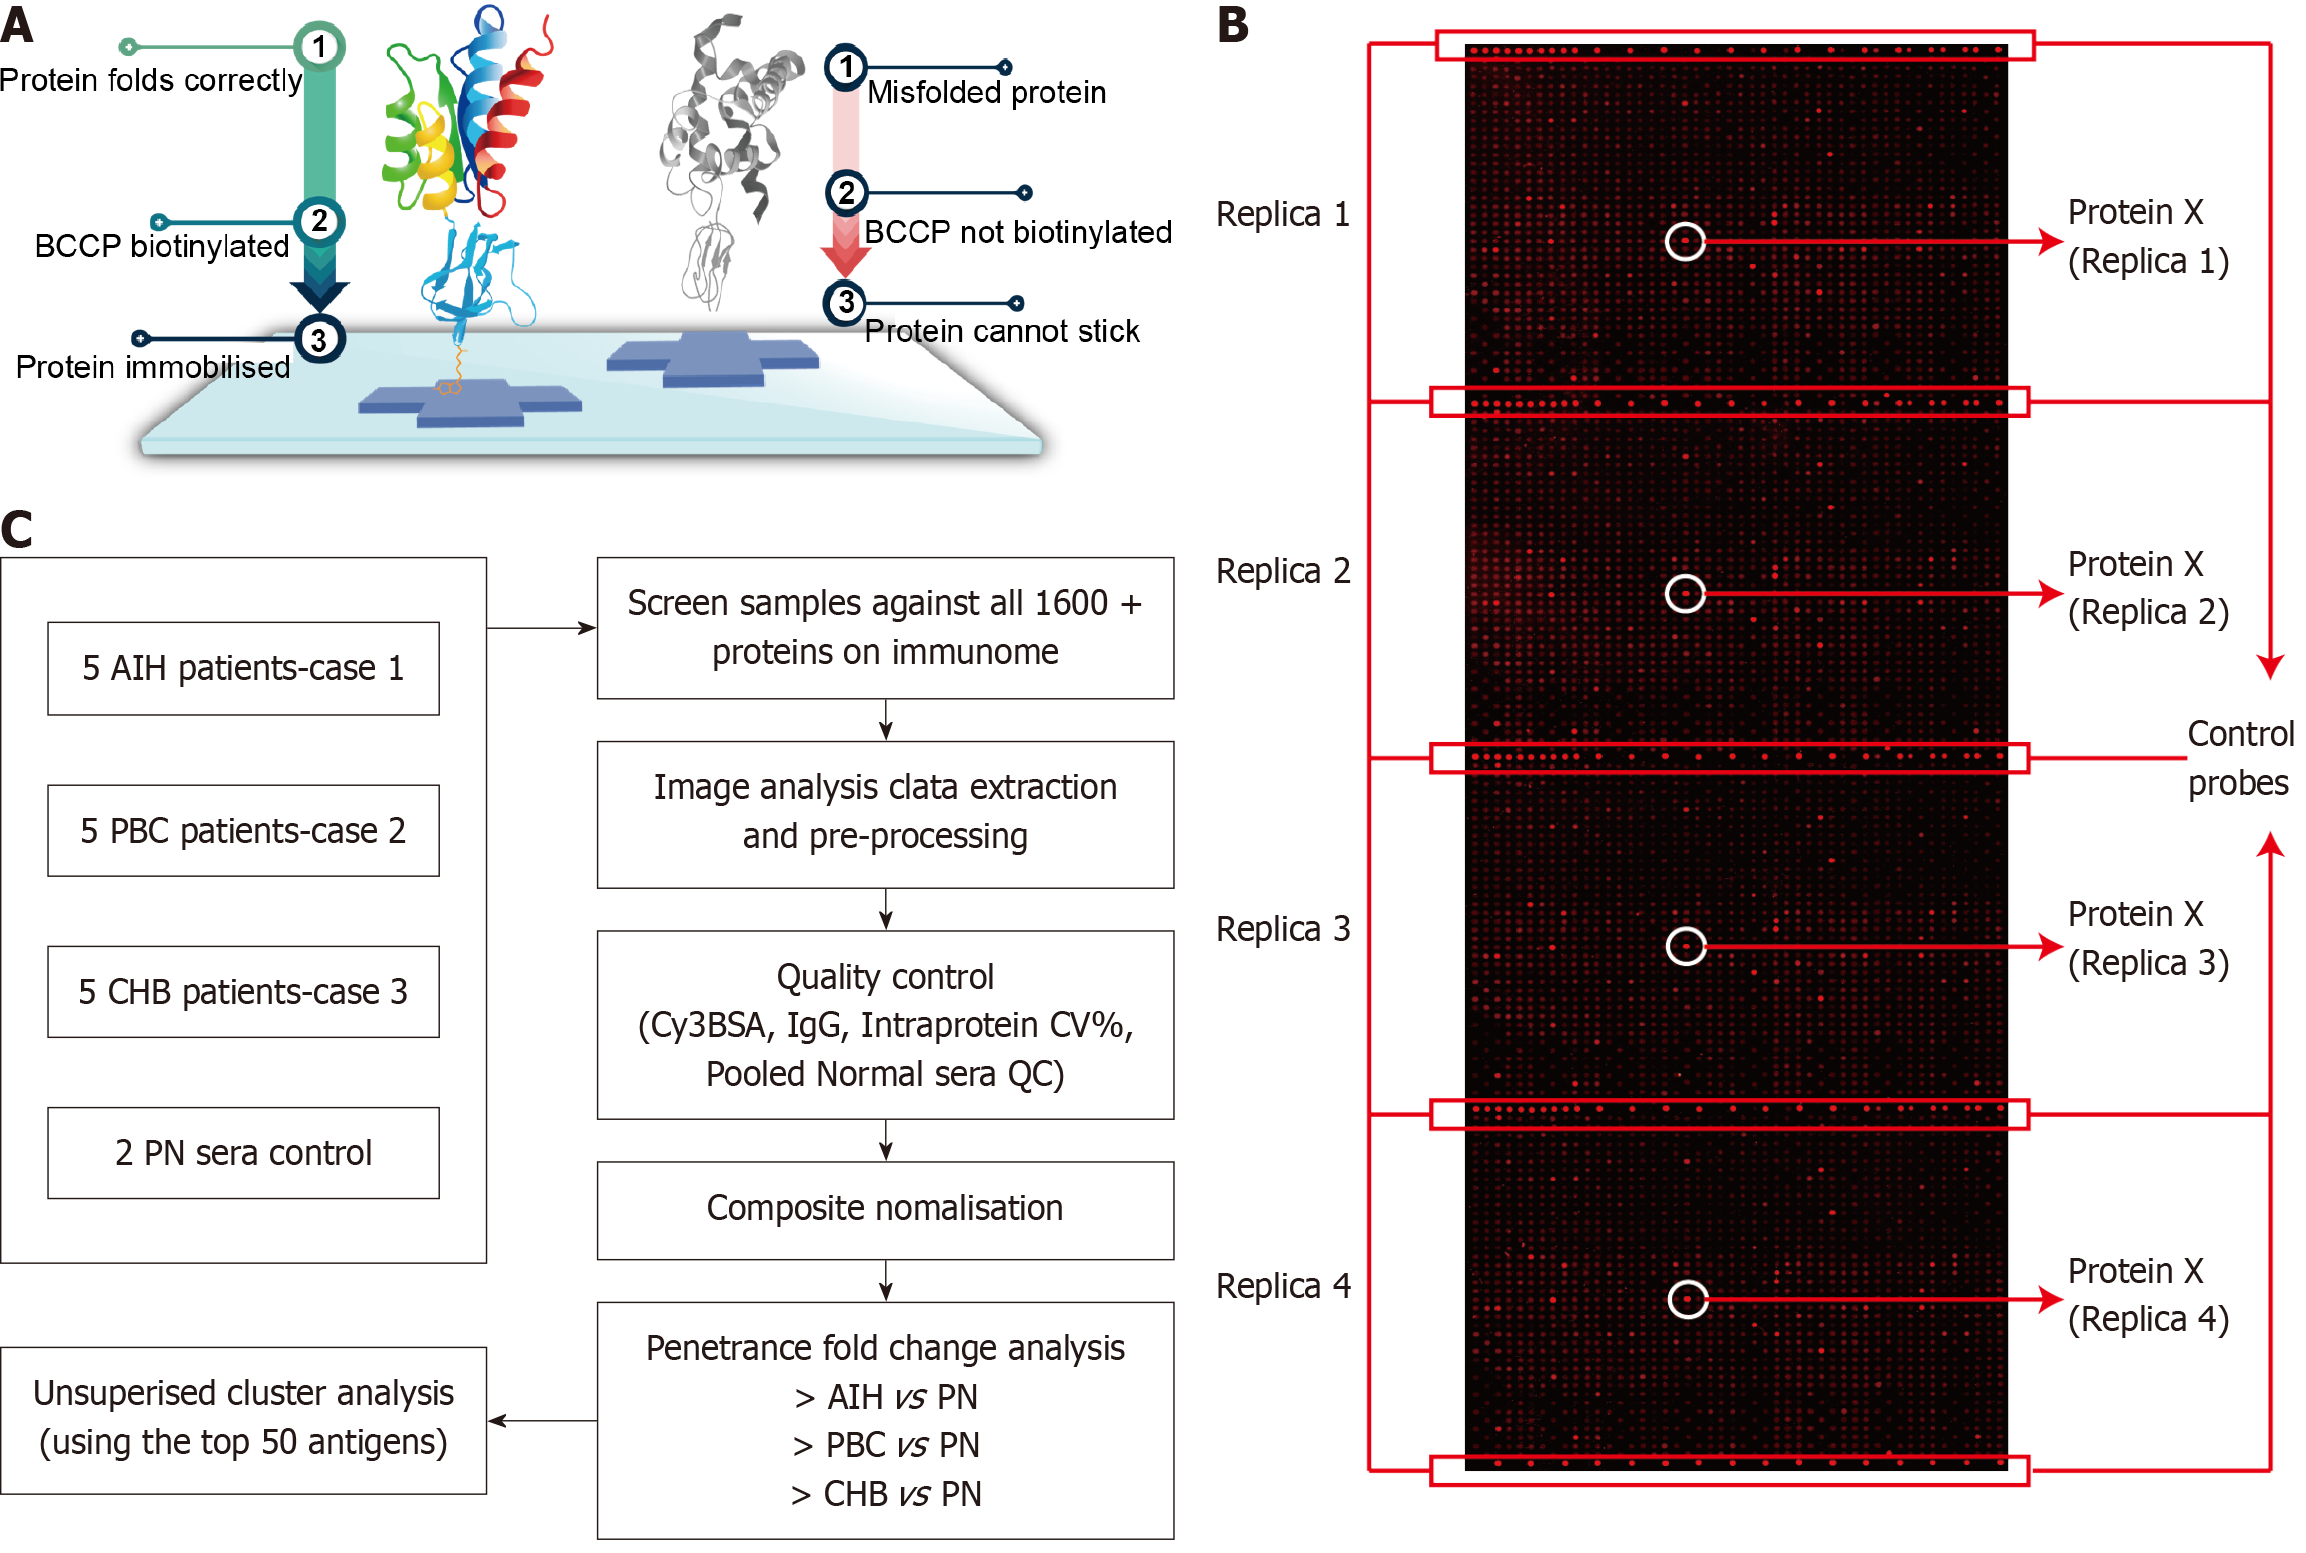
Figure 1 Overview of the IMMUNOME™ Protein Array workflow used for autoantigen discovery.
A: Schematic representation of the biotin carboxyl carrier protein fusion system. The biotin carboxyl carrier protein tag facilitates proper protein folding and surface presentation, thereby preserving the native conformation of the expressed proteins; B: Representative layout of the Sengenics IMMUNOME™ slide. The array contains more than 1600 human proteins spotted in quadruplicate. Positive control probes include Cy3-labeled bovine serum albumin, spotted in replicates of 4 or 5, and human IgG; C: Workflow diagram for protein array data analysis. Antigen signals were ranked according to penetrance frequency (%) and penetrance fold change (primary biliary cholangitis/autoimmune hepatitis/chronic hepatitis B vs pooled normal controls). The top 50 autoantigens were identified using unsupervised cluster analysis based on these parameters. BCCP: Biotin carboxyl carrier protein; Cy3BSA: Cy3-labeled bovine serum albumin; CV: Coefficient of variation; QC: Quality control; PBC: Primary biliary cholangitis; AIH: Autoimmune hepatitis; CHB: Chronic hepatitis B; PN: Pooled normal controls.
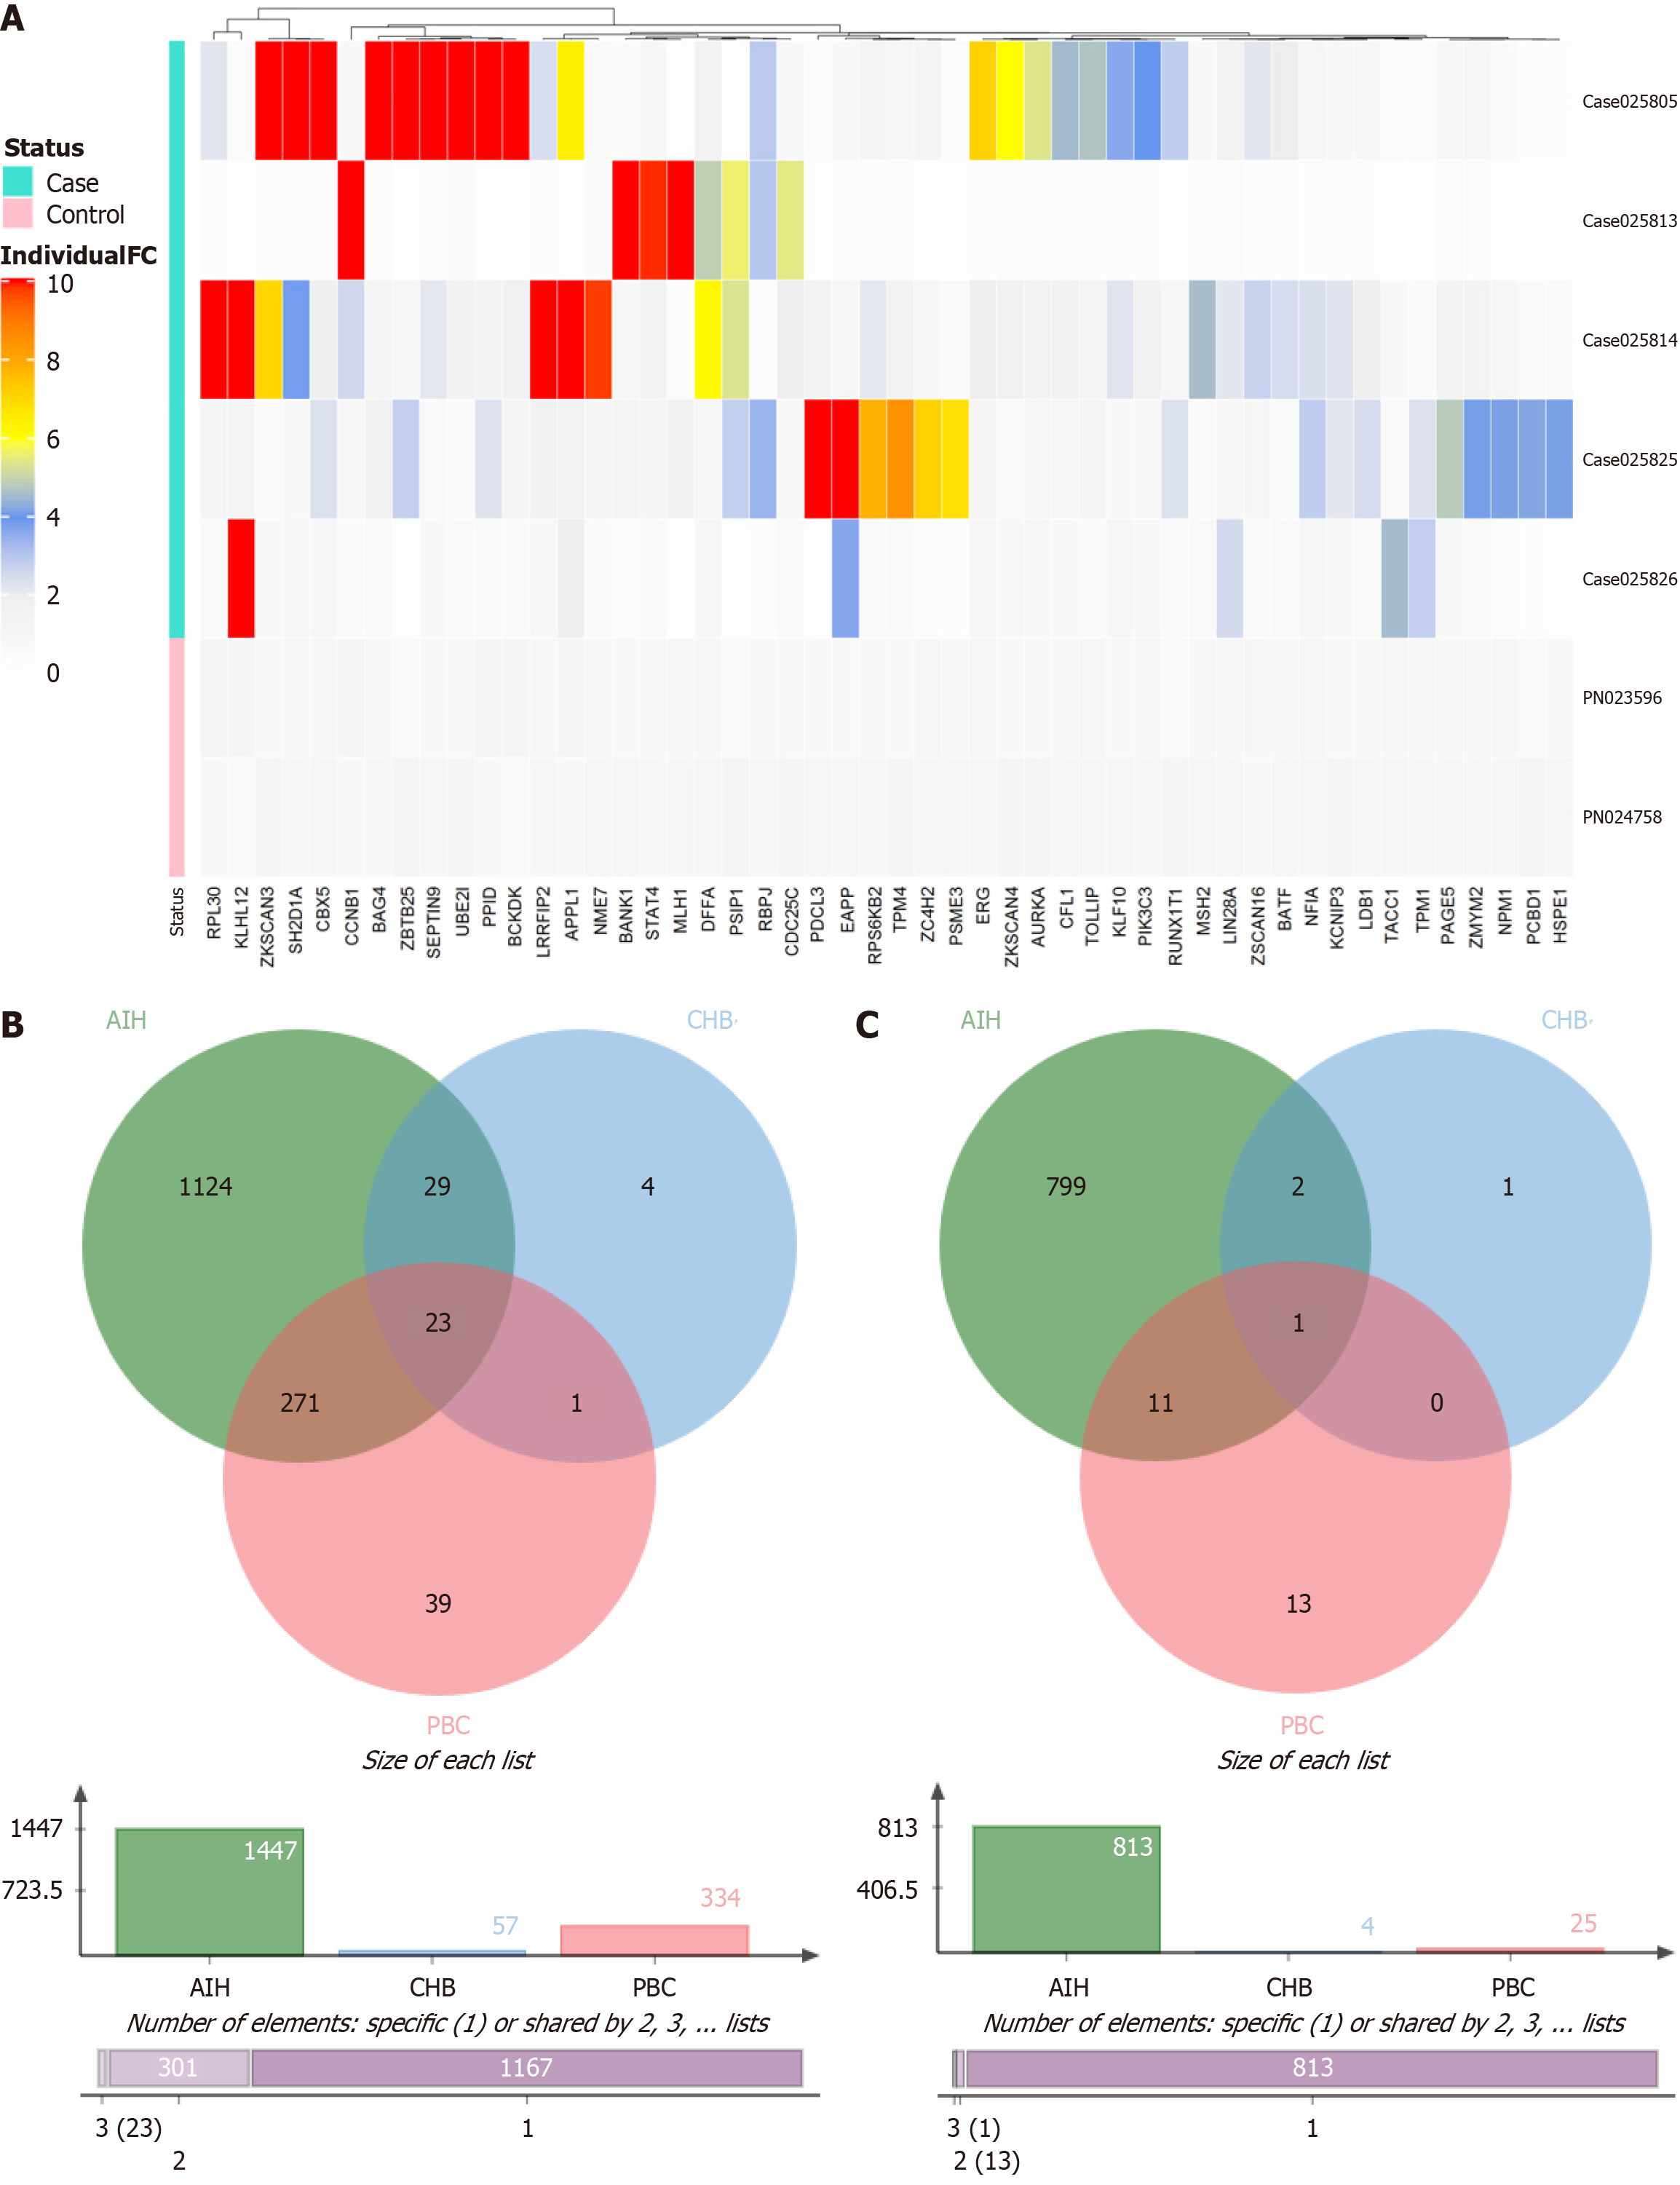
Figure 2 Results of the IMMUNOME™ protein array analysis.
A: Heatmap illustrating the top 50 autoantigens with the most significant differential reactivity between patients with primary biliary cholangitis and pooled normal controls. Antigen selection was based on penetrance fold change analysis; B: Venn diagram showing the overlap of autoantigens with a penetrance frequency of ≥ 20% among the primary biliary cholangitis, autoimmune hepatitis, and chronic hepatitis B groups; C: Venn diagram displaying shared autoantigens with a penetrance frequency of ≥ 30% across the same three disease cohorts. PBC: Primary biliary cholangitis; AIH: Autoimmune hepatitis; CHB: Chronic hepatitis B.
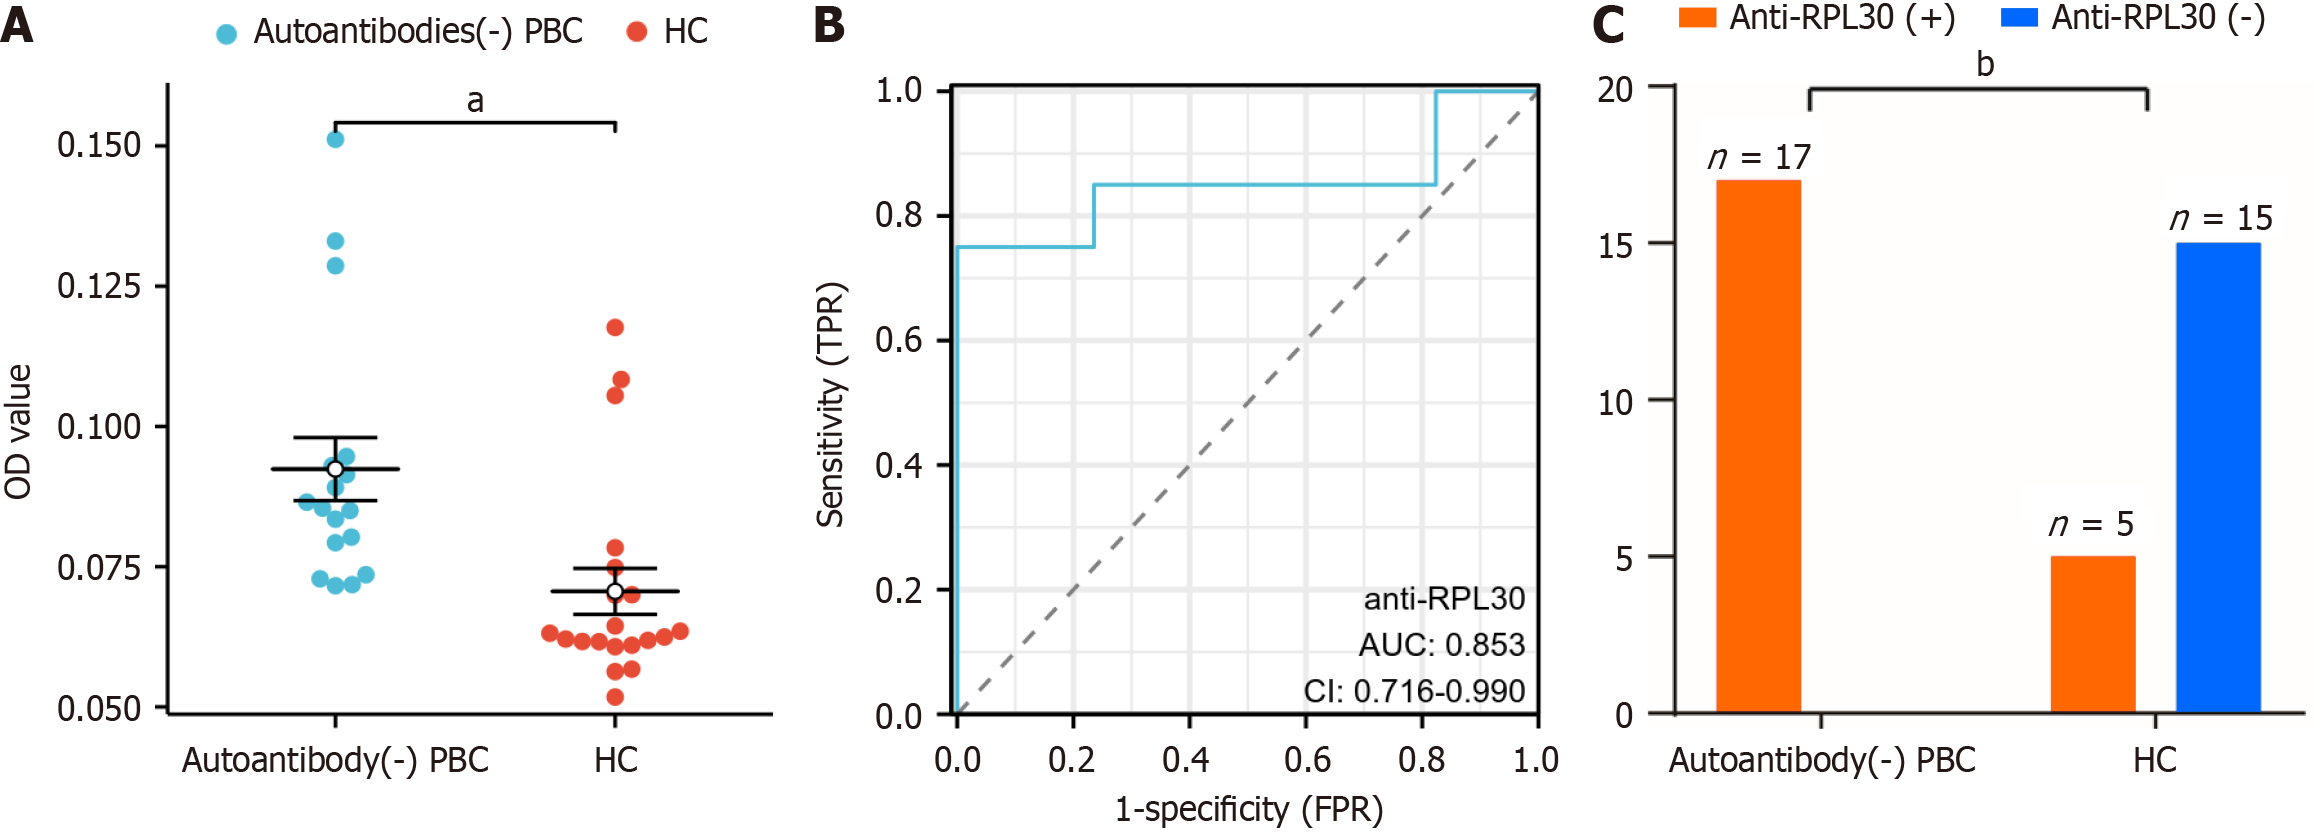
Figure 3 ELISA of the autoantibody RPL30 in autoantibody-negative primary biliary cholangitis and healthy control.
A: Scatter plot diagram of the optical density value level with the RPL30 antibody in the antibody-negative primary biliary cholangitis group and health control group; B: Analysis of receiver operating characteristic with a cutoff value = 0.0708, sensitivity = 75%, and specificity = 100%; C: Histogram of RPL30 antibody-positive patients in the antibody-negative primary biliary cholangitis (anti-mitochondrial antibody, anti-mitochondrial E2 subunit antibody, anti-glycoprotein 210, anti-speckled protein 100) and the control groups. aP < 0.001, bP < 0.0001. PBC: Primary biliary cholangitis; HC: Healthy control group; OD: Optical density; AUC: Area under the receiver operating characteristic curve; TPR: True positive rate; FPR: False positive rate; CI: Confidence interval.
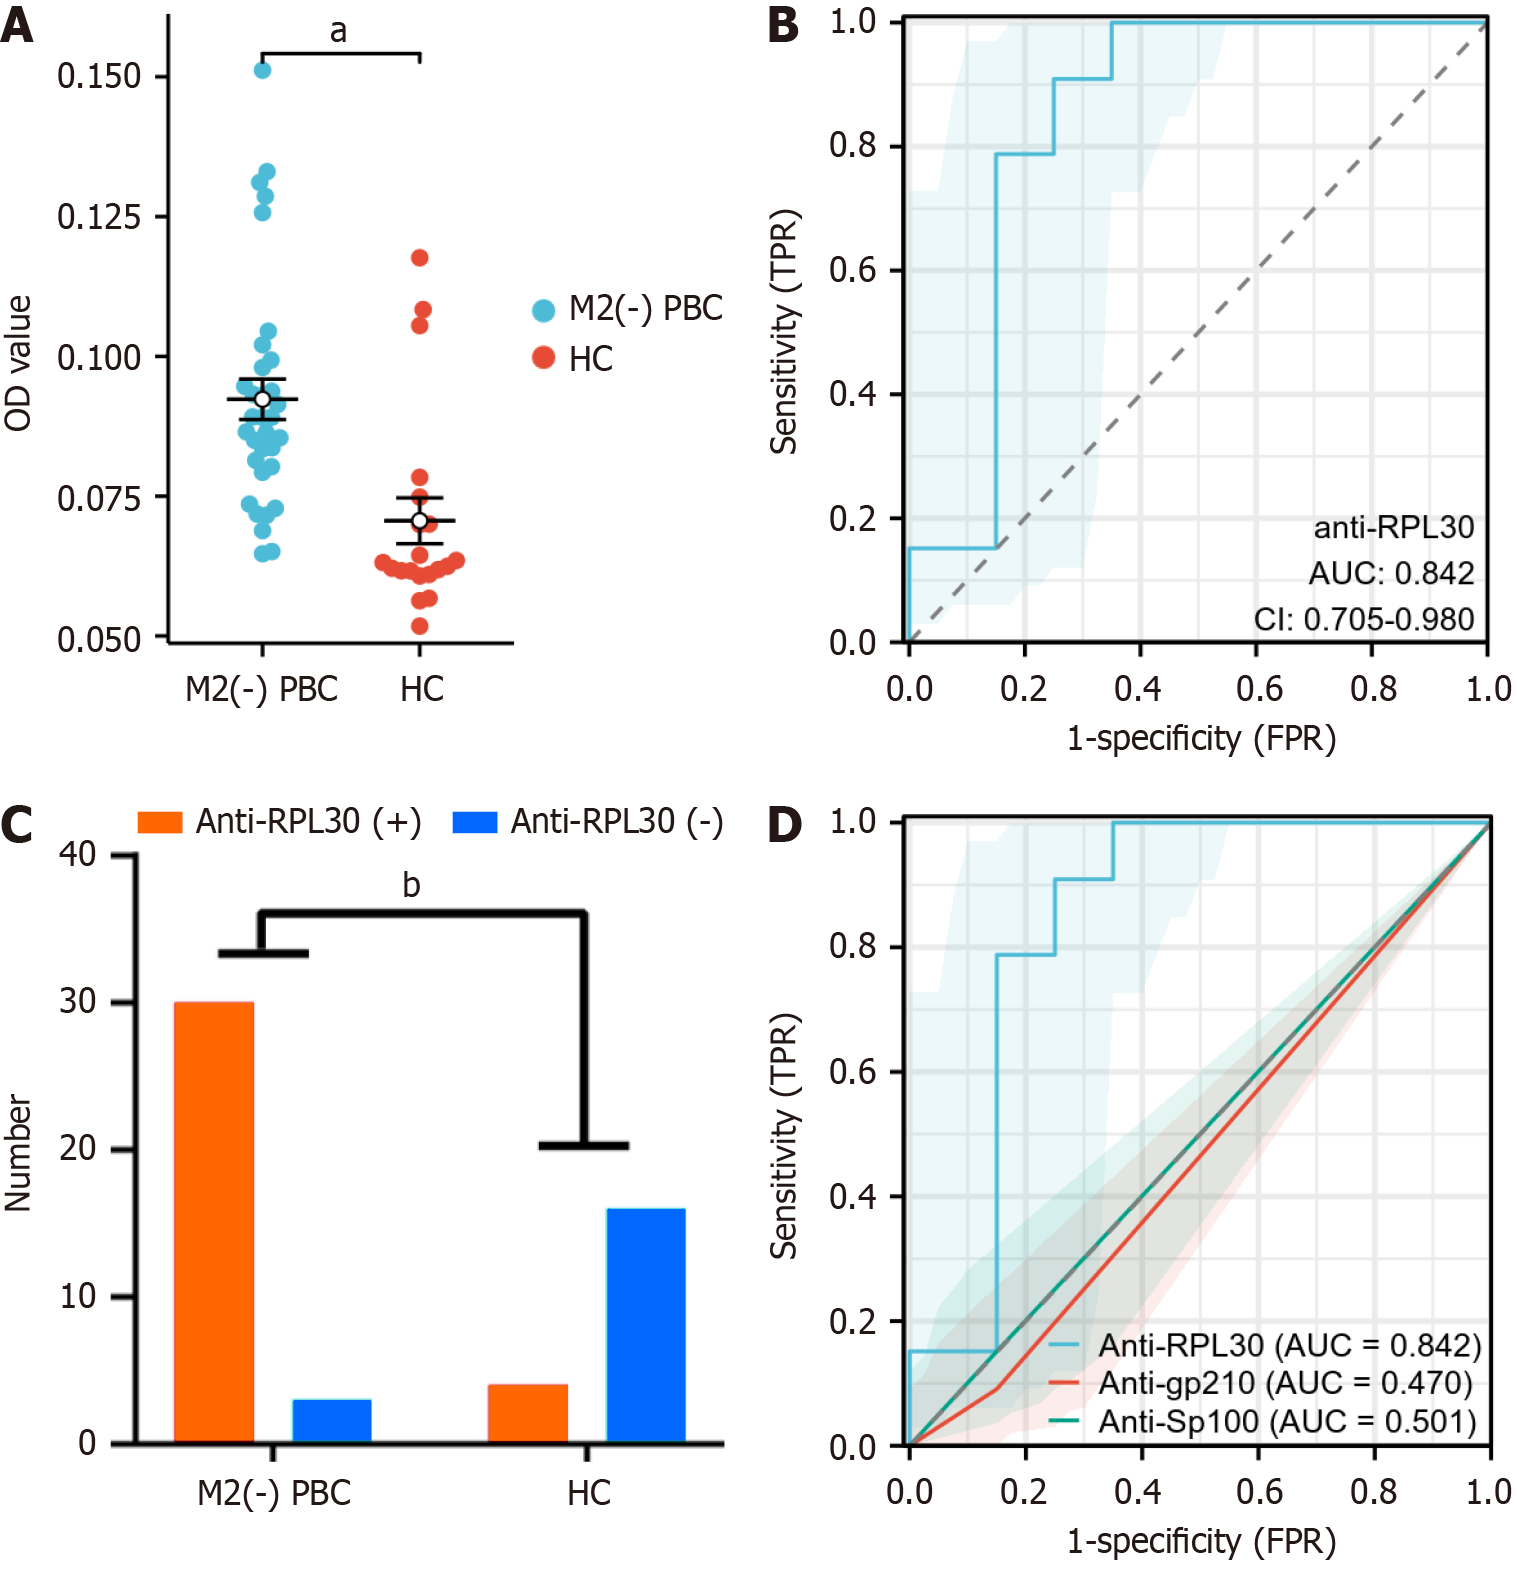
Figure 4 ELISA of the autoantibody RPL30 in anti-mitochondrial antibody M2-negative primary biliary cholangitis and healthy control.
A: Scatter plot diagram of the optical density value level with the RPL30 antibody in the anti-mitochondrial E2 subunit antibody-negative primary biliary cholangitis group and the healthy control group; B: Analysis of receiver operating characteristic with cutoff value = 0.0708, sensitivity = 90.9%, and specificity = 75%; C: Histogram of RPL30 antibody-positive patients in the anti-mitochondrial E2 subunit antibody-negative primary biliary cholangitis and control groups; D: Analysis of optical density between anti-RPL30, anti-glycoprotein 210, and anti-speckled protein 100 for diagnosis of primary biliary cholangitis. aP < 0.001, bP < 0.0001. PBC: Primary biliary cholangitis; HC: Healthy control group; OD: Optical density; AUC: Area under the receiver operating characteristic curve; TPR: True positive rate; FPR: False positive rate; M2: Anti-mitochondrial E2 subunit antibody; CI: Confidence interval; Anti-gp210: Anti-glycoprotein 210; Anti-Sp100: Anti-speckled protein 100.
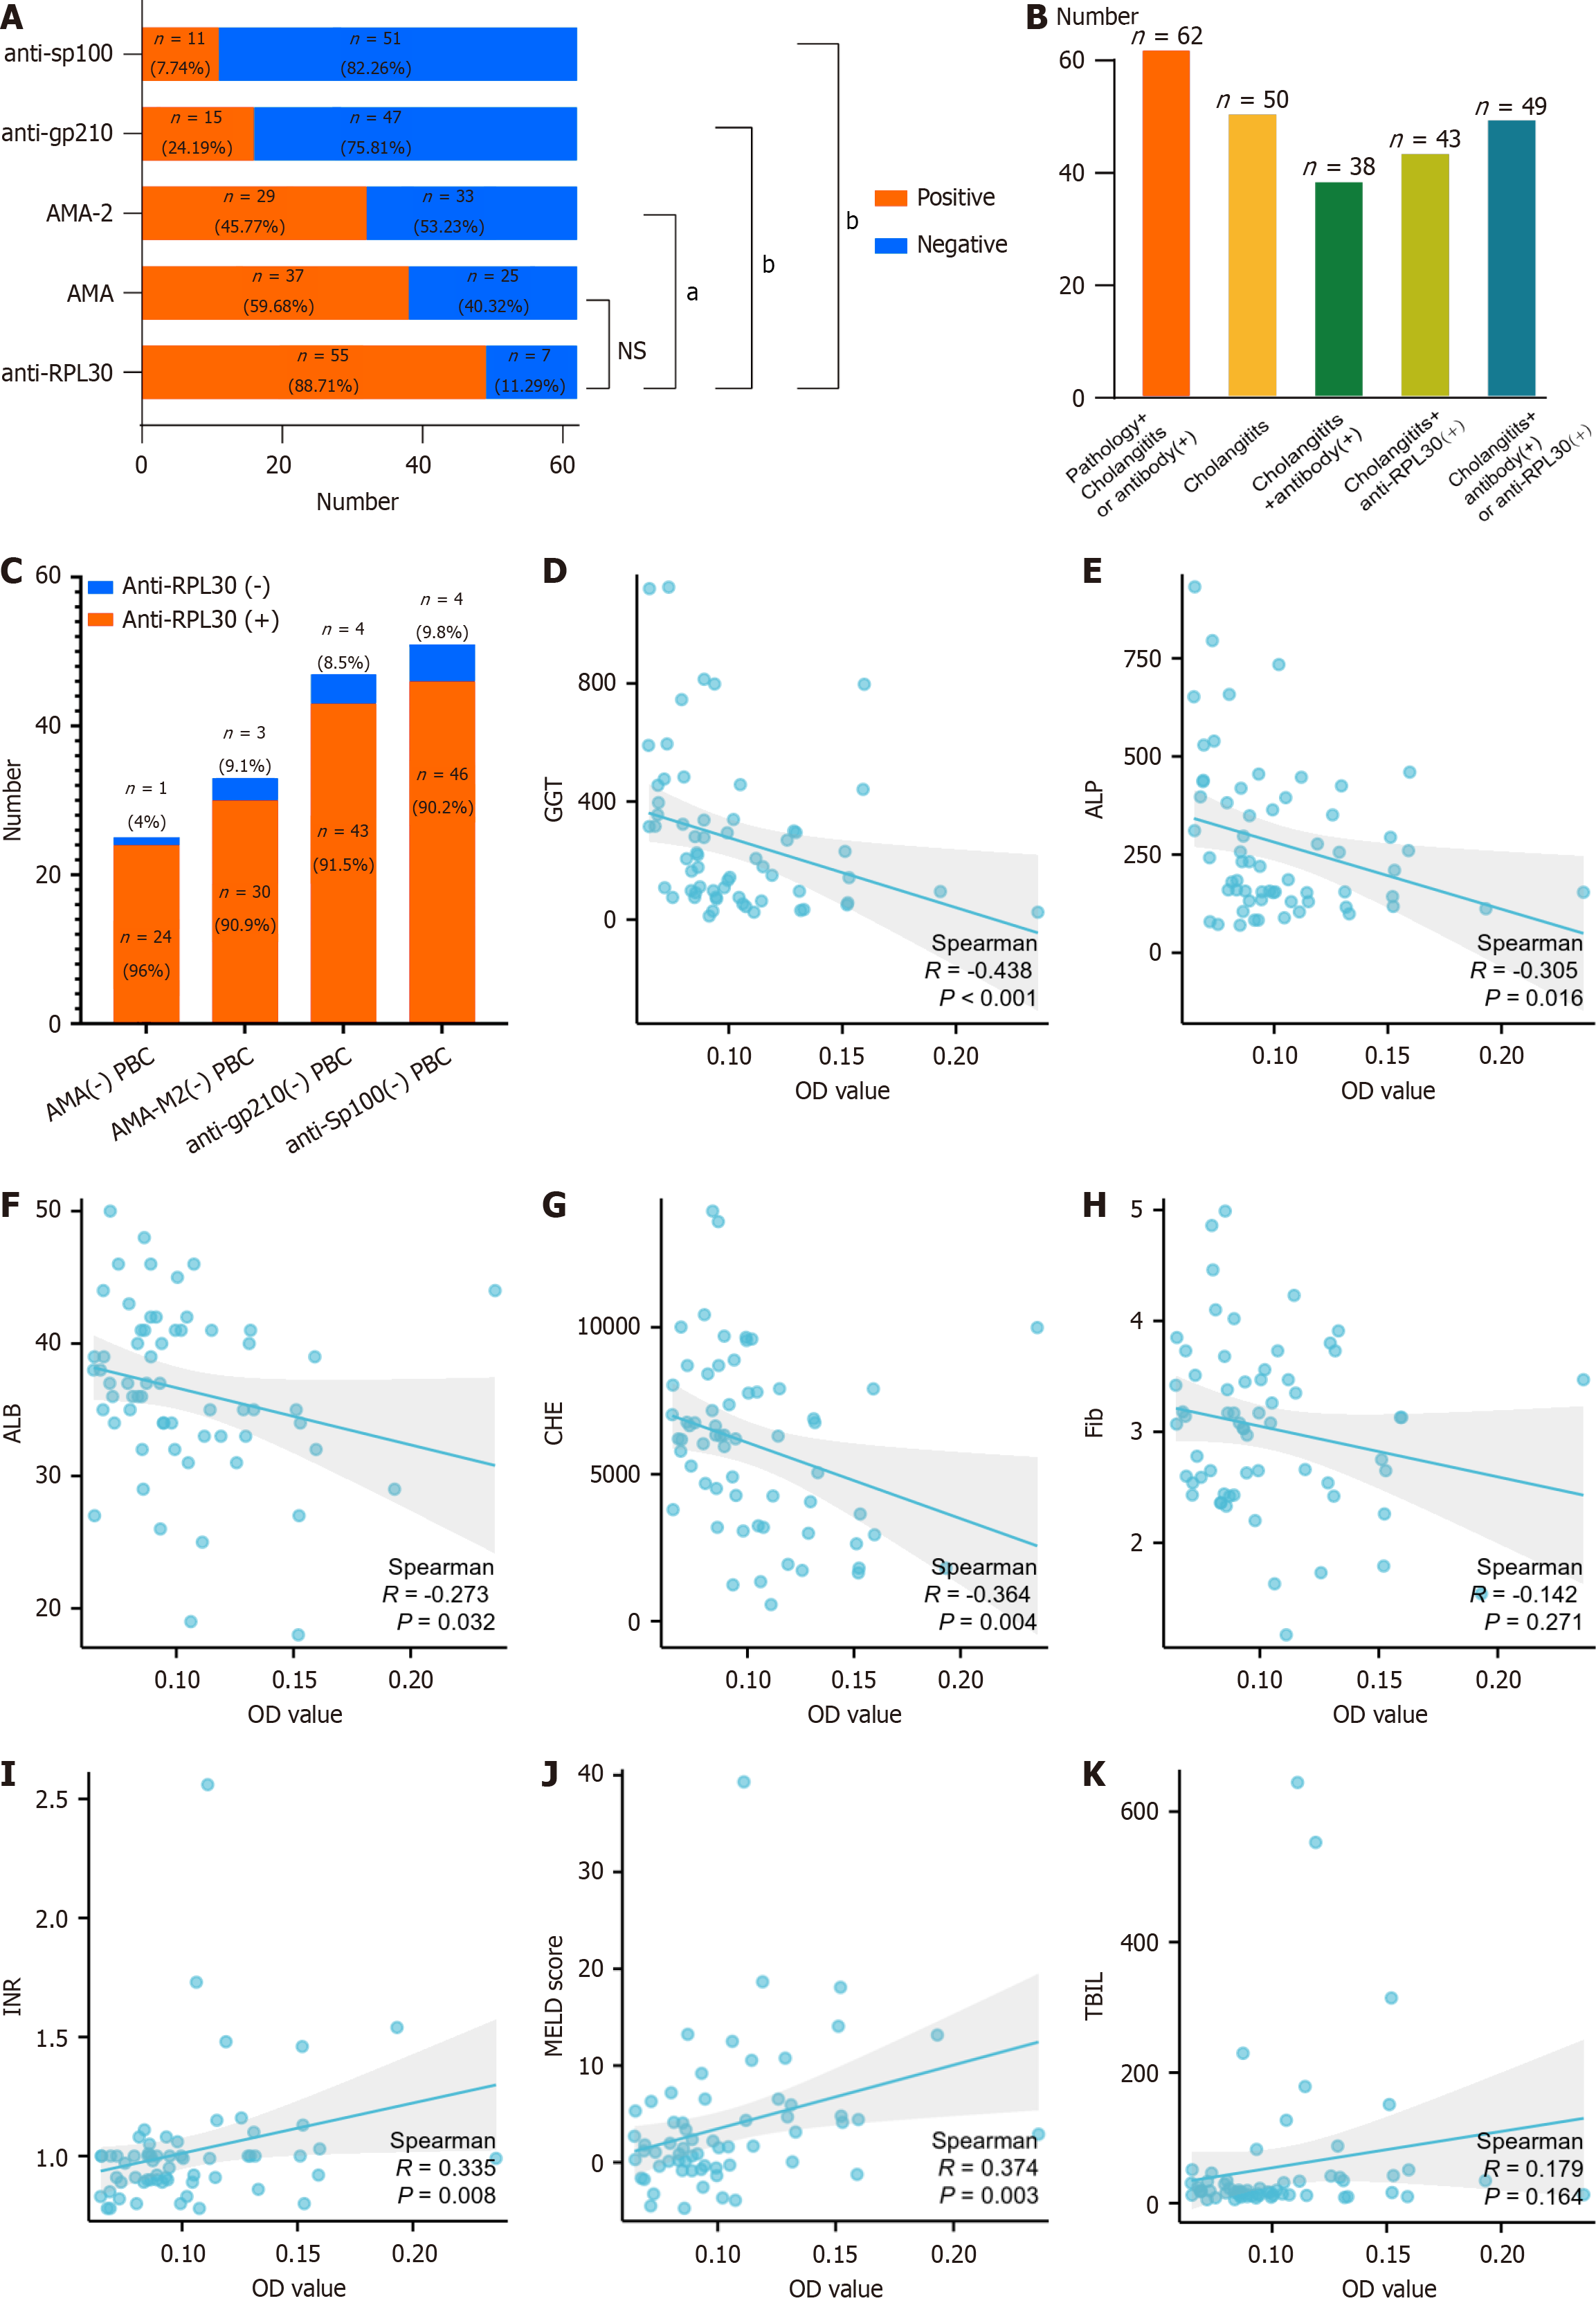
Figure 5 Analysis of clinical characteristics of patients with primary biliary cholangitis.
A: Autoantibody analysis of 62 patients with primary biliary cholangitis (PBC); B: Increased detection of PBC in patients with cholangitis features and anti-RPL30, even without liver biopsy; C: High anti-RPL30 positivity in patients with PBC negative for anti-mitochondrial antibody, anti-mitochondrial E2 subunit antibody, anti-glycoprotein 210, and anti-speckled protein 100; D–K: Correlation between anti-RPL30 optical density values and clinical indicators gamma-glutamyl transferase (D), alkaline phosphatase (E), albumin (F), cholinesterase (G), fibrinogen (H), international normalized ratio (I), Model for End-Stage Liver Disease score (J), and total bilirubin (K). aP < 0.01; bP < 0.0001. OD: Optical density; AMA: Anti-mitochondrial antibody; AMA-M2: Anti-mitochondrial E2 subunit antibody; Anti-gp210: Anti-glycoprotein 210; Anti-Sp100: Anti-speckled protein 100; PBC: Primary biliary cholangitis; AMA: Anti-mitochondrial antibody; ALP: Alkaline phosphatase; GGT: Gamma-glutamyl transferase; ALB: Albumin; CHE: Cholinesterase; FIB: Fibrinogen; TBIL: Total bilirubin; INR: International normalized ratio; MELD: Model for End-Stage Liver Disease.
- Citation: Zeng ZY, Huang ZX, Wang YR, Xie LK, Lin YP, Liang Y, Liu ZY, Li DL, Zhang XY. Anti-RPL30 as a novel biomarker for enhanced diagnosis of autoantibody-negative primary biliary cholangitis. World J Gastroenterol 2025; 31(20): 104891
- URL: https://www.wjgnet.com/1007-9327/full/v31/i20/104891.htm
- DOI: https://dx.doi.org/10.3748/wjg.v31.i20.104891


