Copyright
©The Author(s) 2024.
World J Gastroenterol. Oct 14, 2024; 30(38): 4211-4220
Published online Oct 14, 2024. doi: 10.3748/wjg.v30.i38.4211
Published online Oct 14, 2024. doi: 10.3748/wjg.v30.i38.4211
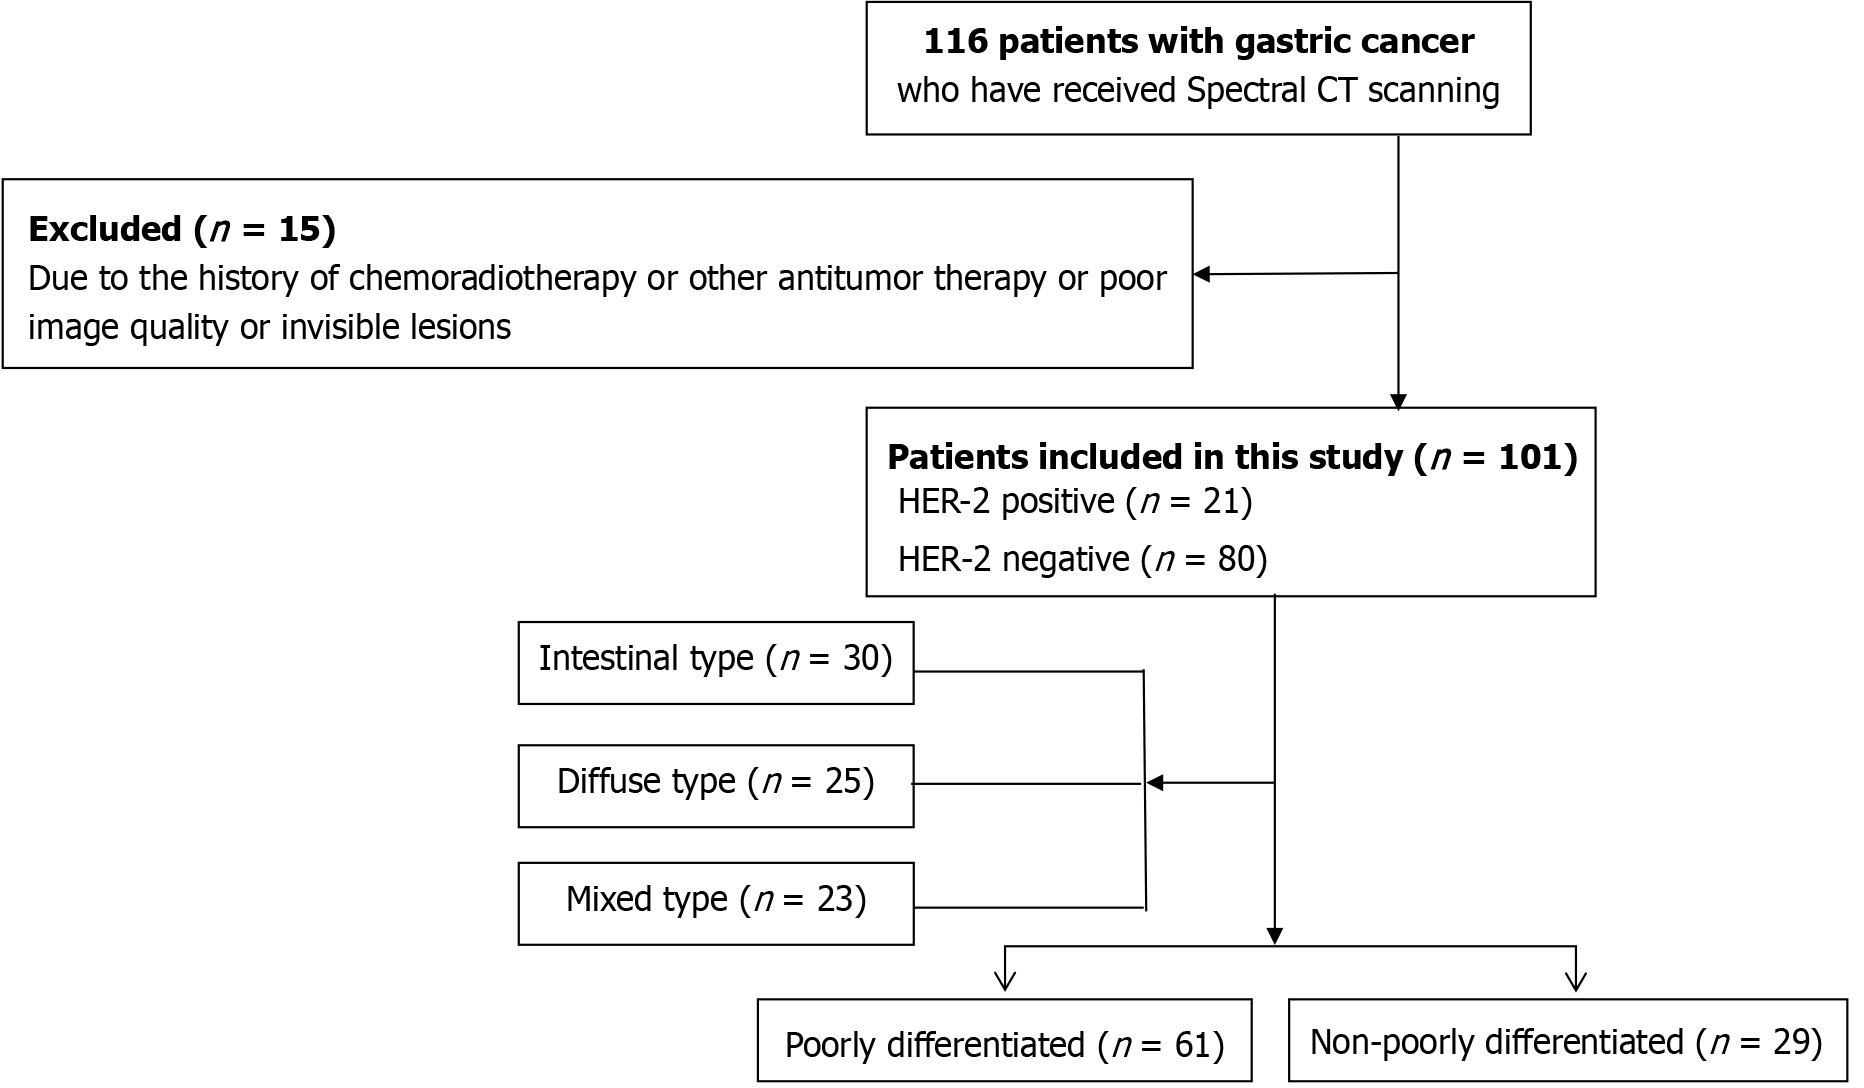
Figure 1 Diagram of study flow.
CT: Computed tomography.
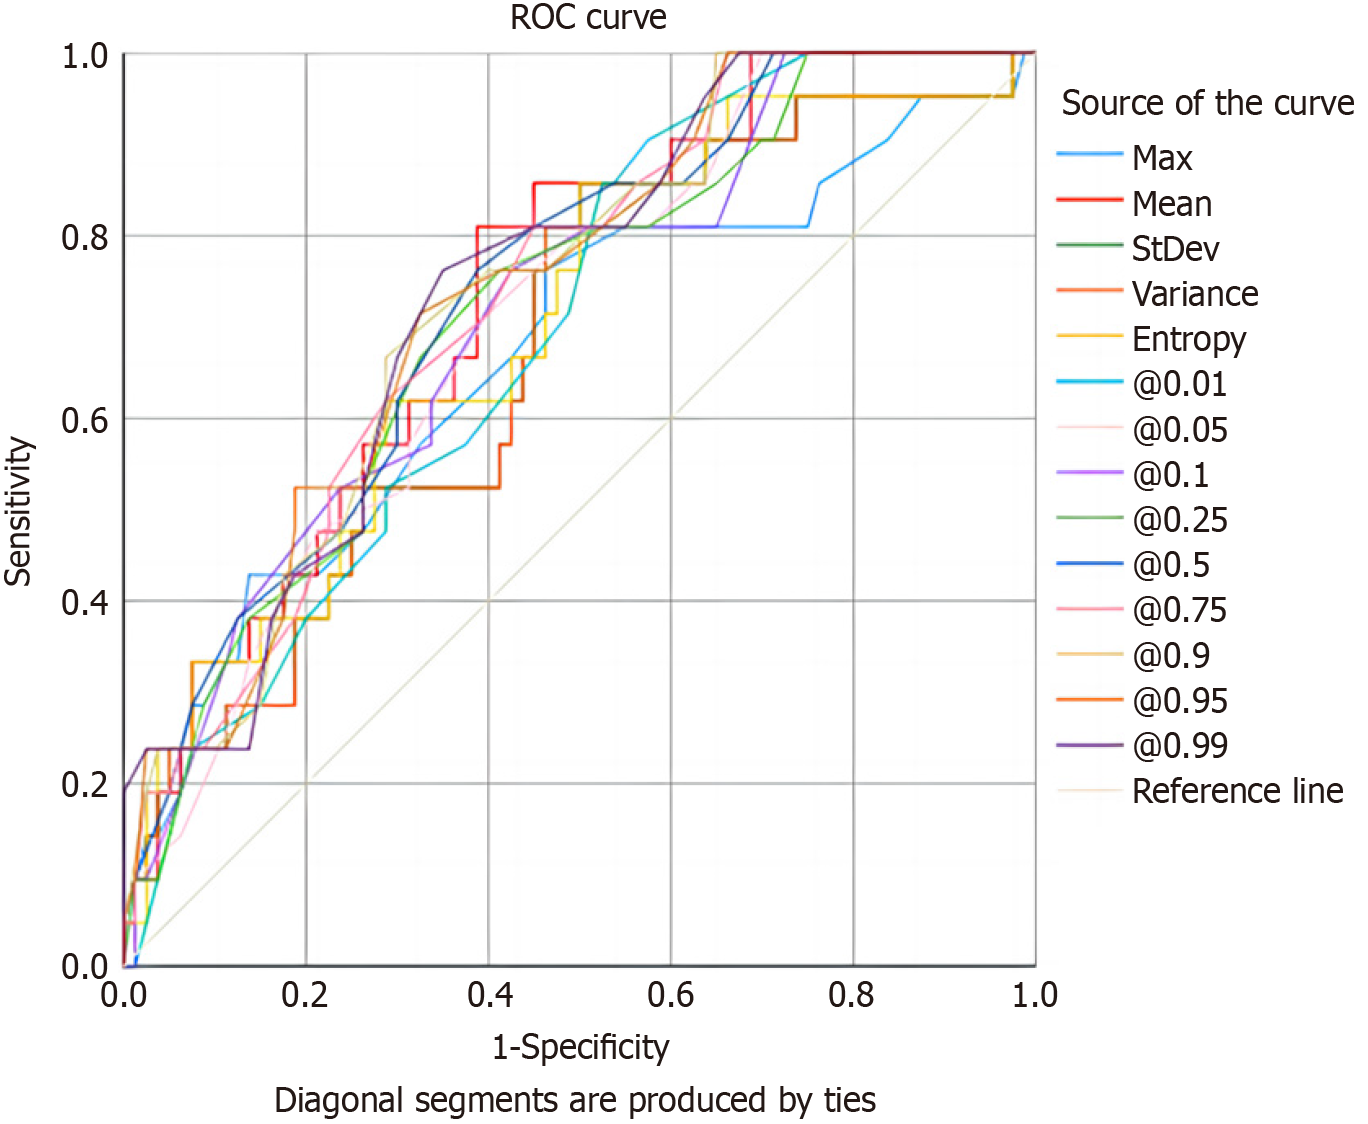
Figure 2 Receiver operating characteristic curves of the diagnostic performance of spectral computed tomography histogram parameters in the identification of HER2 status.
The 99th percentile had the best overall area under the curve among parameters (0.740), with 76.2% sensitivity, 65.0% specificity, and 67.3% accuracy. ROC: Receiver operating characteristic.
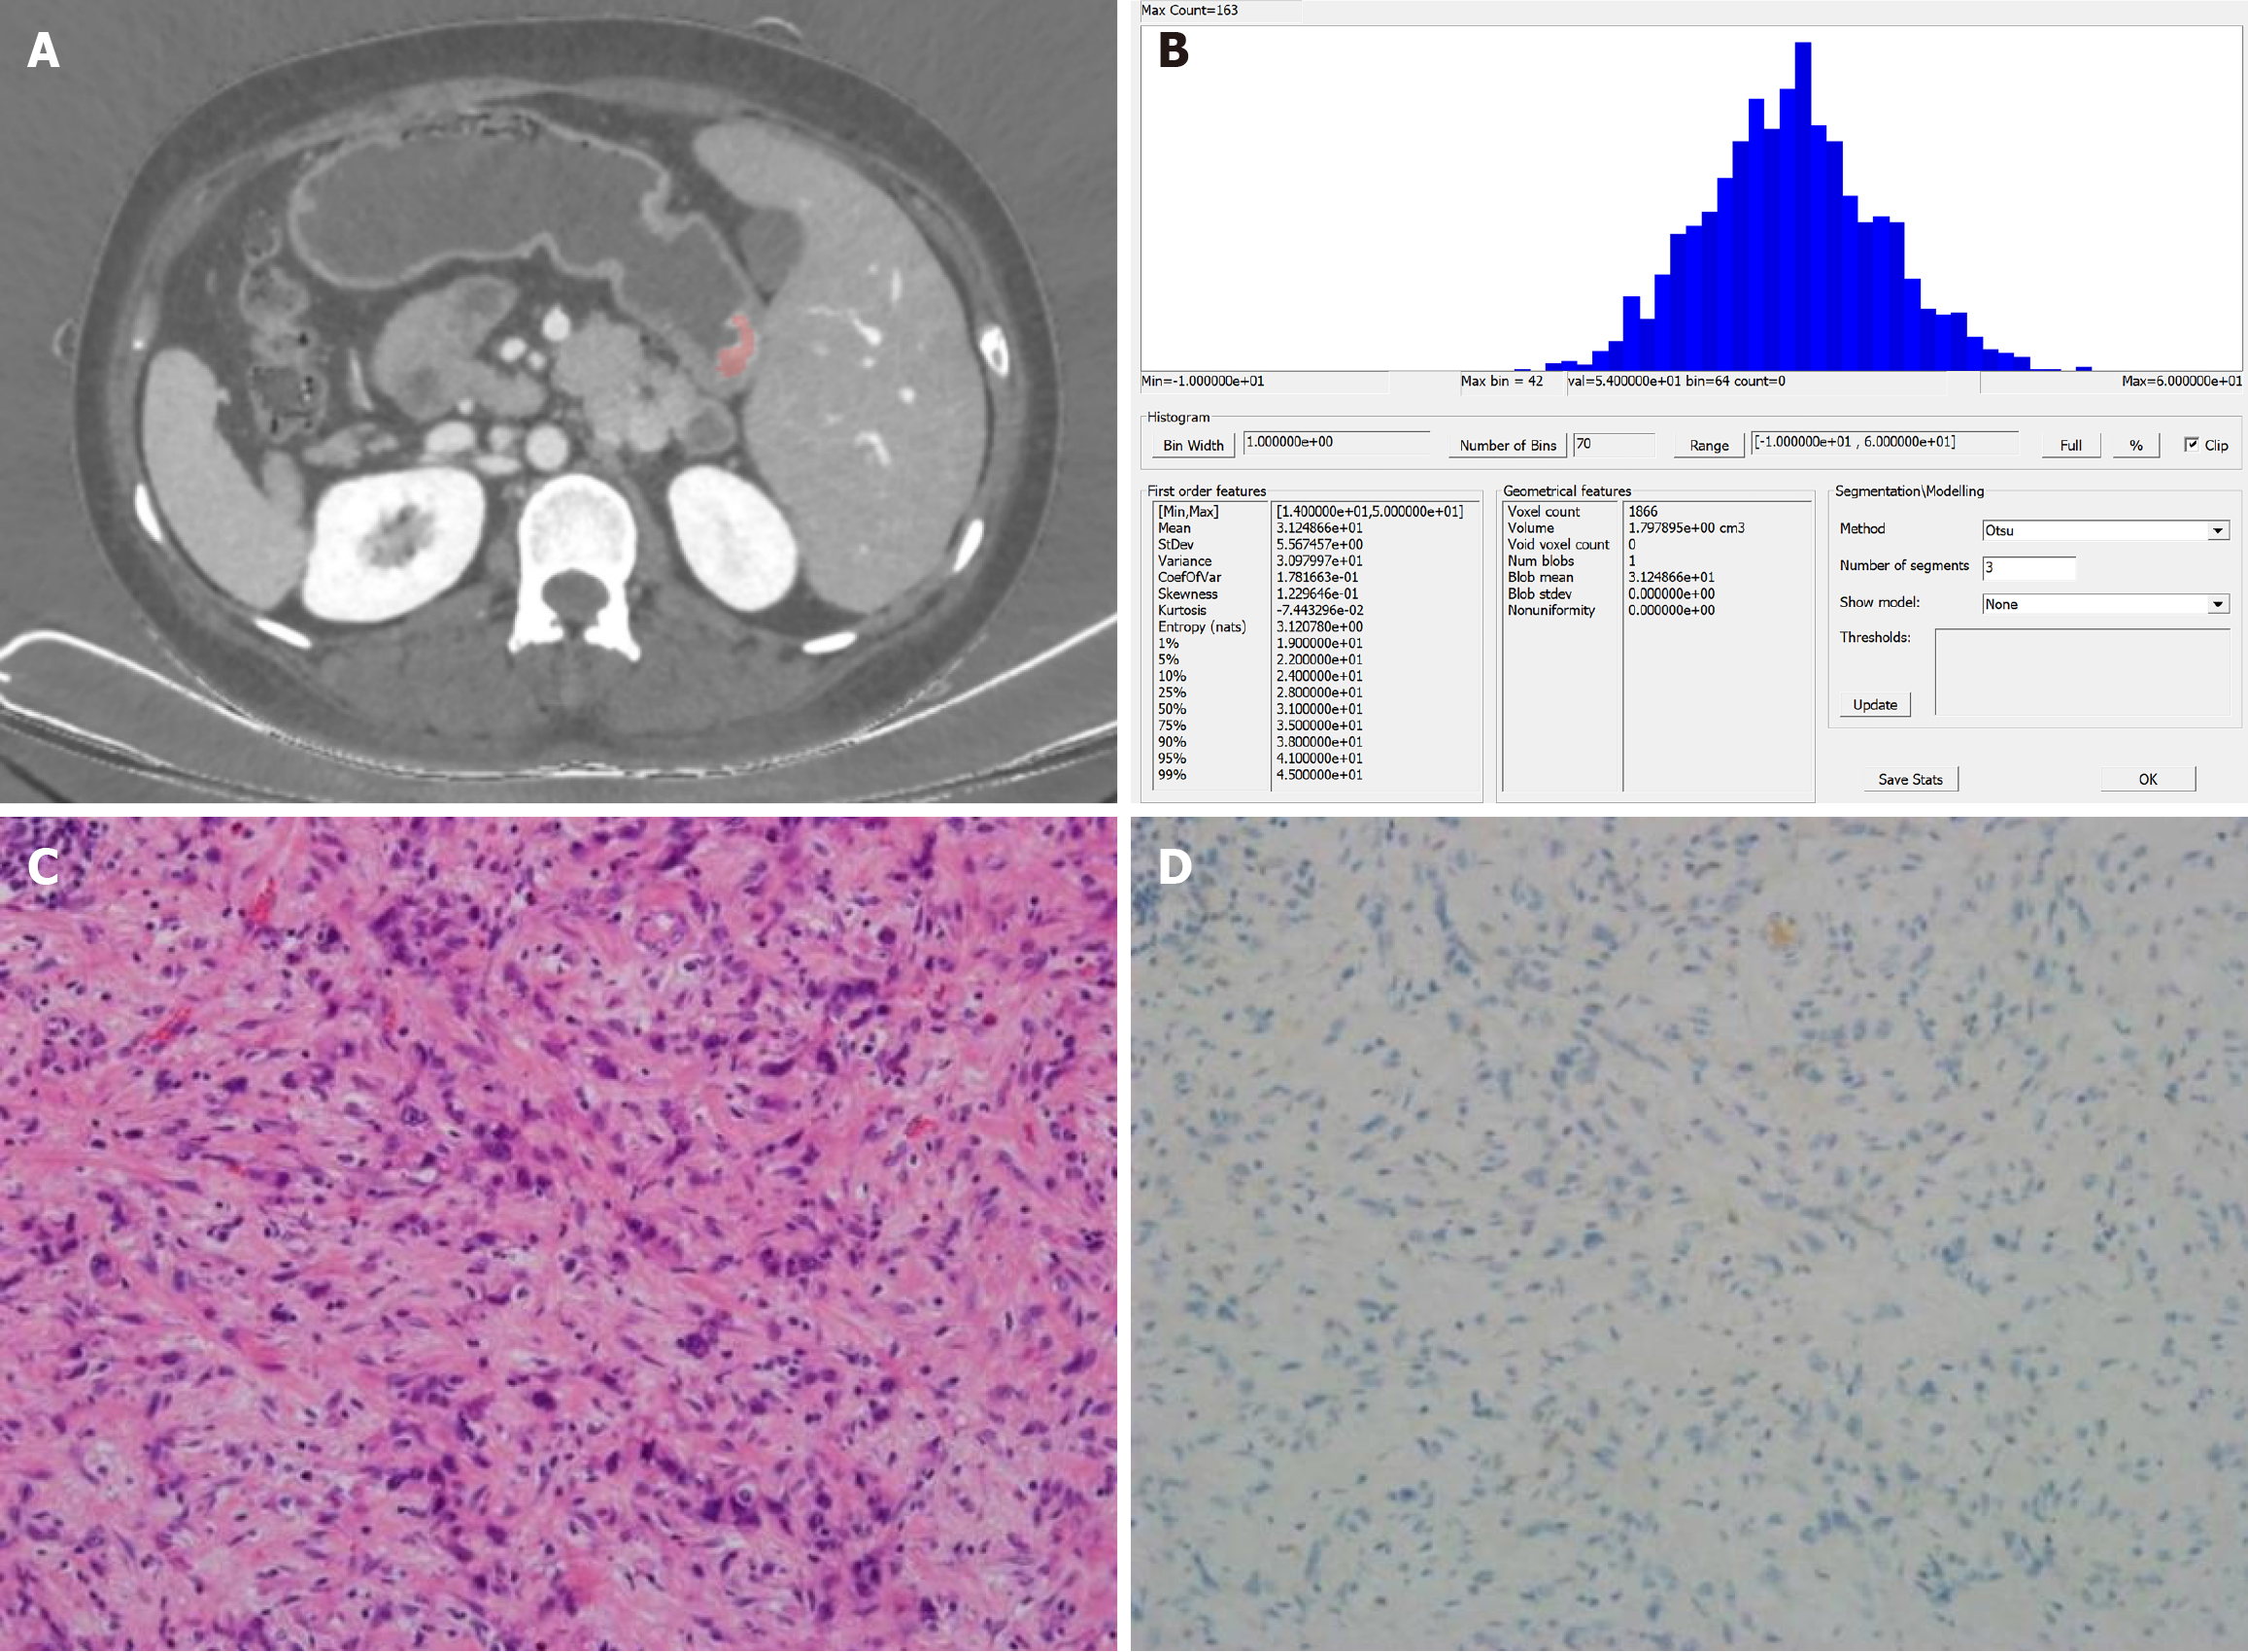
Figure 3 Images from a 43-year-old woman with poorly differentiated gastric adenocarcinoma.
A: Portal venous-phase spectral computed tomography image showing clear (pink) enhancement of the lesion, located at the gastric antrum; B: Histogram of parameter distributions for the whole tumor (minimum = 14.000, maximum = 50.000, mean = 31.249, standard deviation = 5.567, skewness = 0.123, kurtosis = 0.074, 1st-99th percentiles = 19.000, 22.000, 24.000, 28.000, 31.000, 35.000, 38.000, 41.000, and 45.000, respectively); C and D: Microscopic pathological (HE staining, 200 ×) and immunohistochemical images, respectively, showing a poorly differentiated adenocarcinoma with a Lauren classification of diffuse type, vascular and neural invasion, and negative HER2 staining.
- Citation: Zhang WL, Sun J, Huang RF, Zeng Y, Chen S, Wang XP, Chen JH, Chen YB, Zhu CS, Ye ZS, Xiao YP. Whole-volume histogram analysis of spectral-computed tomography iodine maps characterizes HER2 expression in gastric cancer. World J Gastroenterol 2024; 30(38): 4211-4220
- URL: https://www.wjgnet.com/1007-9327/full/v30/i38/4211.htm
- DOI: https://dx.doi.org/10.3748/wjg.v30.i38.4211


