Copyright
©The Author(s) 2024.
World J Gastroenterol. Sep 28, 2024; 30(36): 4044-4056
Published online Sep 28, 2024. doi: 10.3748/wjg.v30.i36.4044
Published online Sep 28, 2024. doi: 10.3748/wjg.v30.i36.4044
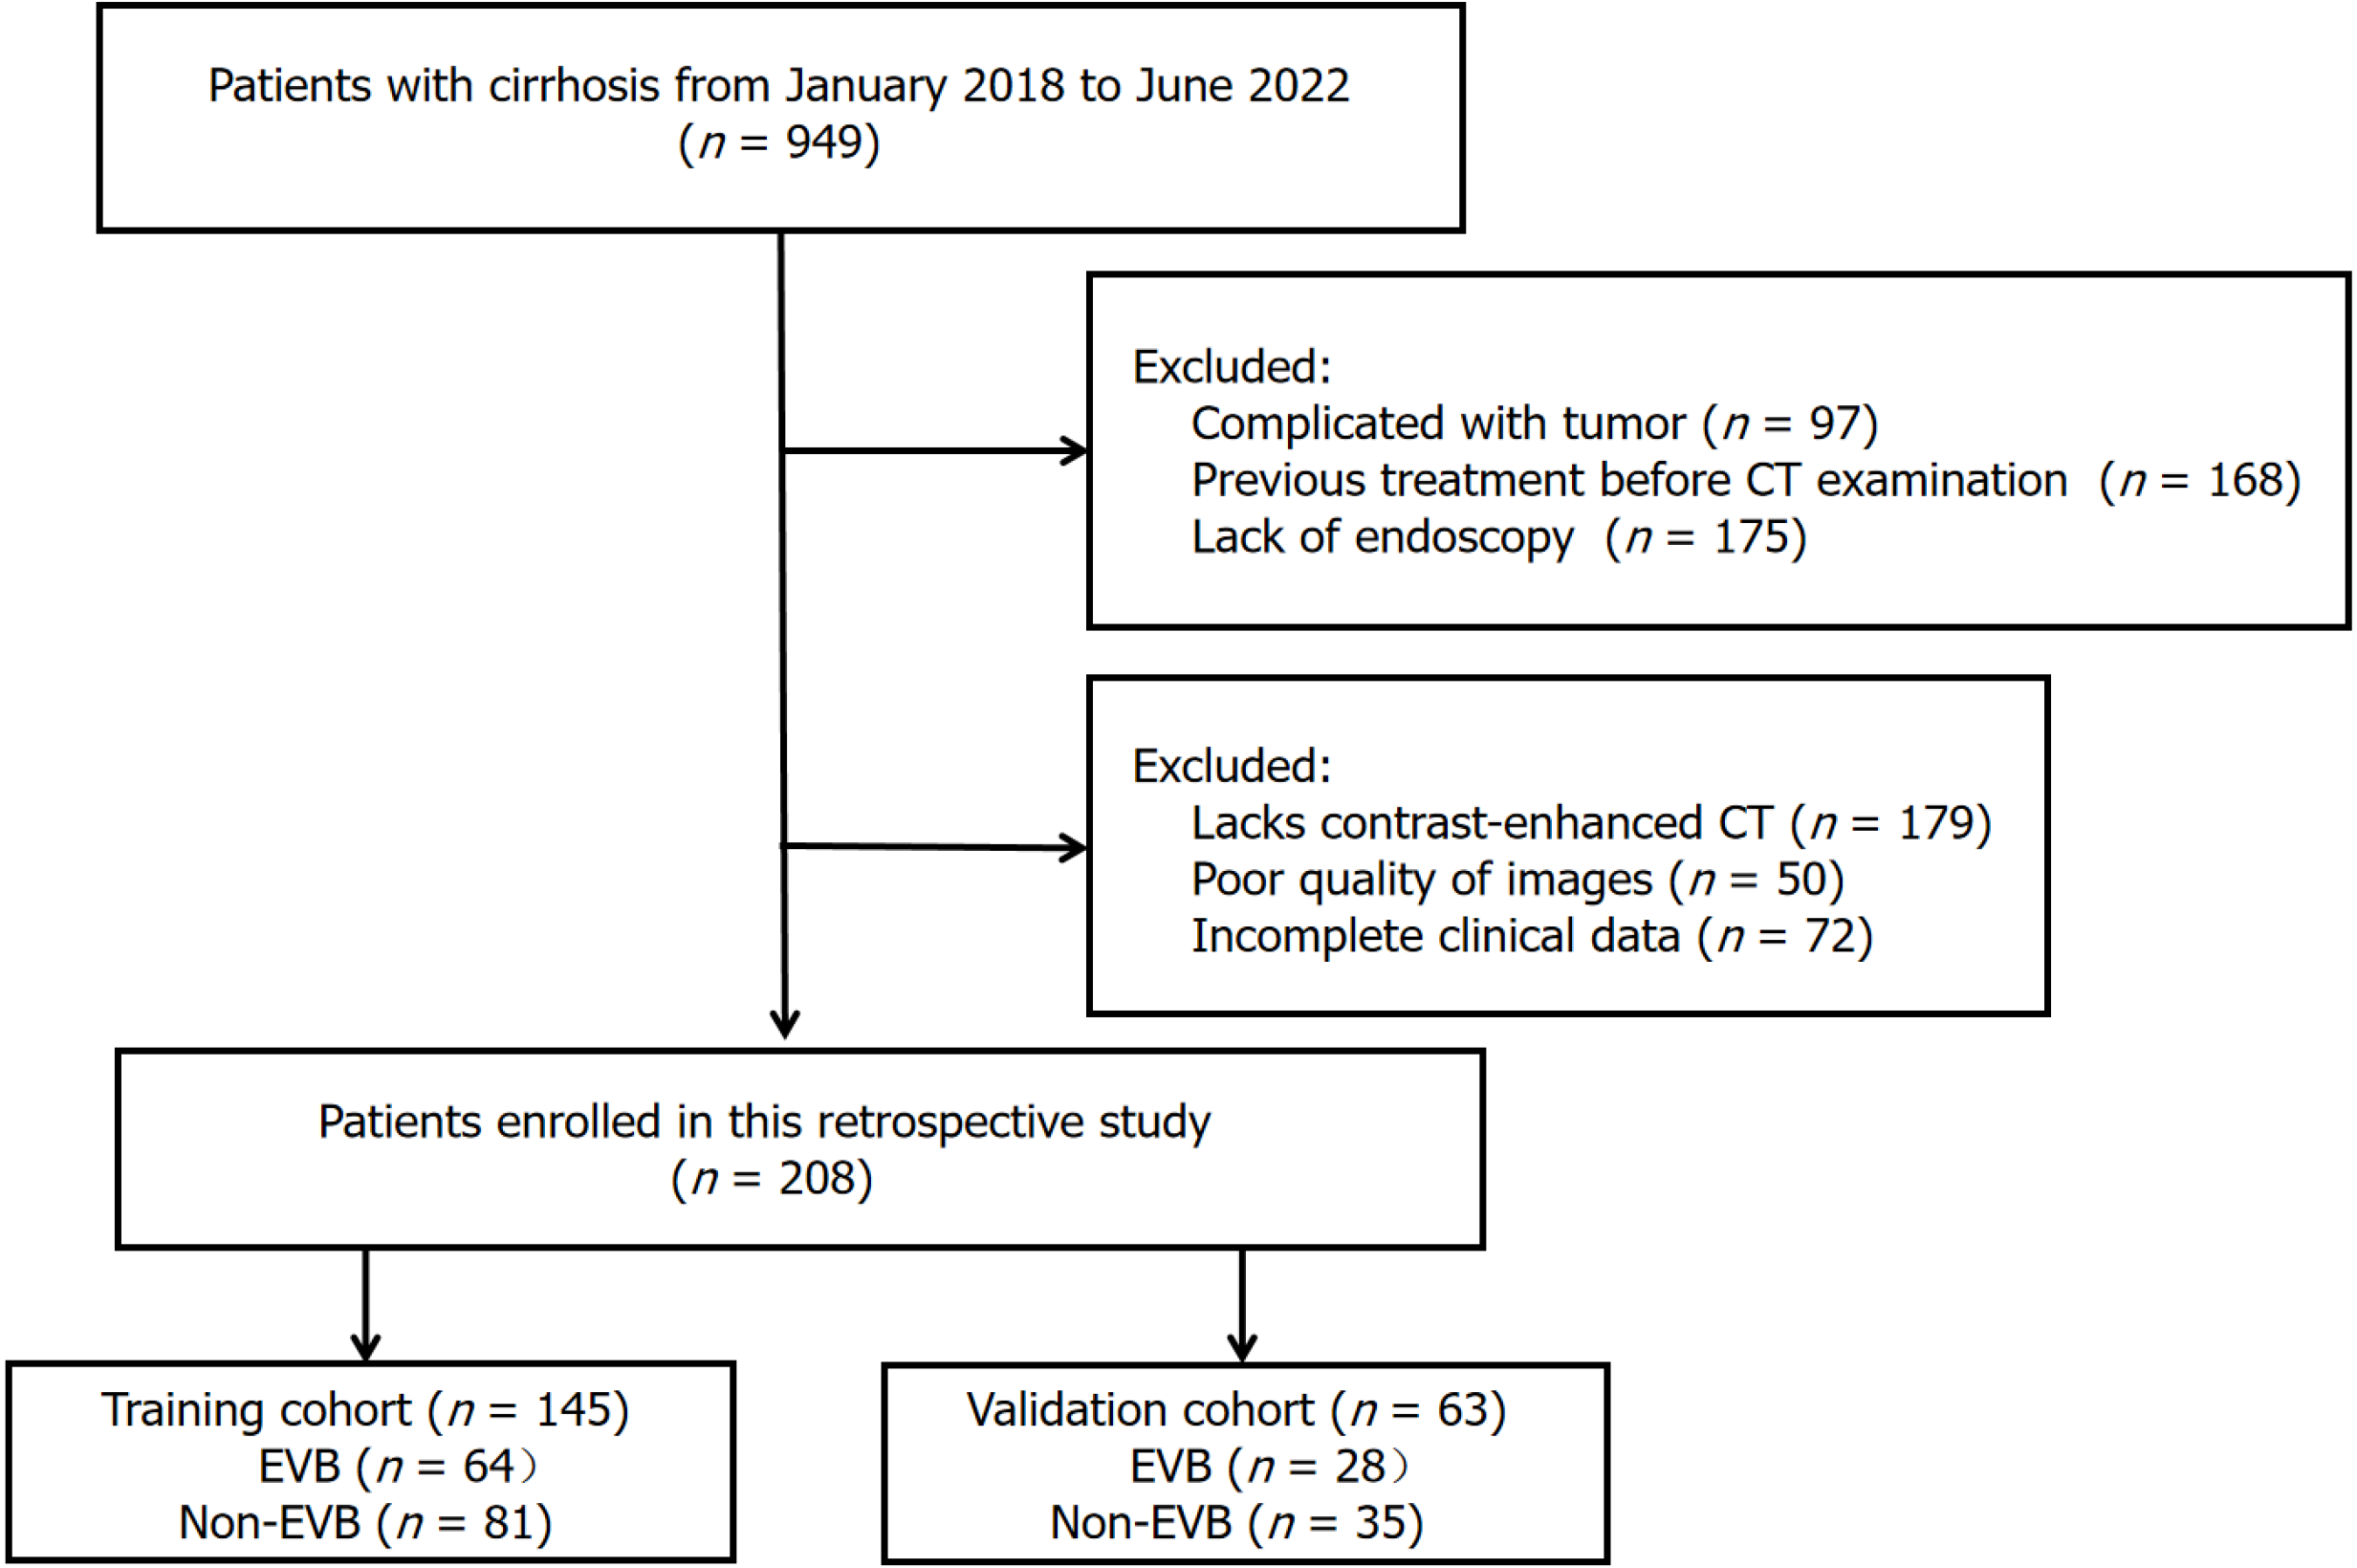
Figure 1 Flowchart of inclusion and exclusion criteria.
CT: Computed tomography; EVB: Esophageal variceal bleeding.
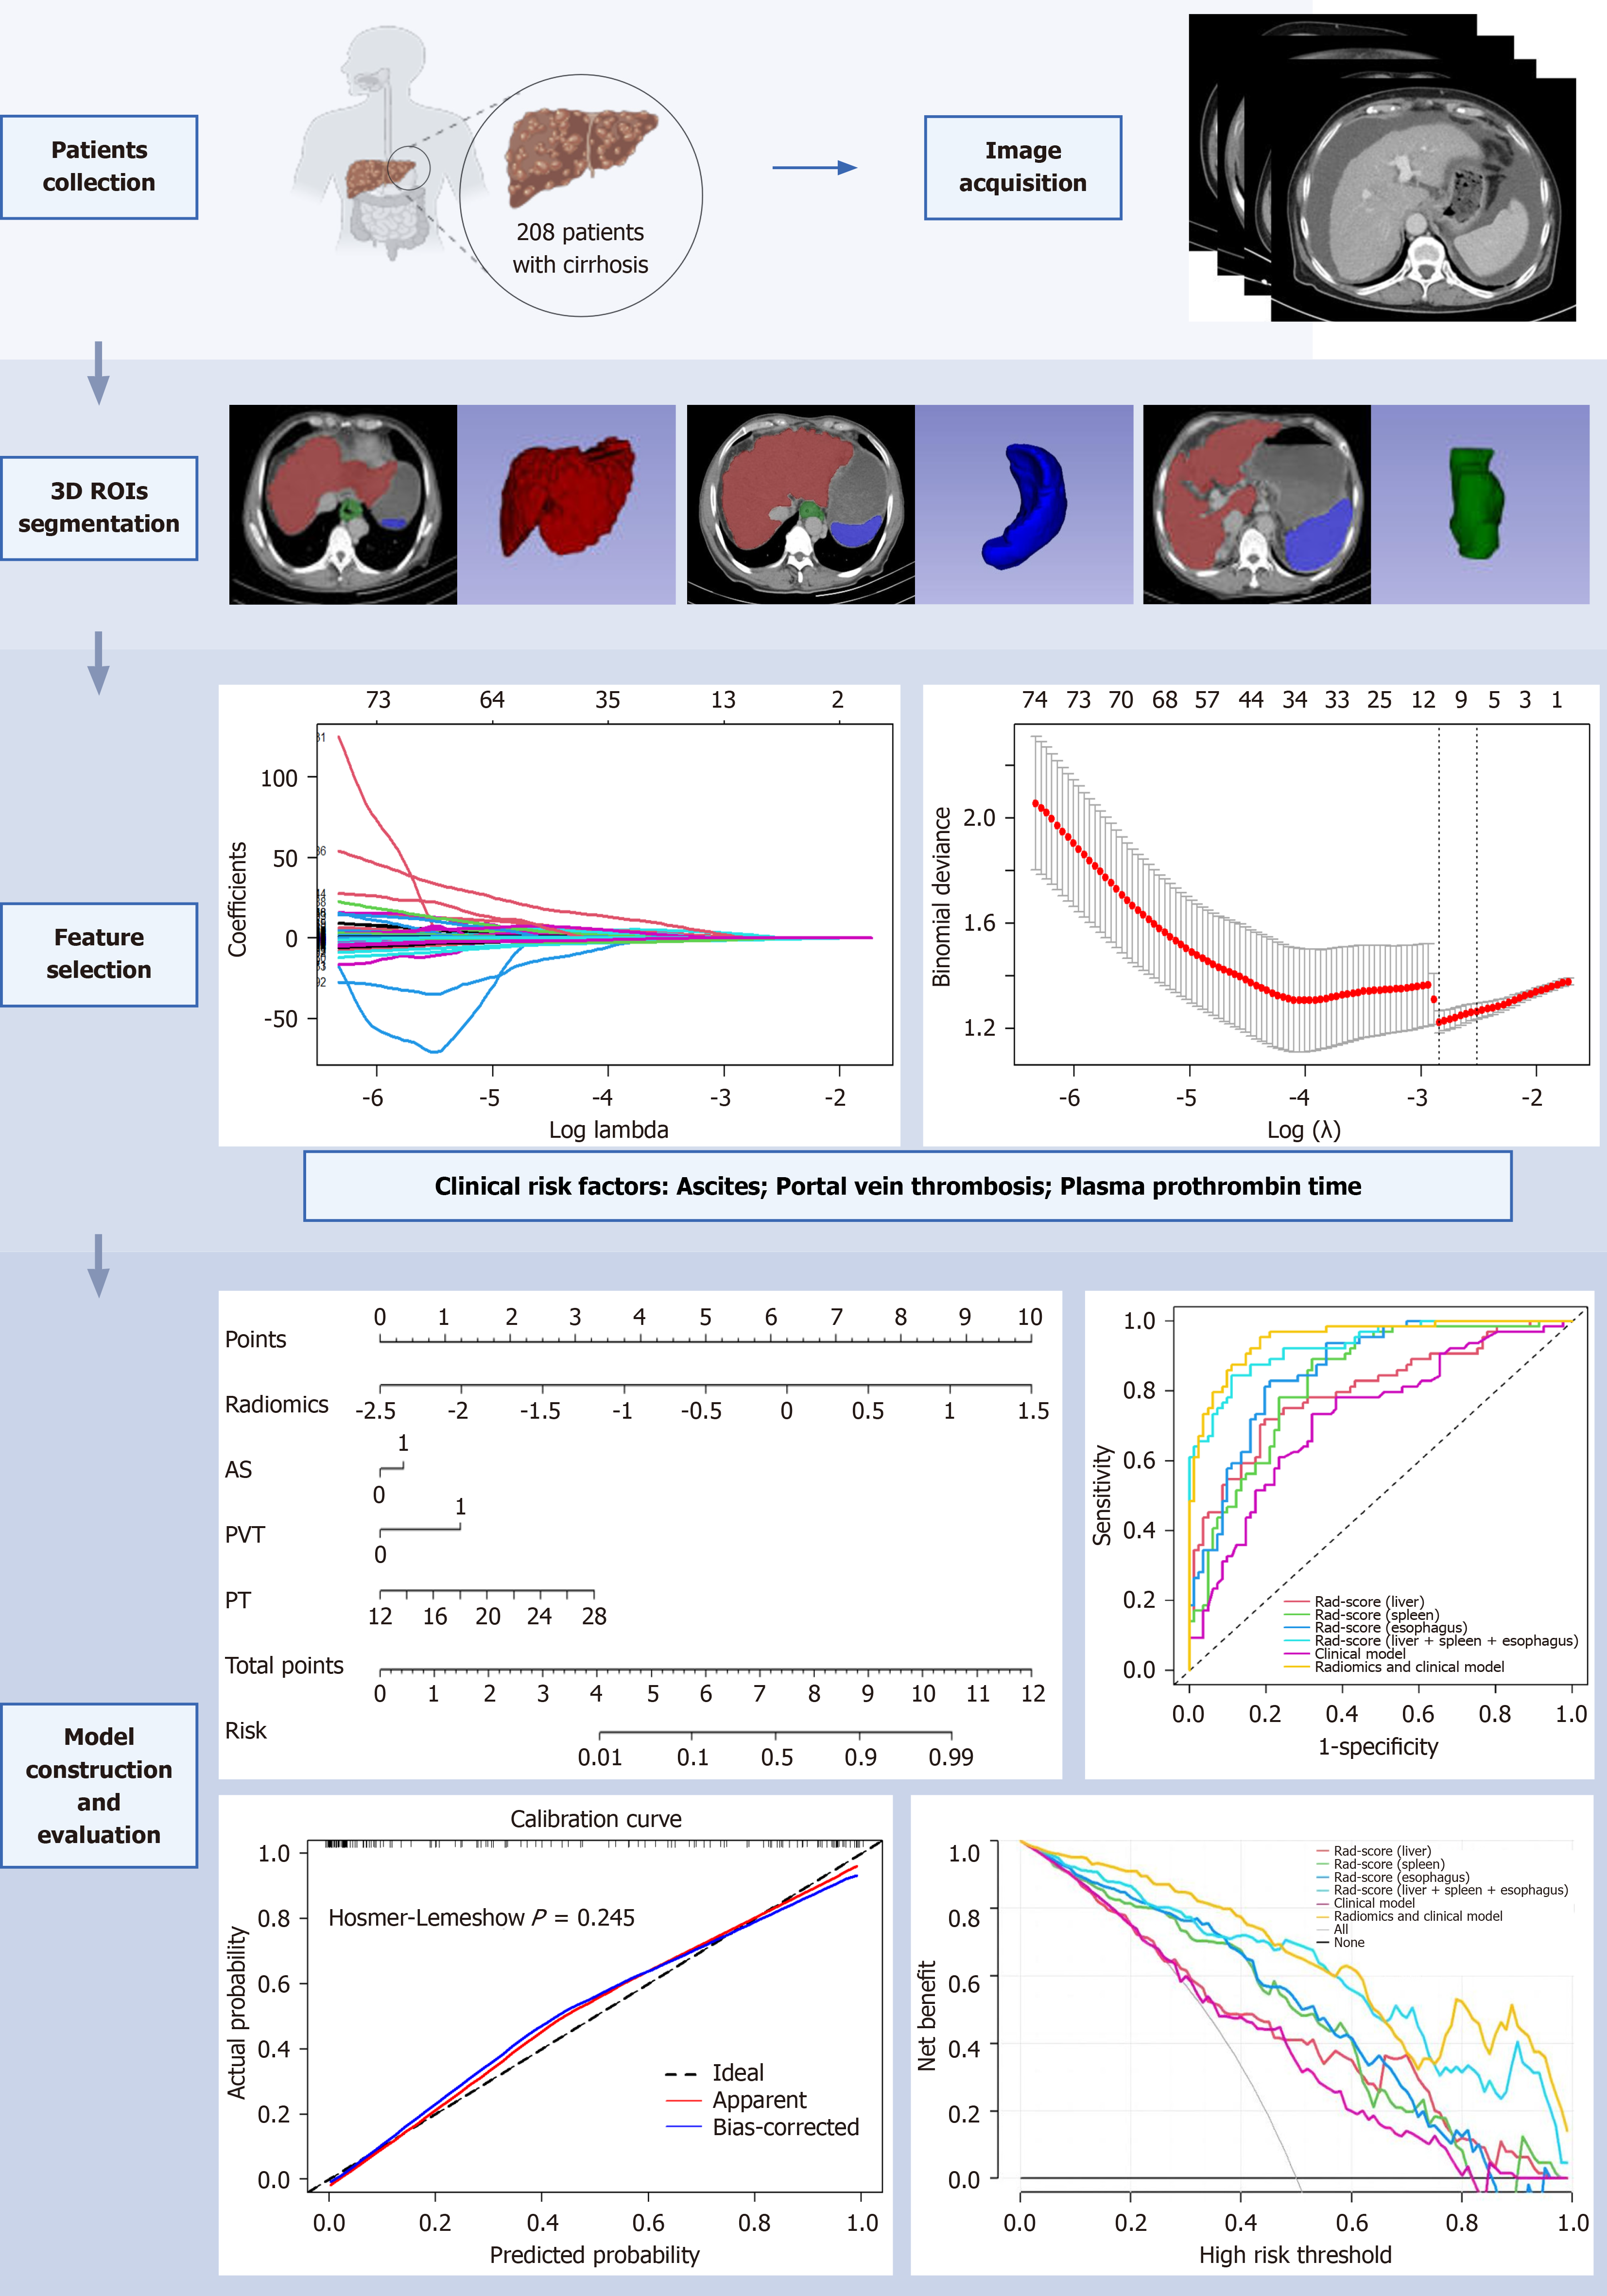
Figure 2 Radiomics workflow.
ROI: Region-of-interest.
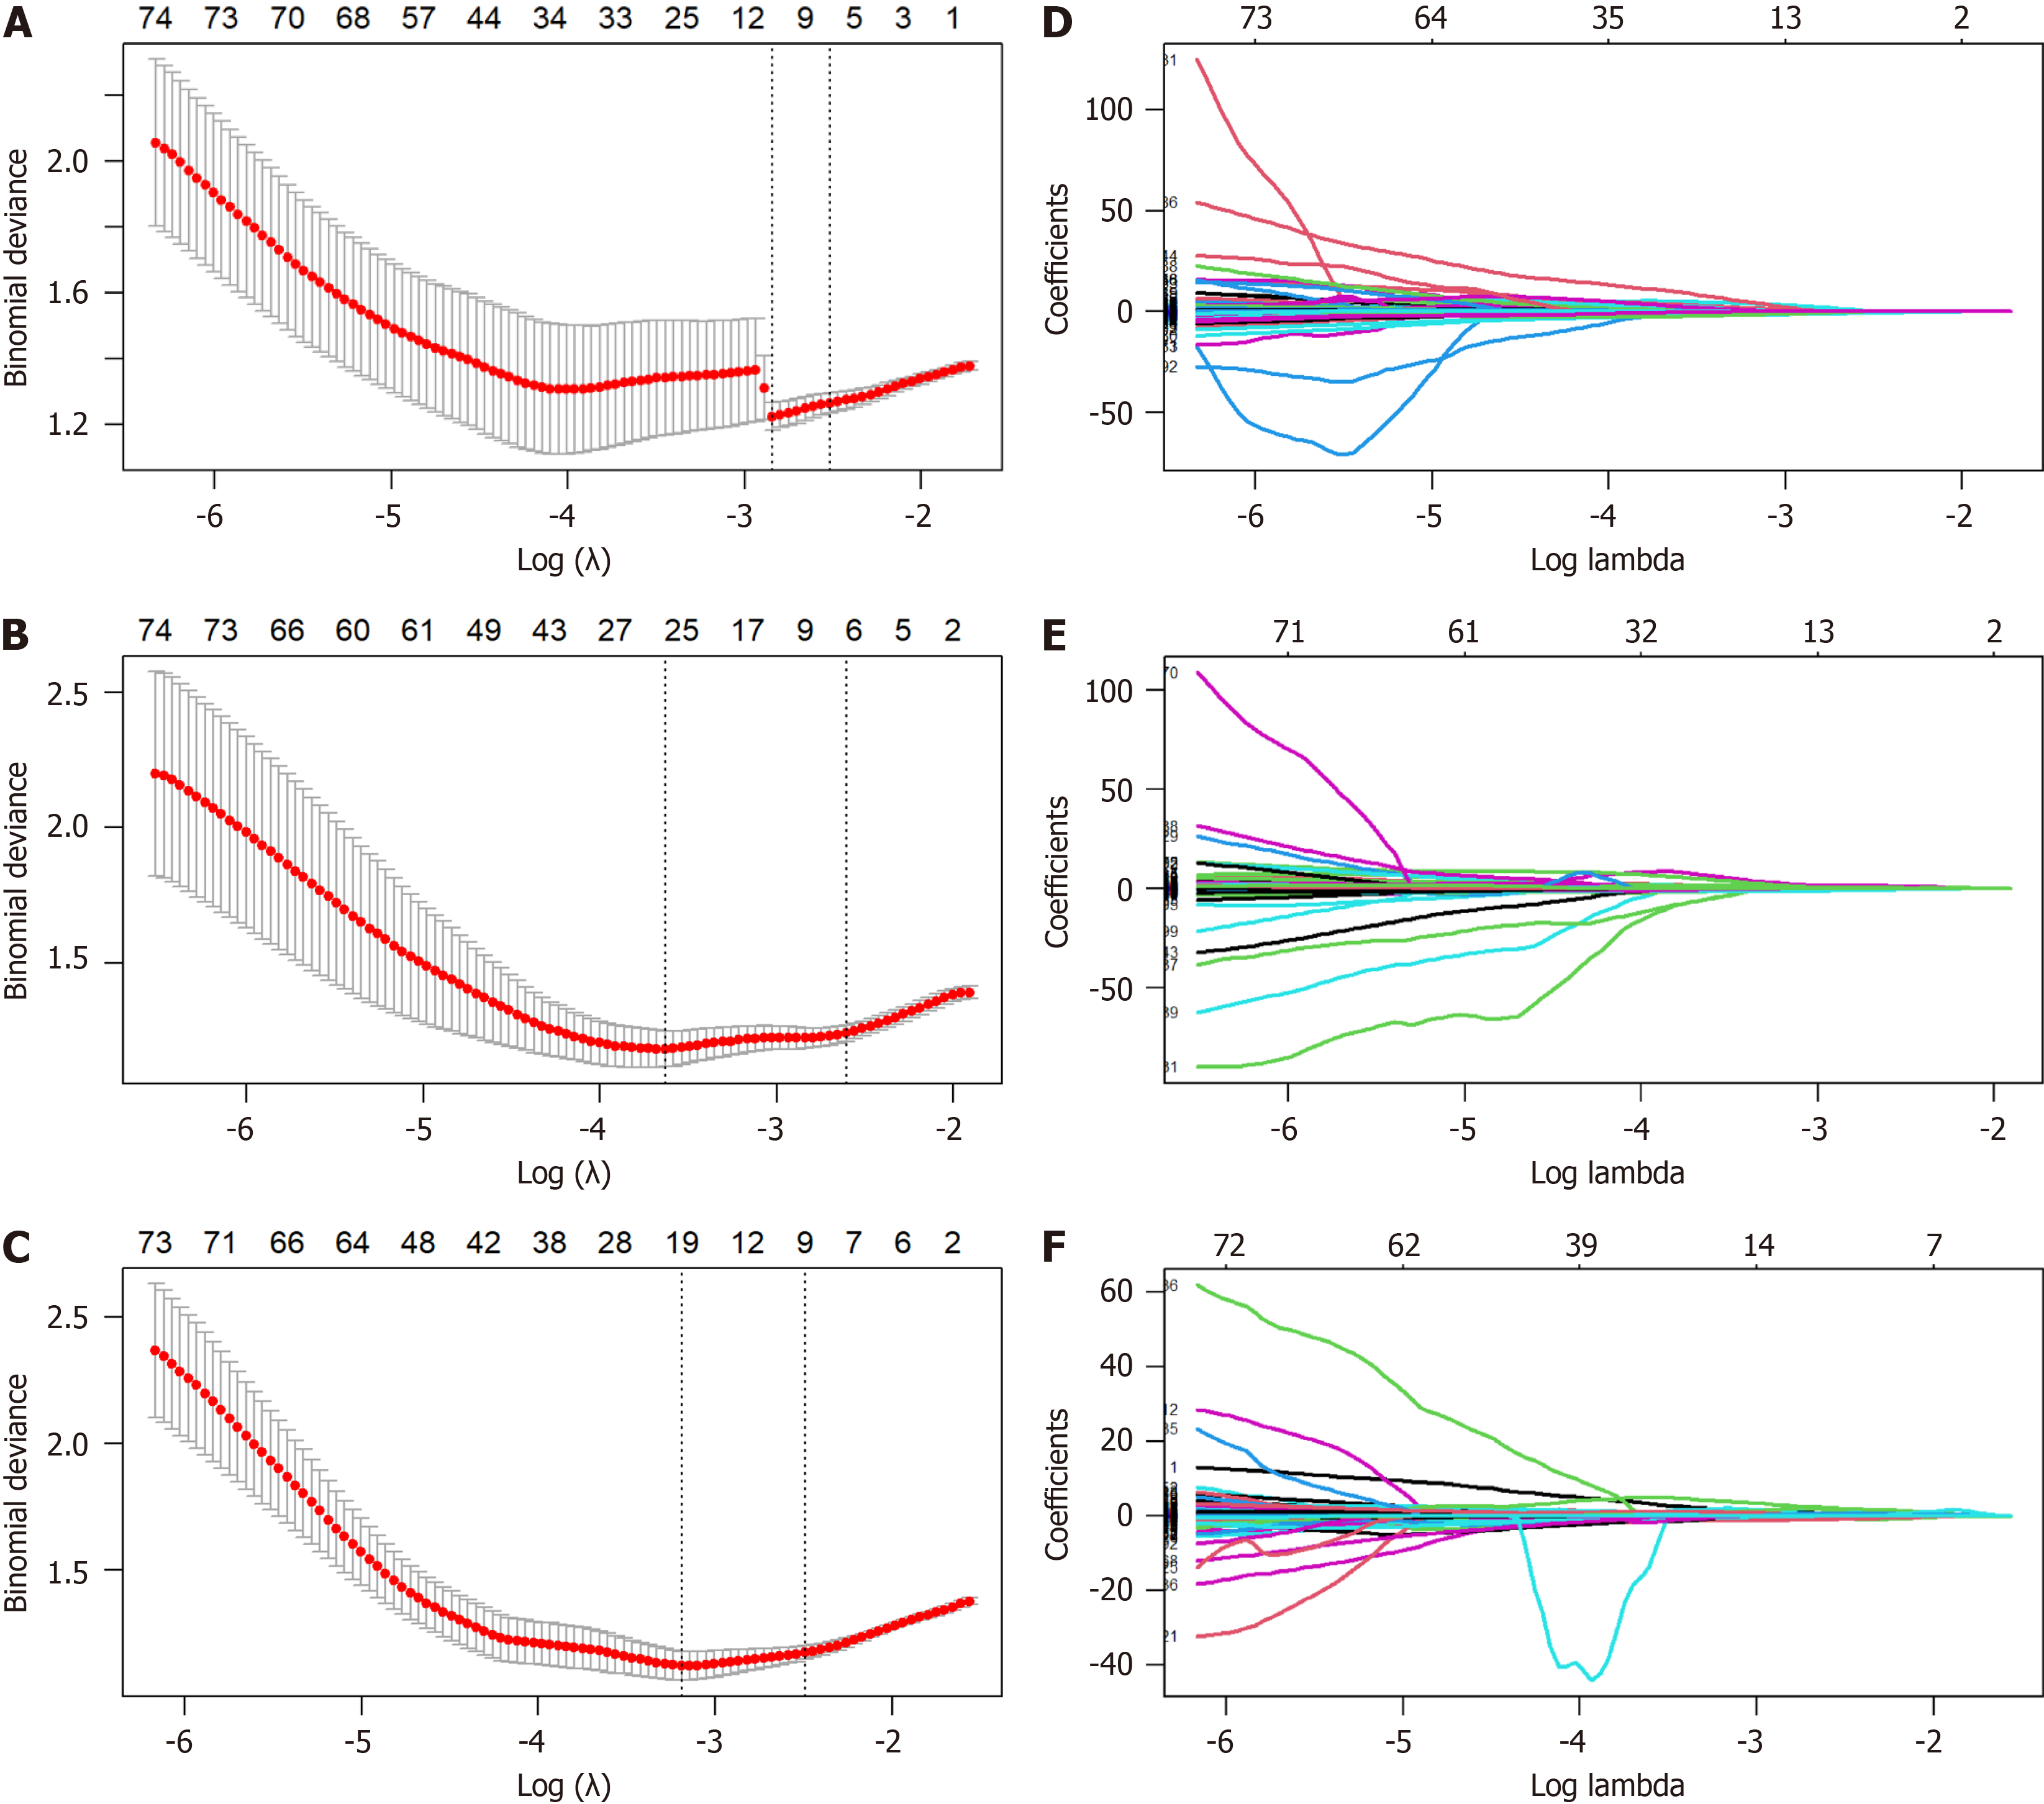
Figure 3 The process of feature selection and dimensionality reduction through least absolute shrinkage and selection operator.
A-C: Least absolute shrinkage and selection operator regression model cross-verifies the selection process of the penalty parameter Lambda, and selects the radiomic features with non-zero coefficients according to the principle of minimum deviation; D-F: Convergence diagram of radiomic feature coefficients.
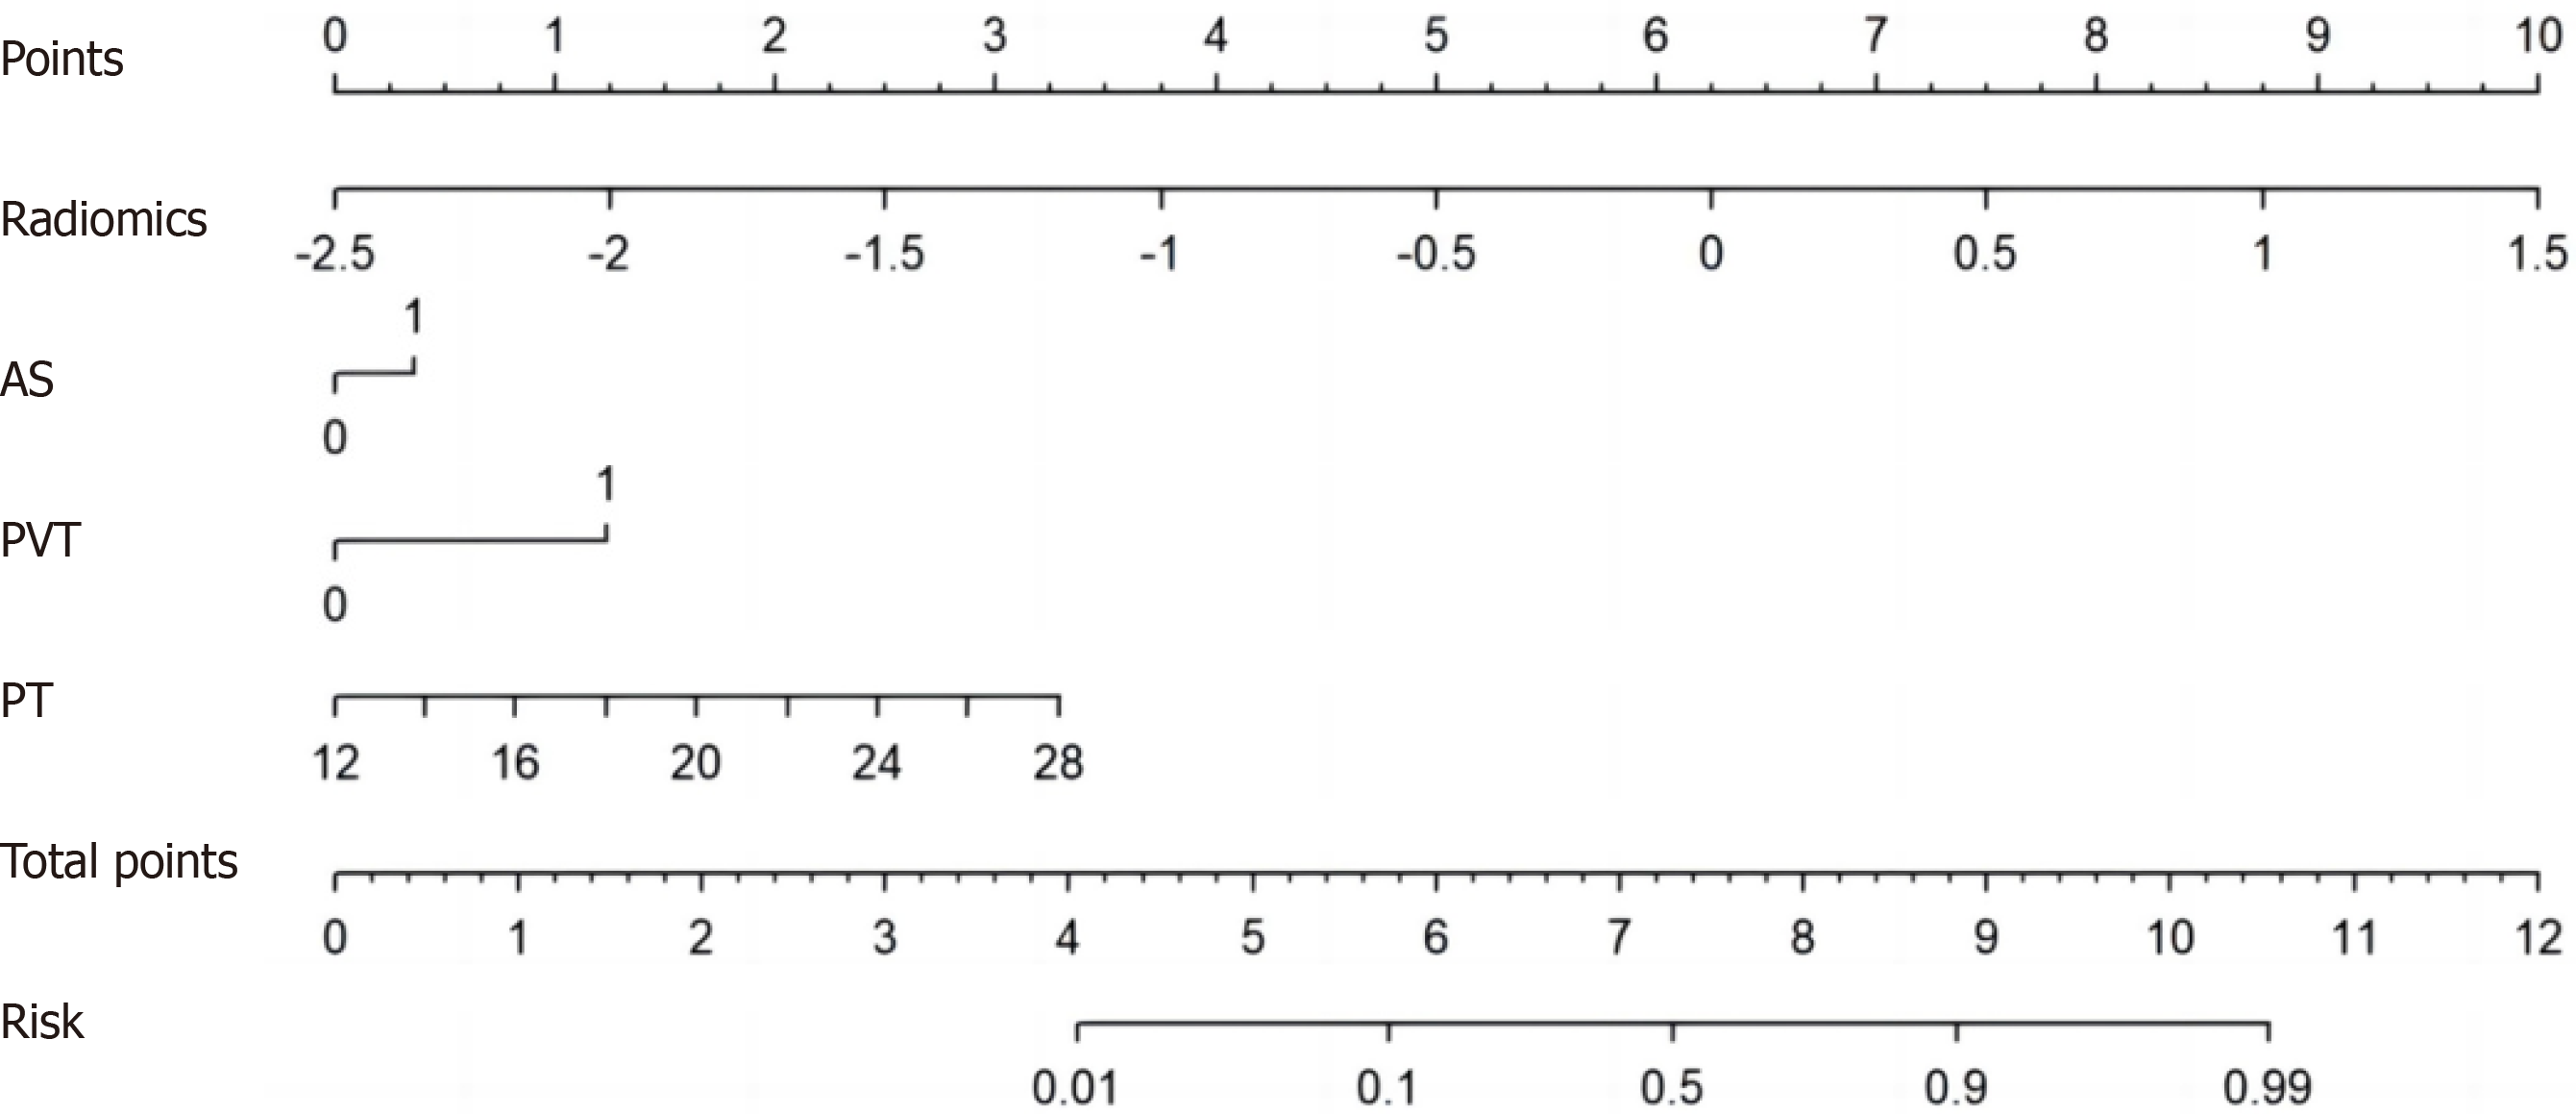
Figure 4 Nomogram for the radiomics-clinical model.
Radiomics, Rad-score (liver + spleen + esophagus). AS: Ascites; PVT: Portal vein thrombosis; PT: Prothrombin time.
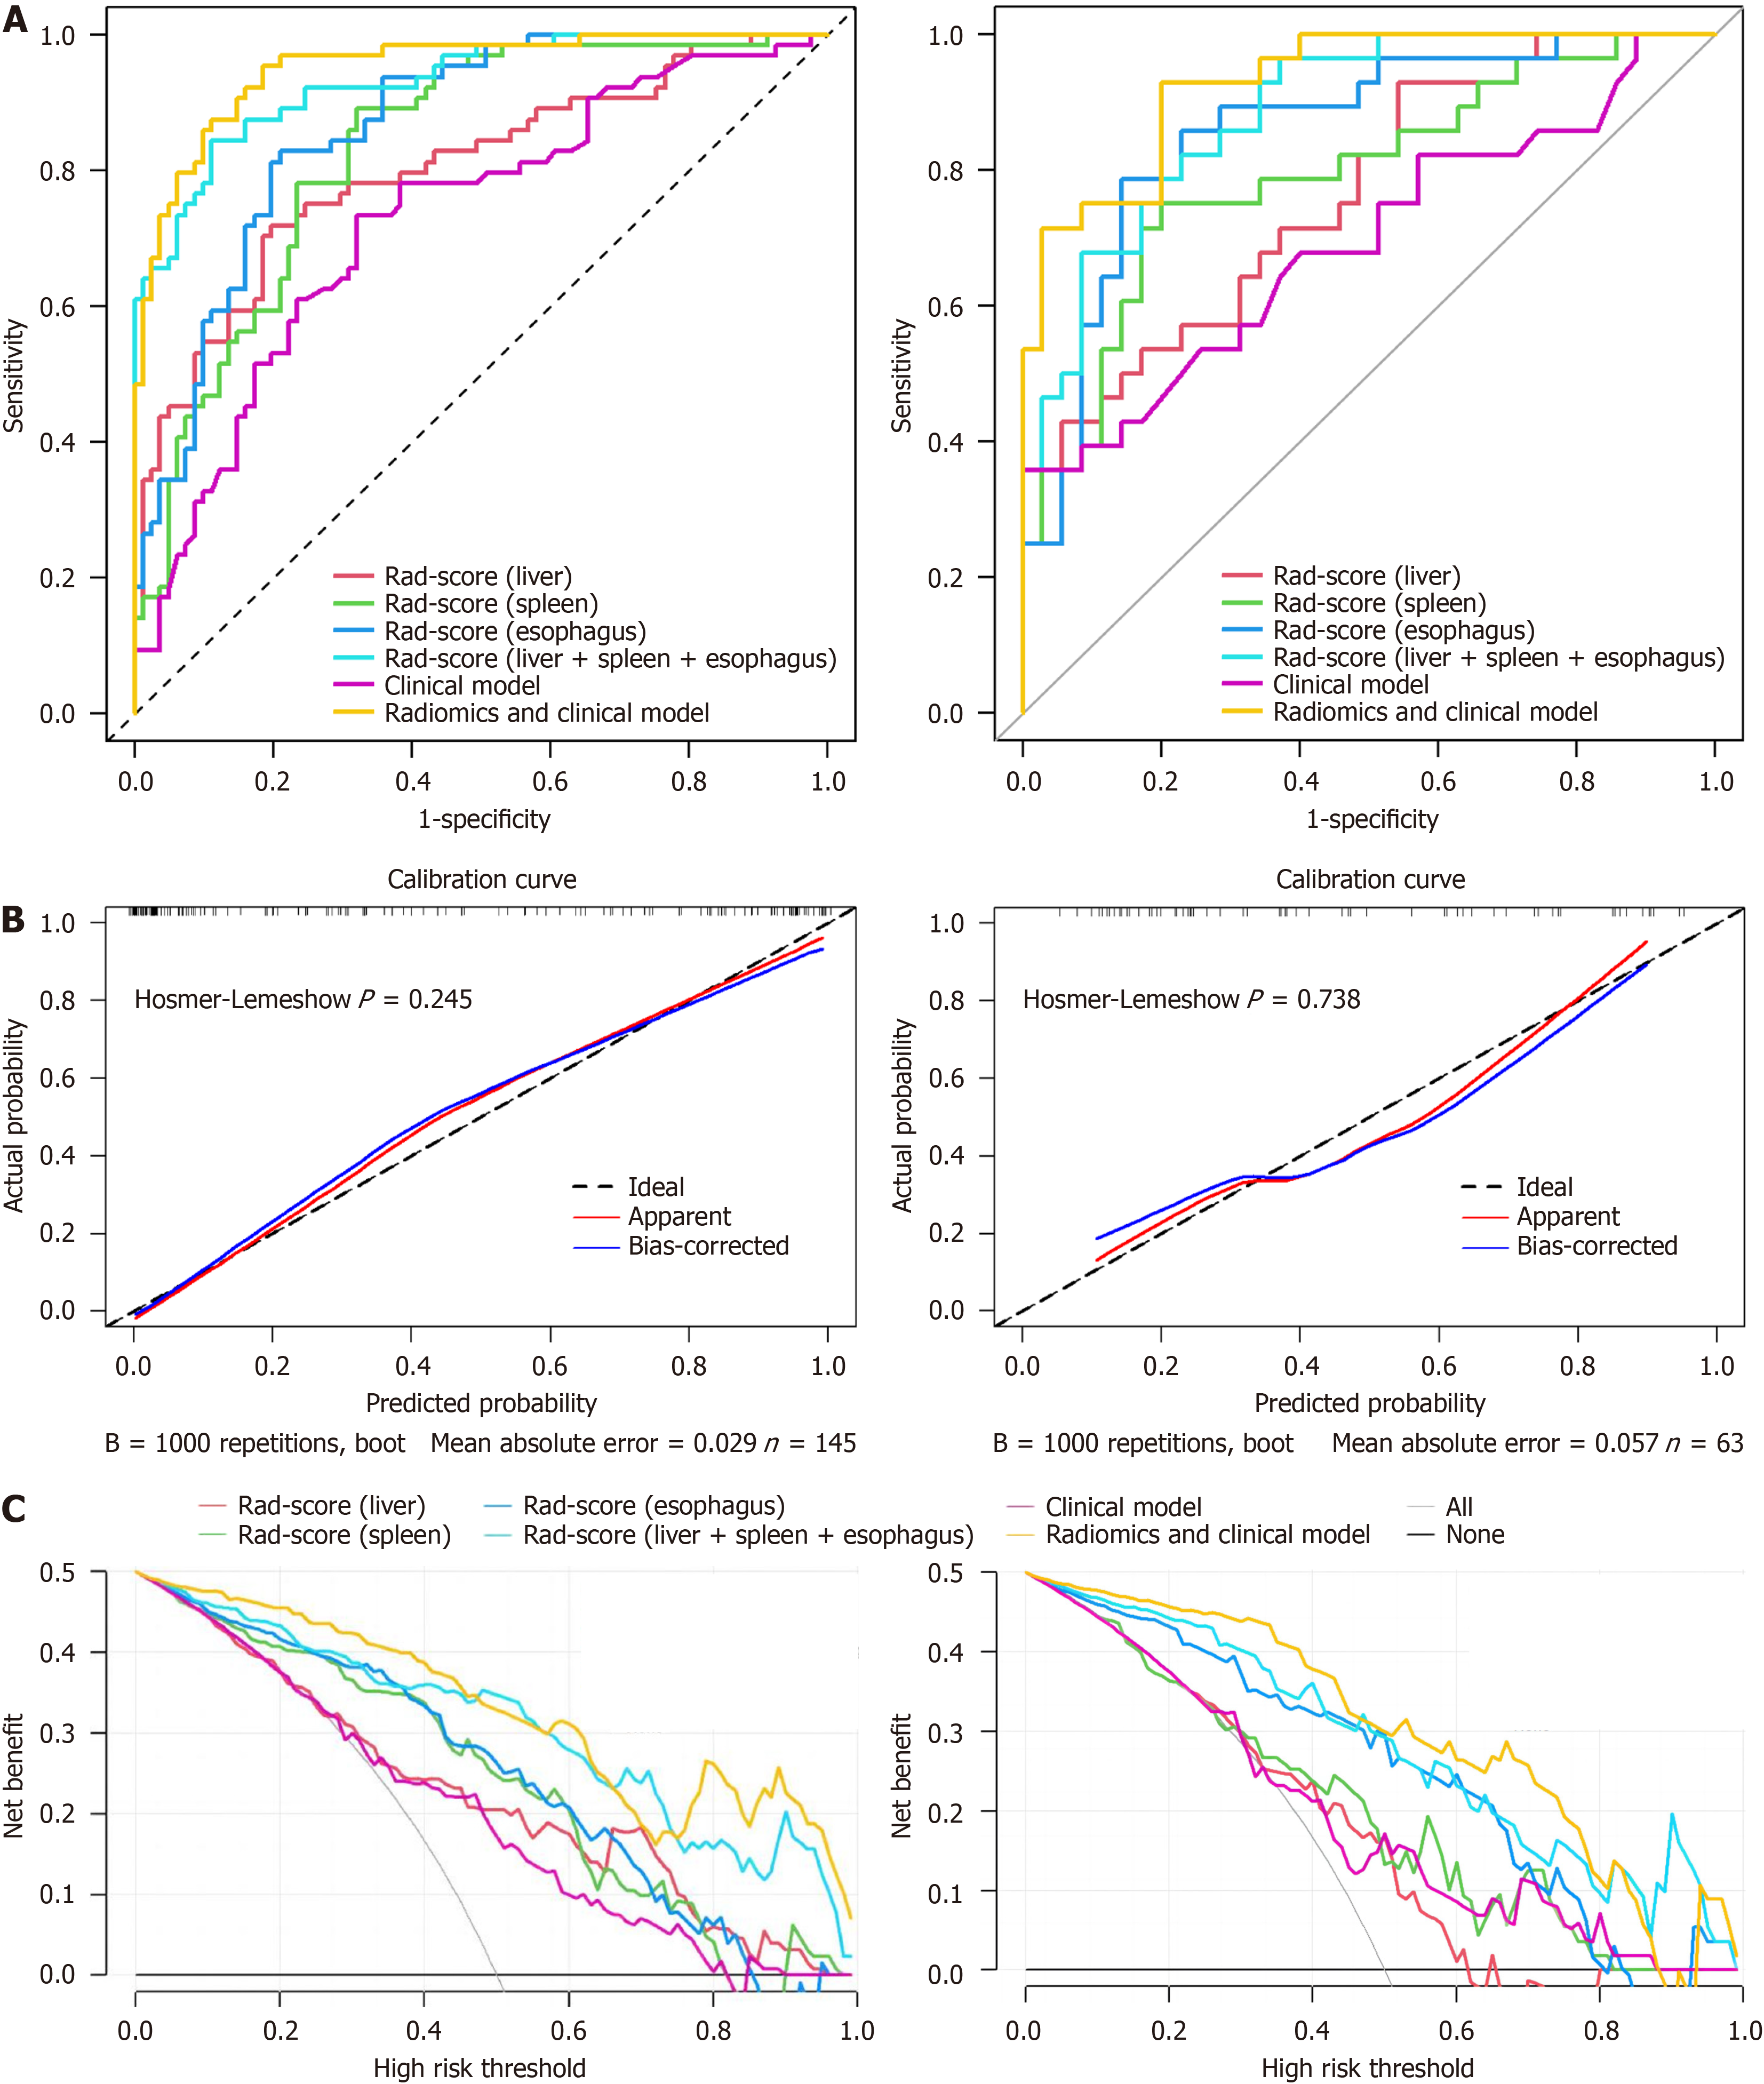
Figure 5 Model construction and evaluation.
A: The receiver operating characteristic curves of each model in training (left) and validation (right) cohorts; B: The calibration curve of the radiomics-clinical model in training (left) and validation (right) cohorts; C: The decision curves of each model in training (left) and validation (right) cohorts.
- Citation: Peng YJ, Liu X, Liu Y, Tang X, Zhao QP, Du Y. Computed tomography-based multi-organ radiomics nomogram model for predicting the risk of esophagogastric variceal bleeding in cirrhosis. World J Gastroenterol 2024; 30(36): 4044-4056
- URL: https://www.wjgnet.com/1007-9327/full/v30/i36/4044.htm
- DOI: https://dx.doi.org/10.3748/wjg.v30.i36.4044


