Copyright
©The Author(s) 2024.
World J Gastroenterol. Jun 28, 2024; 30(24): 3086-3105
Published online Jun 28, 2024. doi: 10.3748/wjg.v30.i24.3086
Published online Jun 28, 2024. doi: 10.3748/wjg.v30.i24.3086
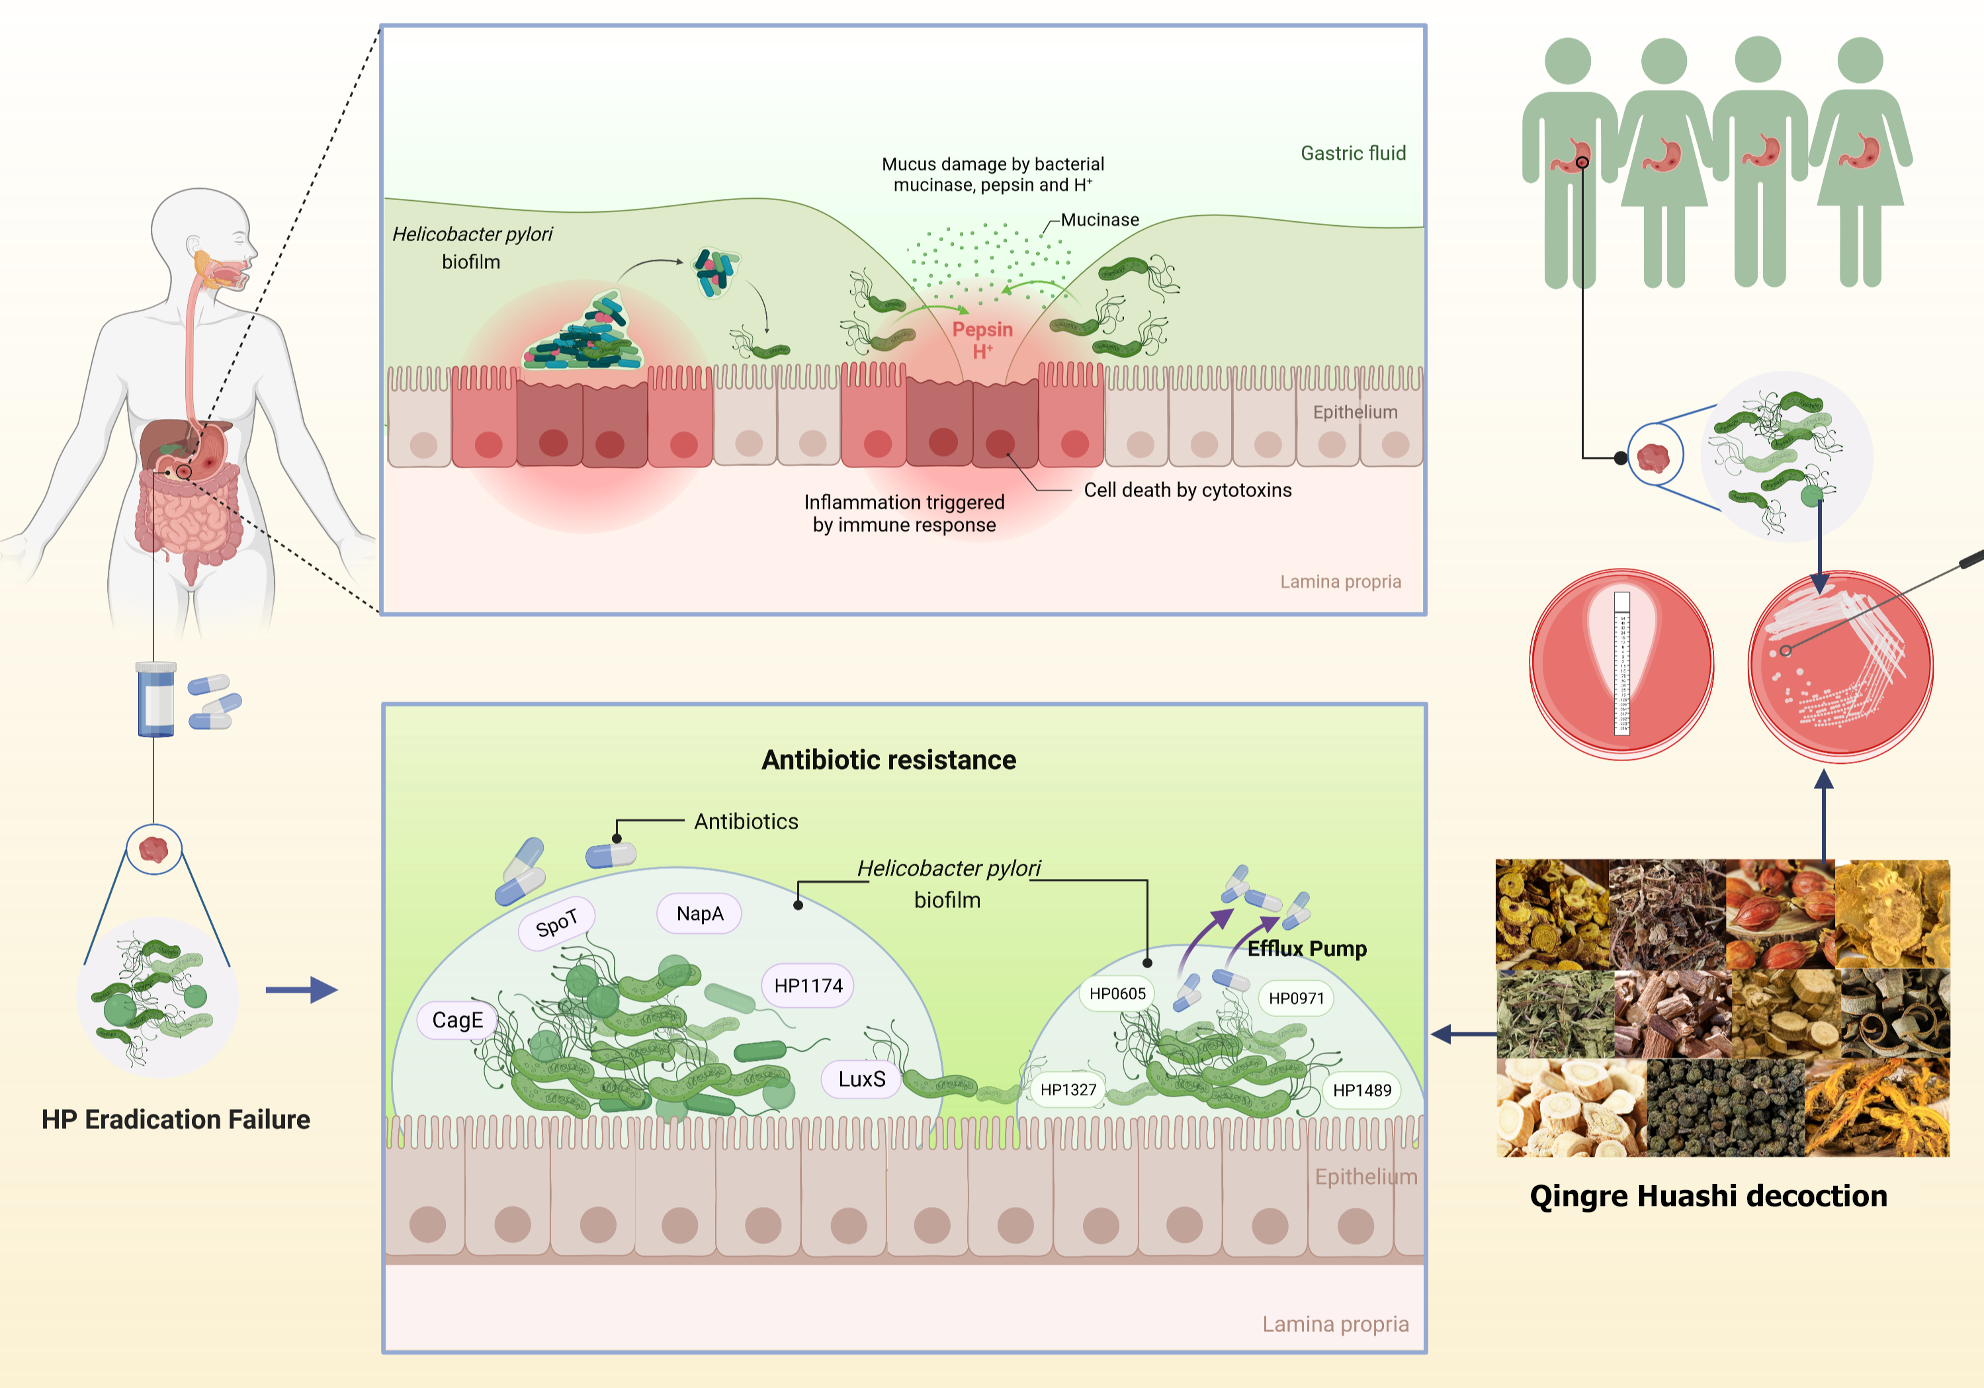
Figure 1 Experimental technical route.
HP: Helicobacter pylori.
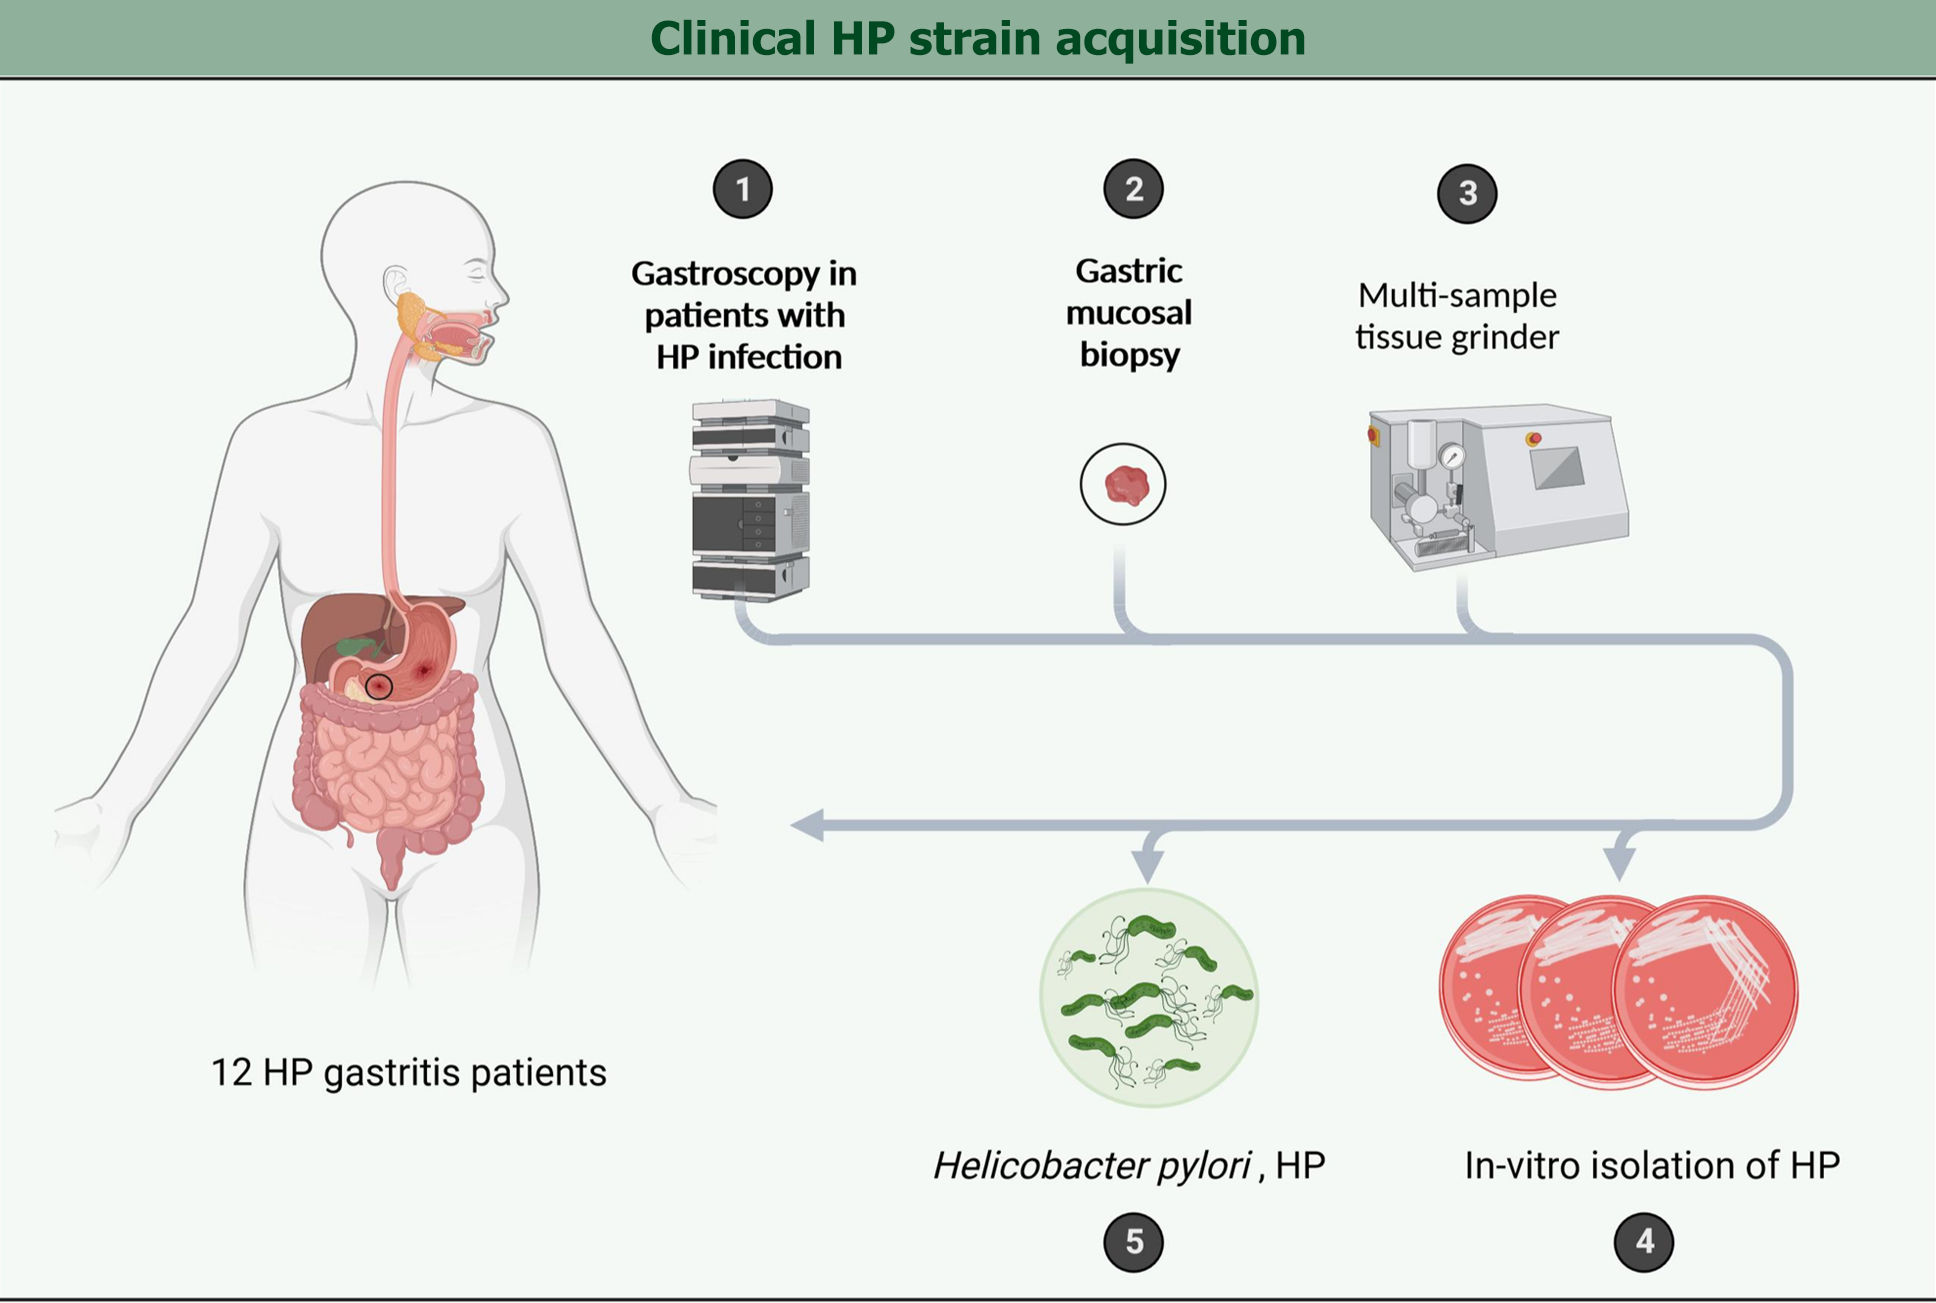
Figure 2 Clinical Helicobacter pylori strain acquisition.
HP: Helicobacter pylori.
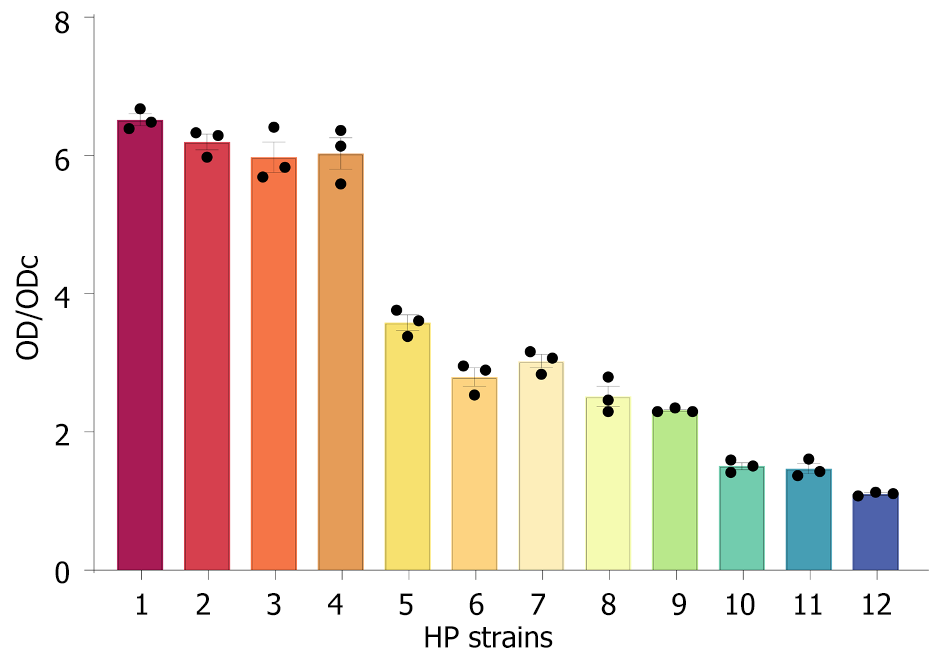
Figure 3 Biofilm formation of 12 clinical strains in vitro.
Strains 1-4 were classified as strong biofilm-forming Helicobacter pylori (HP), strains 5-9 as moderate biofilm-forming HP, and strains 10-12 as weak biofilm-forming HP. HP: Helicobacter pylori; OD: Optical density; ODc: Optical density cut-off value.
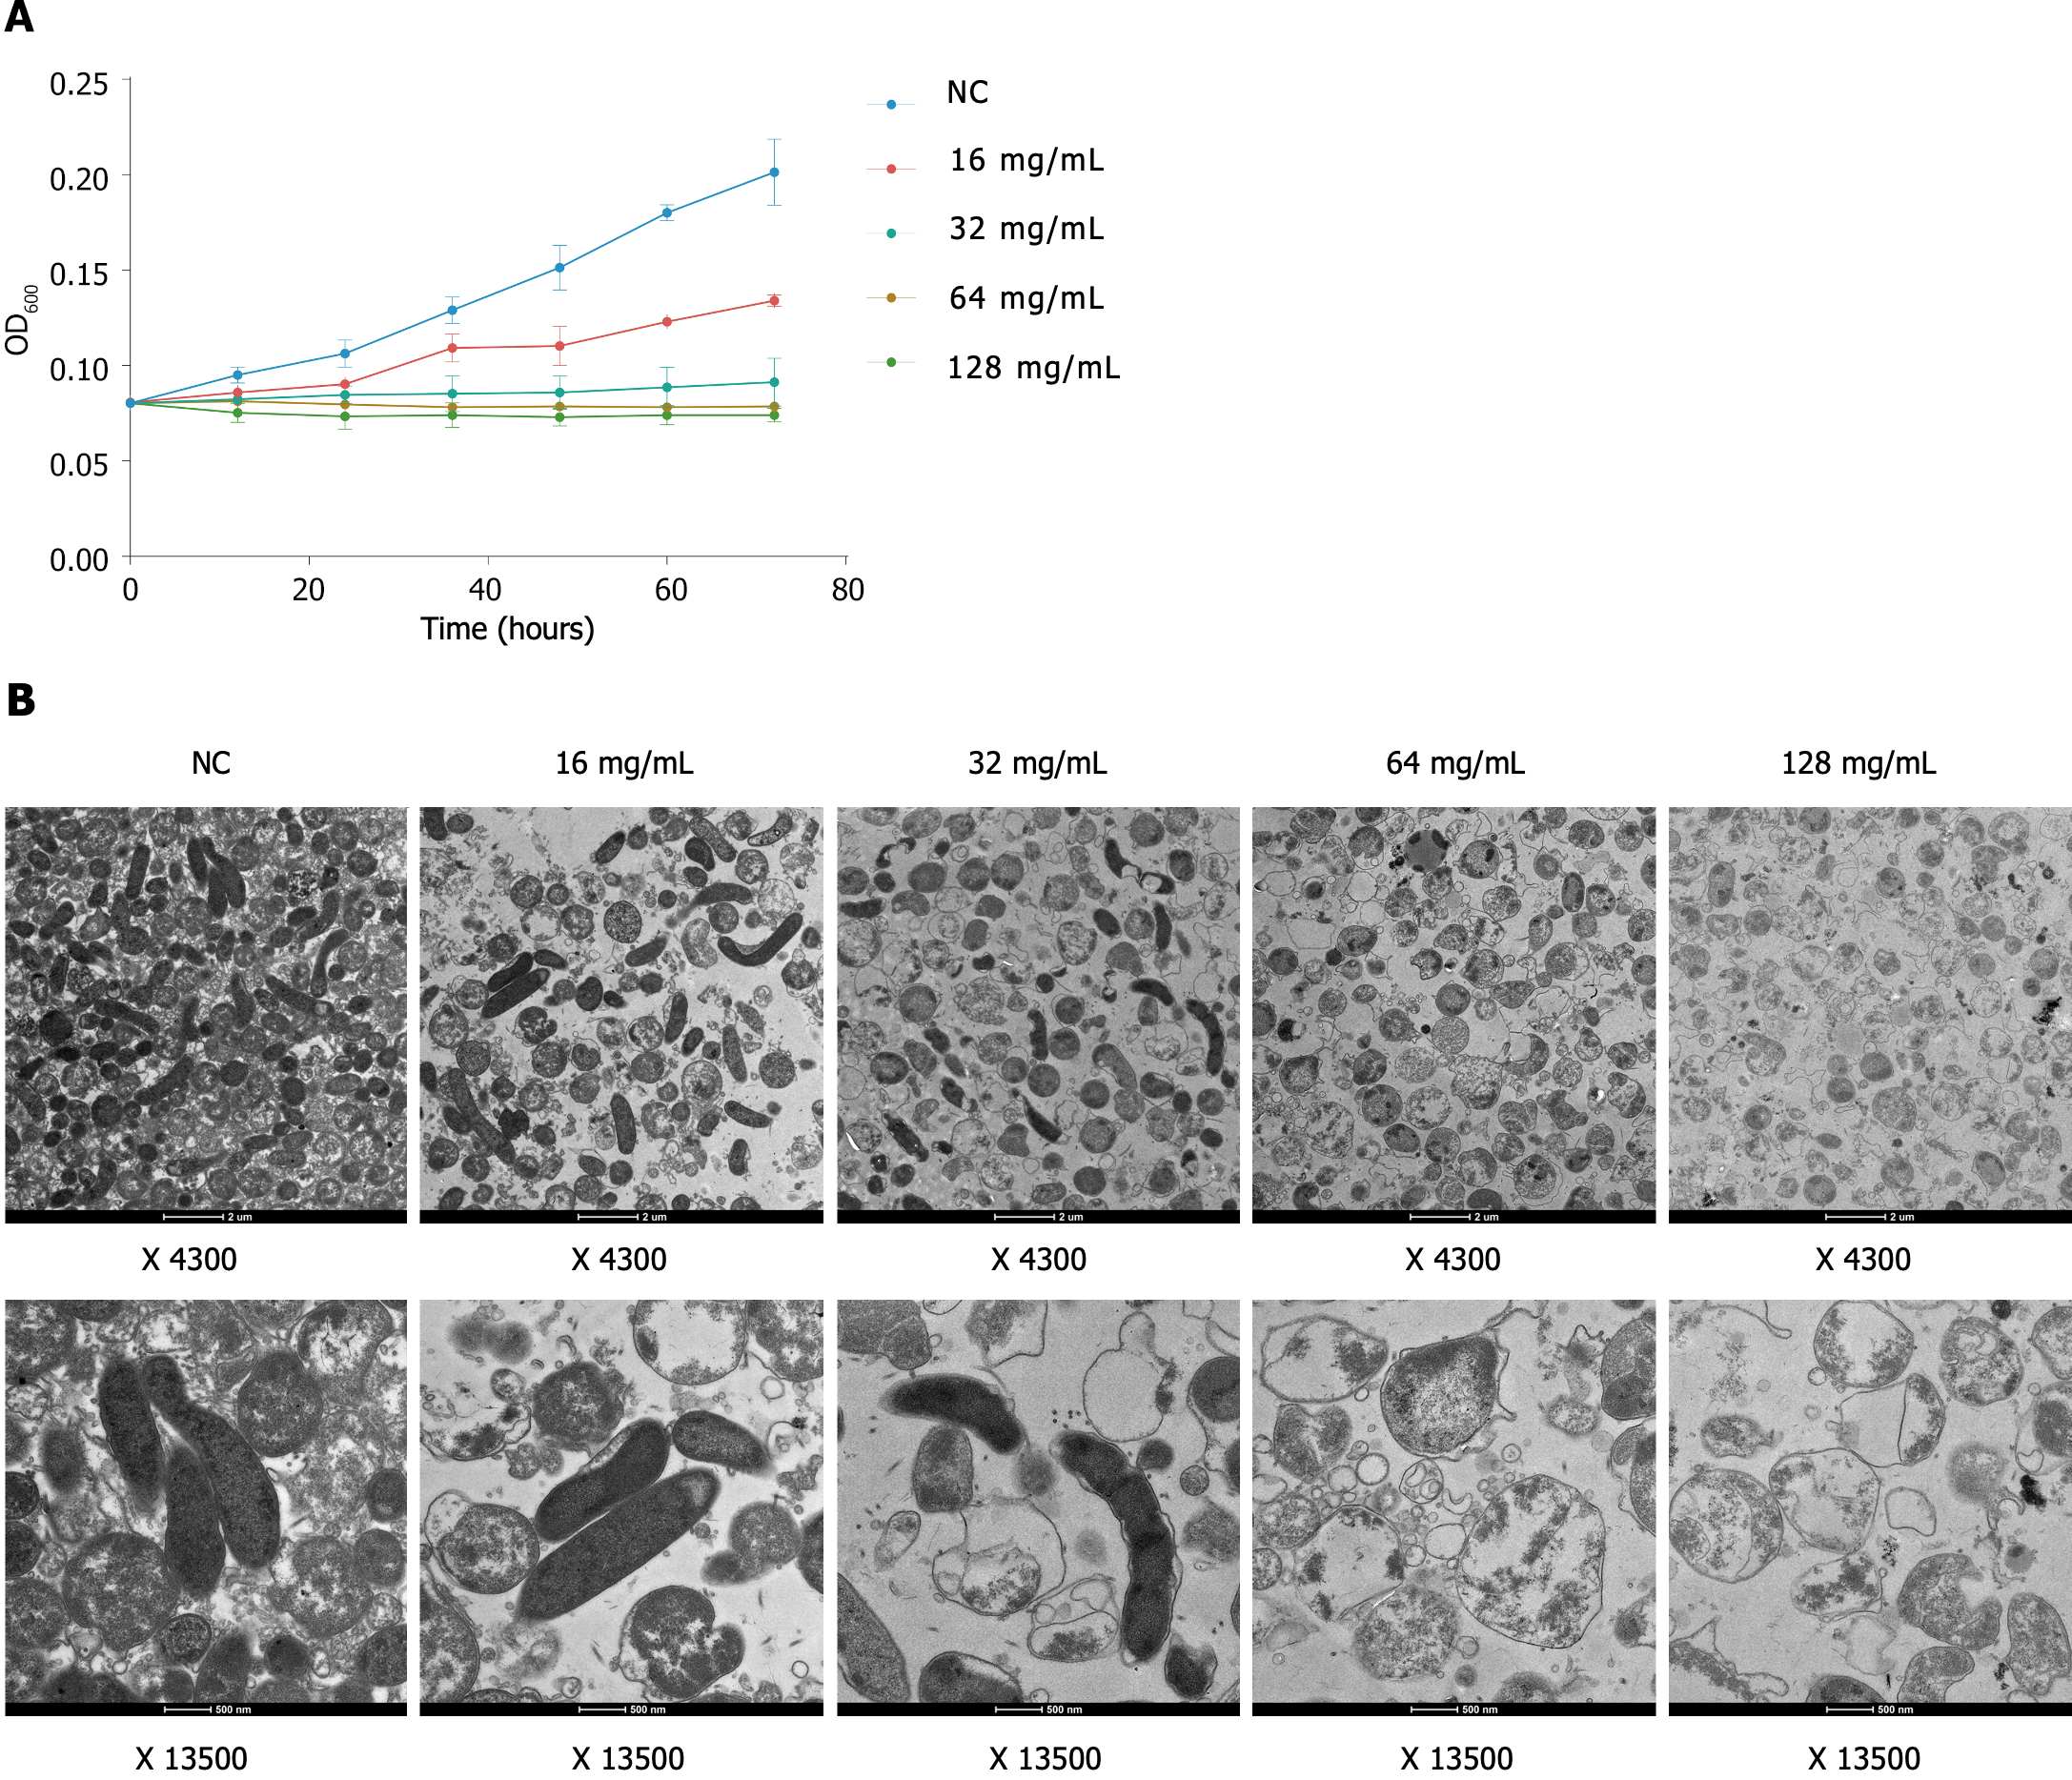
Figure 4 Bacteriostatic and bactericidal effects of Qingre Huashi decoction on Helicobacter pylori.
A: Inhibitory kinetics show that Qingre Huashi decoction (QHD) inhibited the growth of Helicobacter pylori (HP) in a time- and dose-dependent manner. At a concentration of 16 mg/mL (1/4 MIC), QHD significantly inhibited the growth of HP. After intervention with QHD at concentrations of 32 mg/mL (1/2 MIC) and 64 mg/mL (MIC), no significant increase was found in the concentration of HP in the liquid culture medium, indicating that HP did not grow under these conditions; B: Transmission electron microscopy showing that the cell membranes of the five groups of HP exhibited varying degrees of differences, which indicated different levels of damage. OD: Optical density.
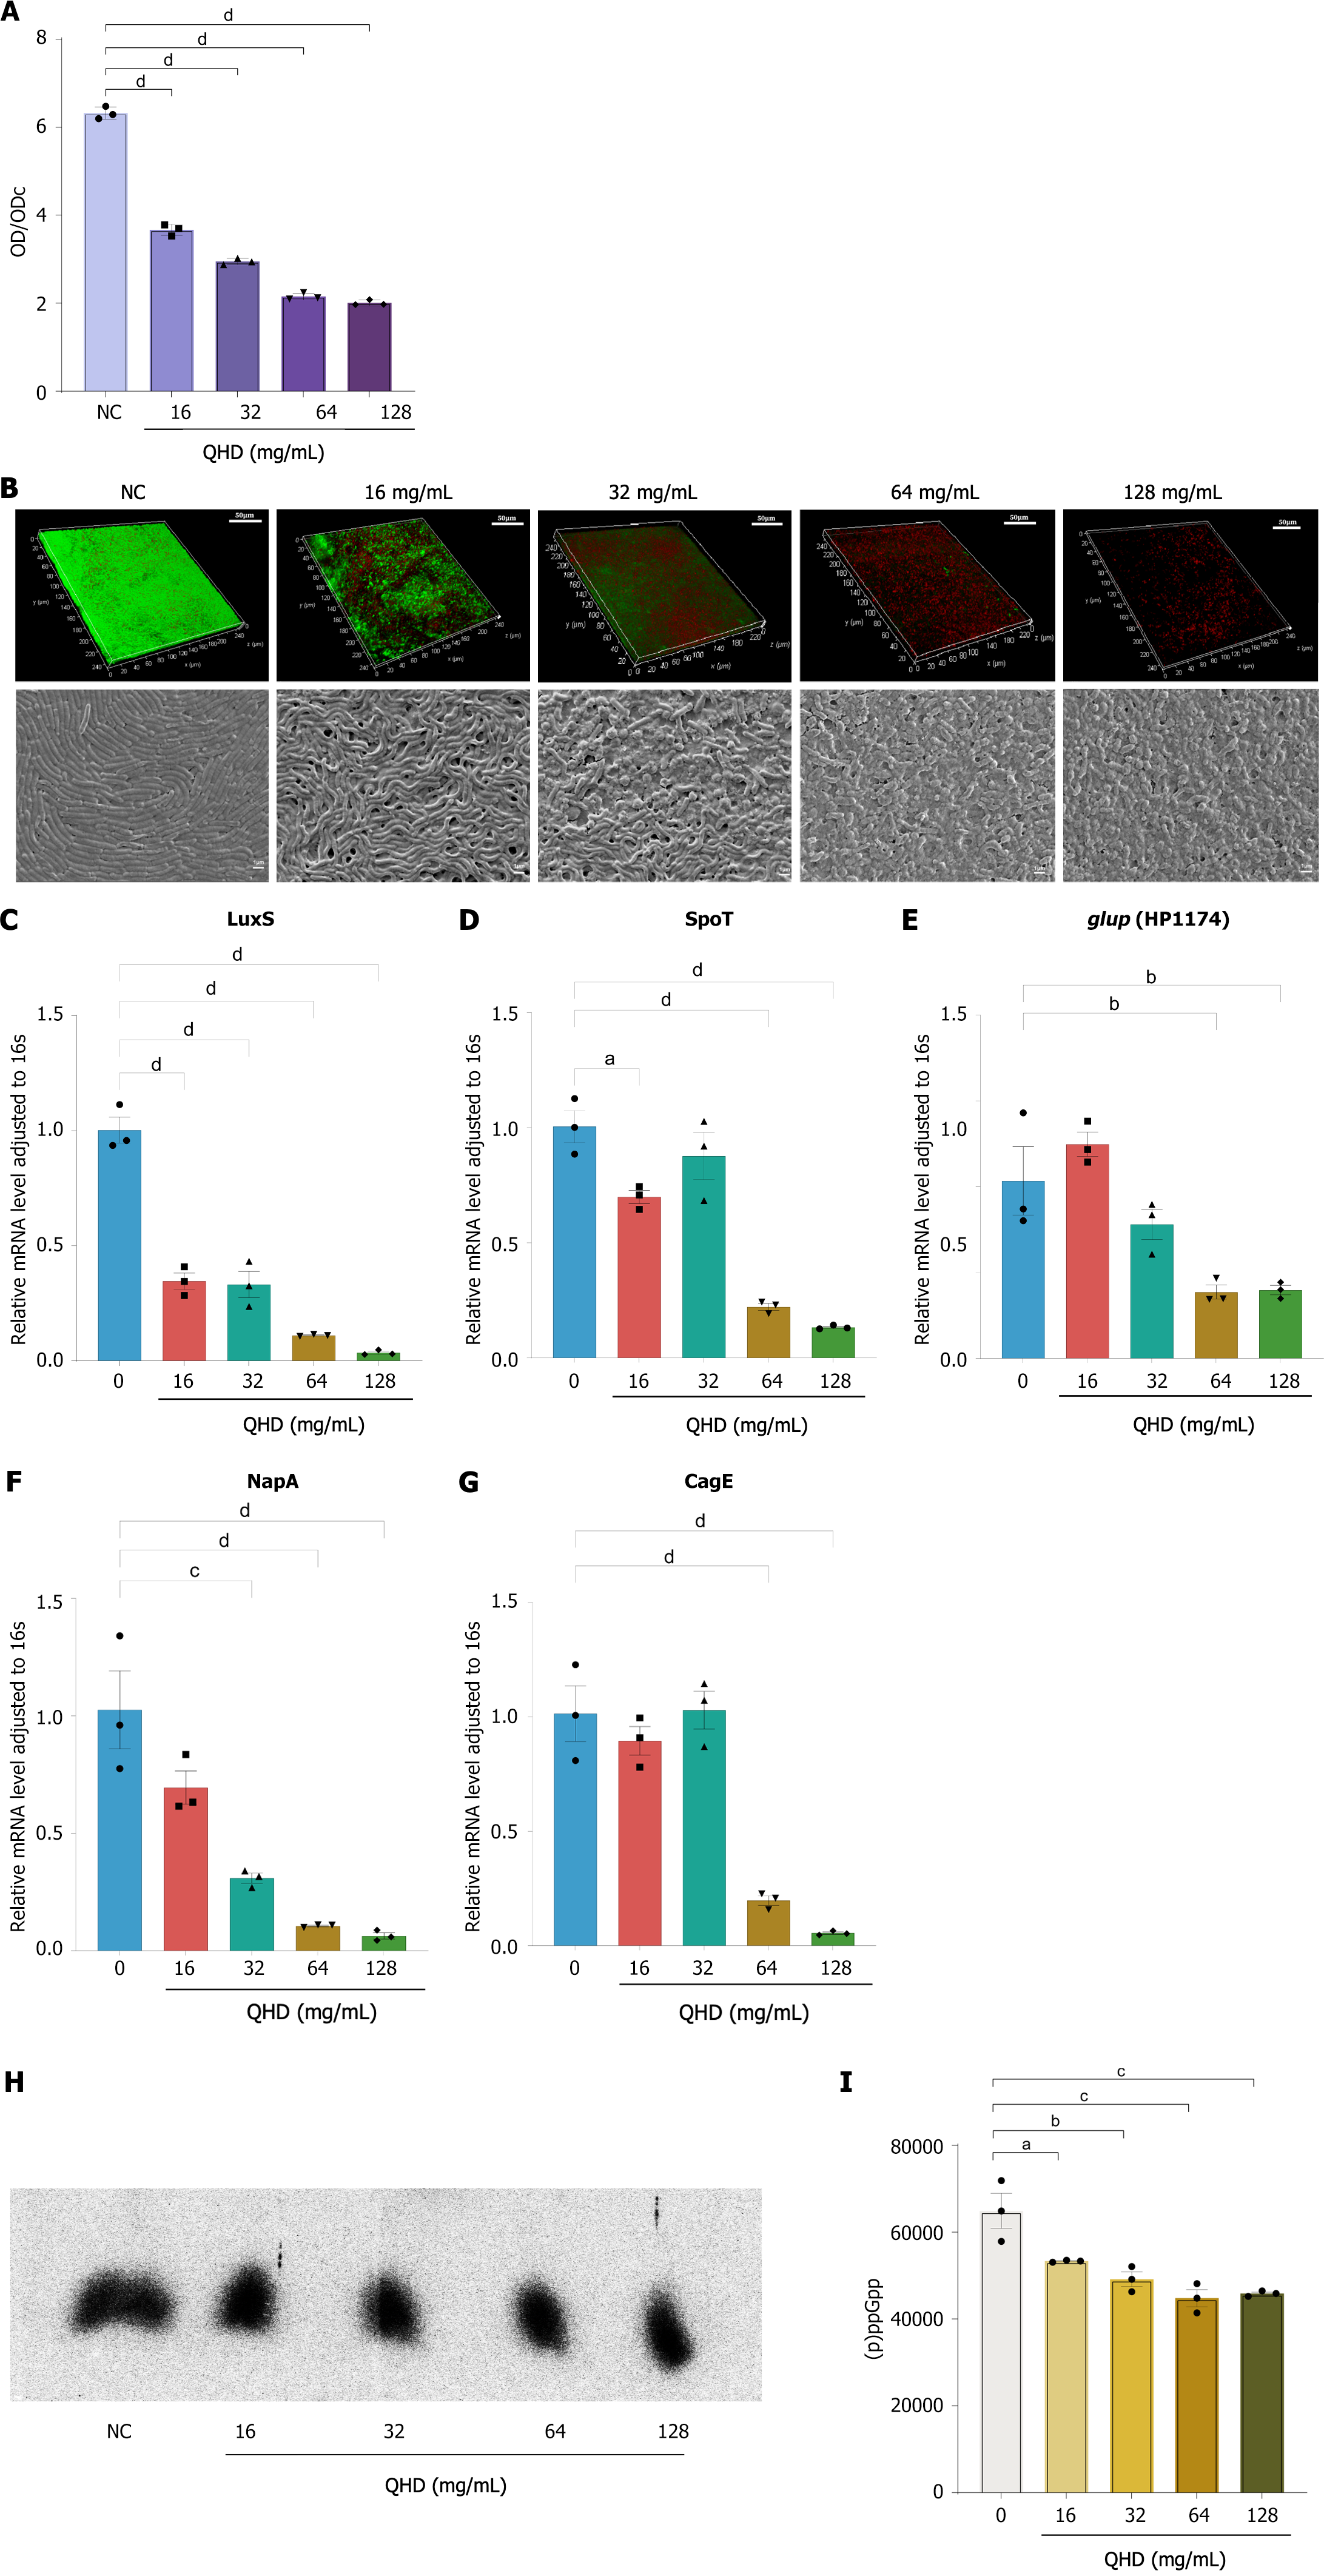
Figure 5 Qingre Huashi decoction inhibits and disrupts Helicobacter pylori biofilm formation in vitro.
A: Crystal violet staining indicated that Qingre Huashi decoction (QHD) inhibited the in vitro biofilm formation of Helicobacter pylori (HP) (16-128 mg/mL) in a concentration-dependent manner, with significant inhibition observed at a concentration of 16 mg/mL (1/4 MIC); B: CLSM analysis revealed that Strain 1 exhibited strong viability and significant bacterial activity in vitro, causing the formation of a dense biofilm. Treatment with various concentrations (16-128 mg/mL) of QHD resulted in a significant decrease in the viability of HP, reduced activity, and the formation of biofilms that were thinner and less tightly structured. Based on scanning electron microscopy, the NC group exemplified the typical biofilm arrangement of HP in a laboratory setting, characterized by predominantly rod-shaped bacteria that were densely and closely packed, which could form a cohesive biofilm matrix. After the administration of QHD, the attachment of bacteria to the biofilm was weakened, and the structure of the biofilm became fragmented, displaying multiple empty spaces; C-G: Expression levels of biofilm-related genes LuxS, NapA, Spot, HP1174, and CagE examined by quantitative real-time polymerase chain reaction before and after QHD intervention. The results found that QHD could inhibit the expression of these biofilm-related genes, thereby affecting the formation of biofilms; H and I: 32P-labeled nucleotides in HP detected by thin-layer chromatography after drug intervention. QHD significantly inhibited HP (p)ppGpp molecule expression. QHD: Qingre Huashi decoction; OD: Optical density; SEM: Scanning electron microscopy. aP < 0.05; bP < 0.01; cP < 0.001; dP < 0.0001.
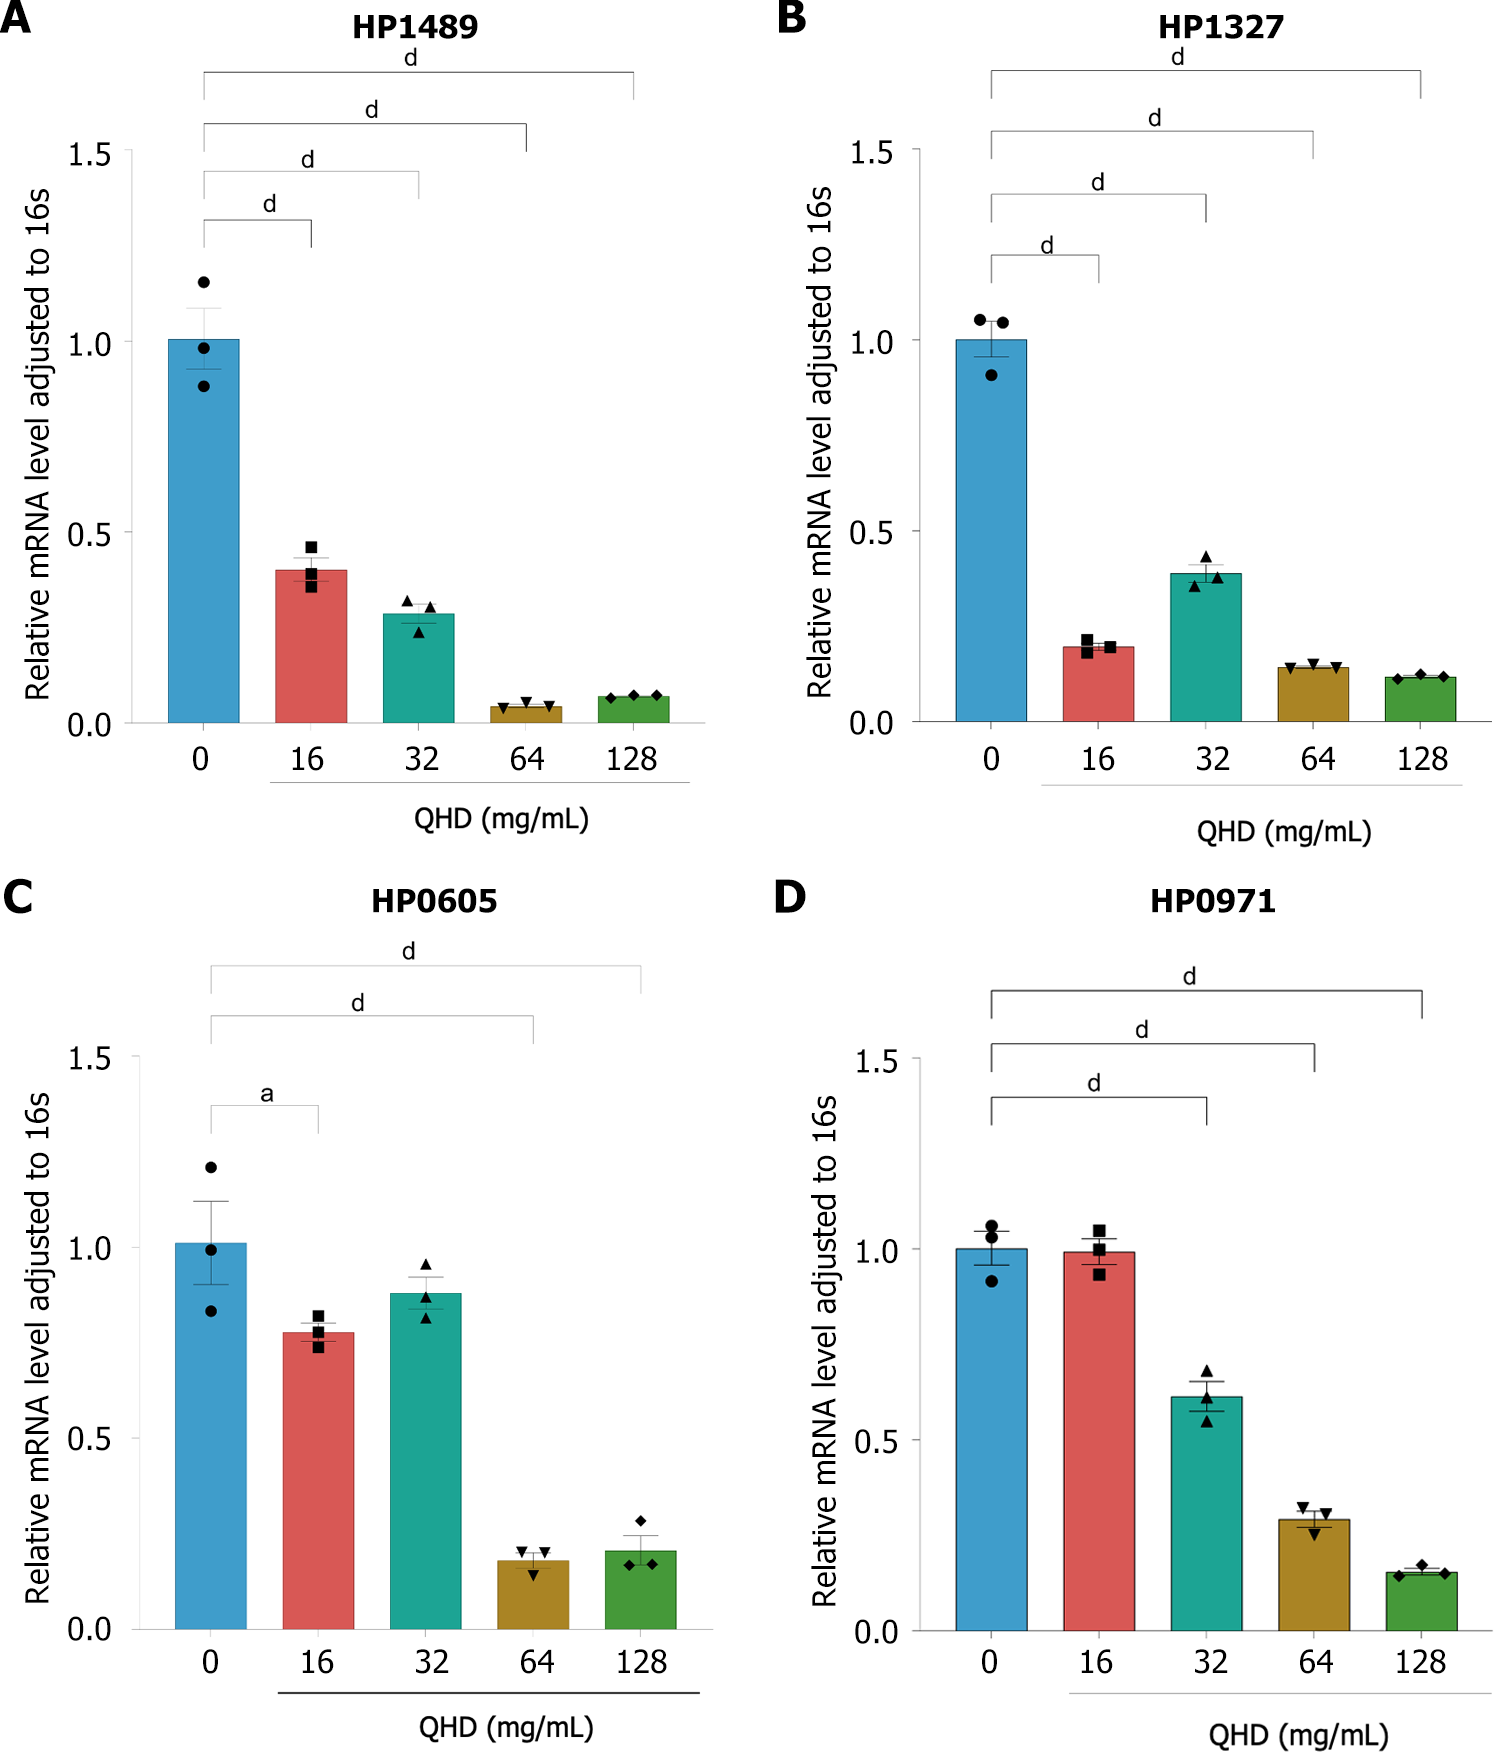
Figure 6 Qingre Huashi decoction inhibits expression of Helicobacter pylori efflux pump-related genes in vitro.
The expression levels of efflux pump-related genes were examined by quantitative real-time polymerase chain reaction before and after Qingre Huashi decoction (QHD) intervention. The results suggested that QHD could inhibit the expression of these efflux pump-related genes. A: HP1489; B: HP1327; C: HP0971; D: HP0605. aP < 0.05; bP < 0.01; cP < 0.001; dP < 0.0001.
Figure 7 Metabolic difference analysis and metabolomic pathway enrichment analysis for Qingre Huashi decoction vs NC.
A: Classification of metabolites; B: OPLS-DA analysis revealed that the samples from the NC group and Qingre Huashi decoction (QHD) group exhibited distinct clustering patterns; C: Number of differential metabolites between the QHD group and NC group; D: QHD vs NC. Red dots represent significantly upregulated differential metabolites [P < 0.05, variable importance in projection (VIP) > 1 and FC > 1], blue dots refer to significantly downregulated differential metabolites (P < 0.05, VIP > 1 and FC < 1), and gray dots stand for metabolites with no significant difference. Each dot in the plot represents a metabolite, with the x-axis showing the log2 (FC) values of the comparison between the two groups, and the y-axis representing the -log10 (P value) values; E: Hierarchical clustering of all significantly differentially expressed metabolites and top 50 differentially expressed metabolites ranked by VIP. The horizontal axis represents sample names, while the vertical axis indicates differential metabolites. The color gradient from blue to red indicates the abundance of metabolite expression, with red showing higher expression levels of differential metabolites; F-H: KEGG pathway enrichment analysis on differentially expressed metabolites. The x-axis represents the -log10 P-value for each pathway, the y-axis stands for different pathway names, and the numbers on the bars indicate the number of differentially expressed metabolites annotated to that pathway.
- Citation: Lin MM, Yang SS, Huang QY, Cui GH, Jia XF, Yang Y, Shi ZM, Ye H, Zhang XZ. Effect and mechanism of Qingre Huashi decoction on drug-resistant Helicobacter pylori. World J Gastroenterol 2024; 30(24): 3086-3105
- URL: https://www.wjgnet.com/1007-9327/full/v30/i24/3086.htm
- DOI: https://dx.doi.org/10.3748/wjg.v30.i24.3086


