Copyright
©The Author(s) 2024.
World J Gastroenterol. Mar 14, 2024; 30(10): 1358-1367
Published online Mar 14, 2024. doi: 10.3748/wjg.v30.i10.1358
Published online Mar 14, 2024. doi: 10.3748/wjg.v30.i10.1358
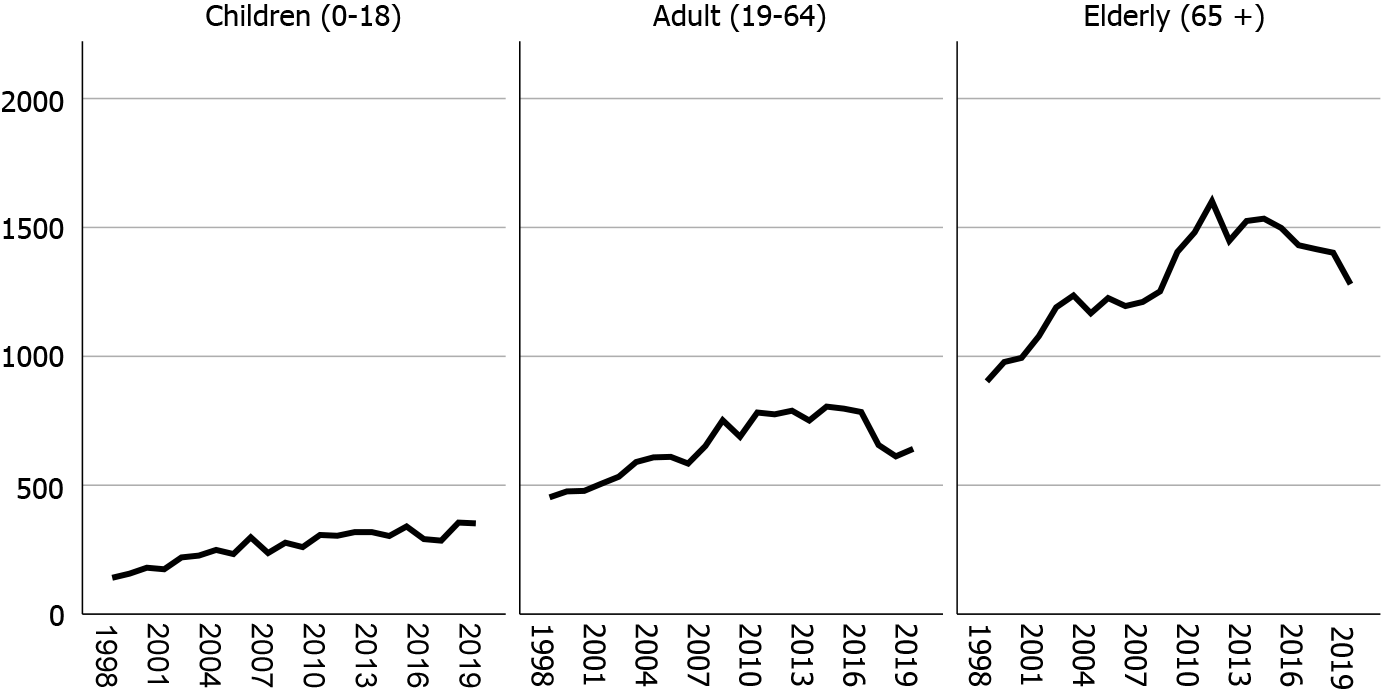
Figure 1 Total number of gastrostomies by year and age group.
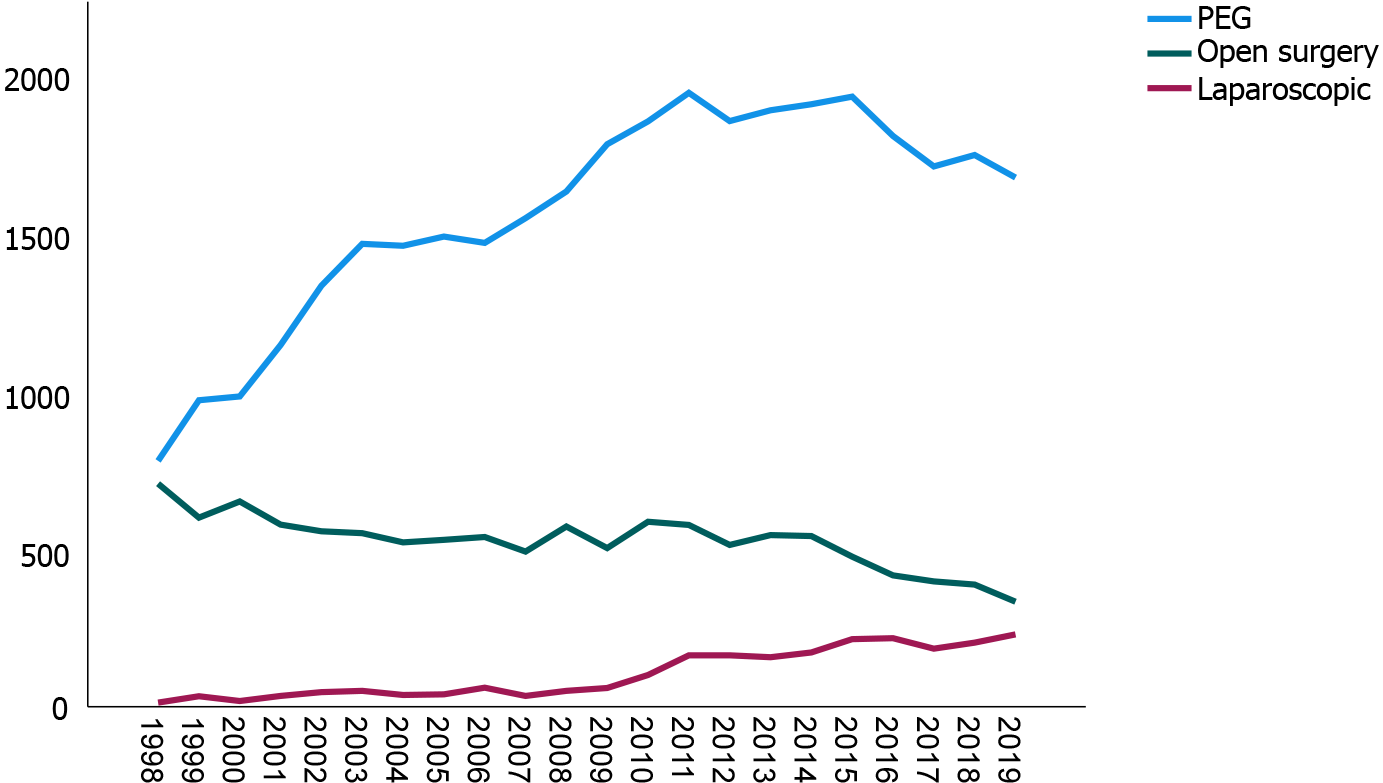
Figure 2 Time trends for different types of gastrostomies (total number by year).
PEG: Percutaneous endoscopic gastrostomy.
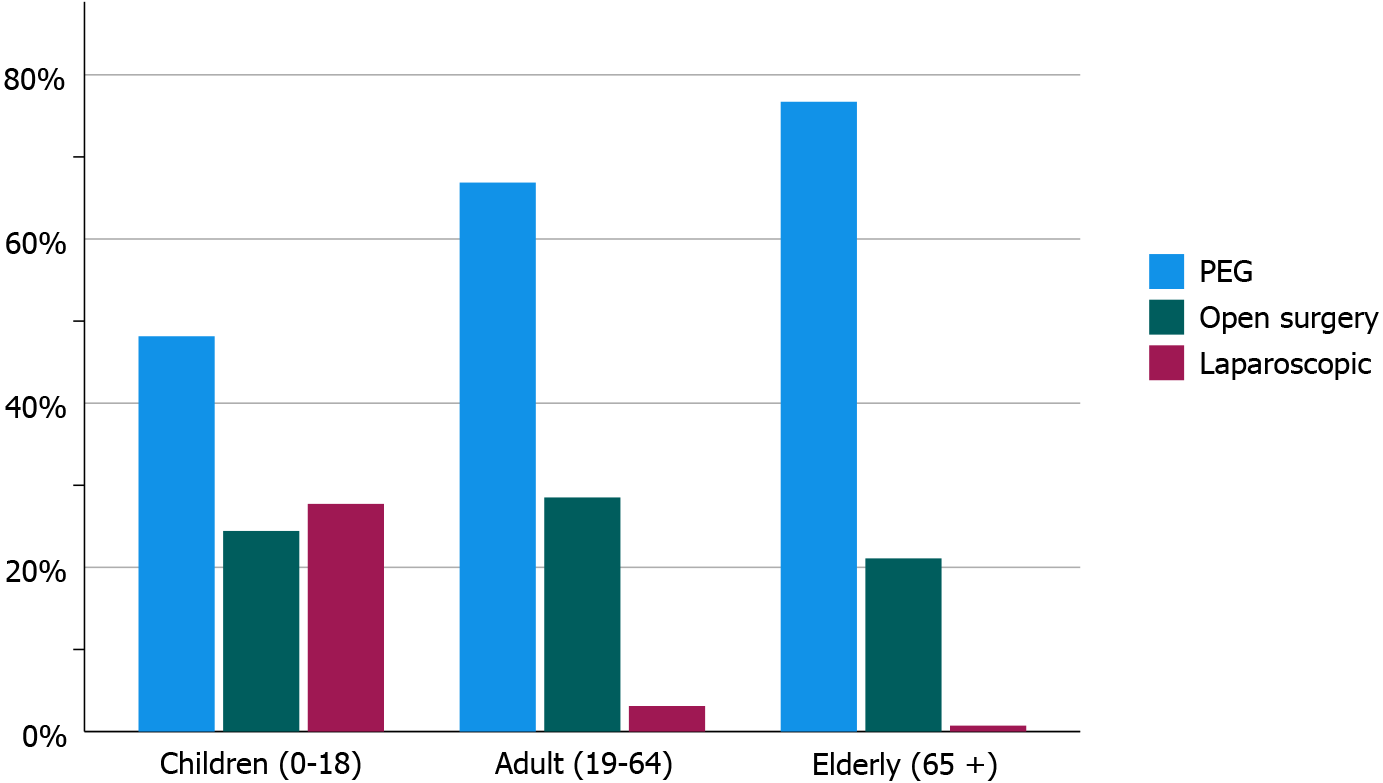
Figure 3 Type of gastrostomy by age group.
PEG: Percutaneous endoscopic gastrostomy.
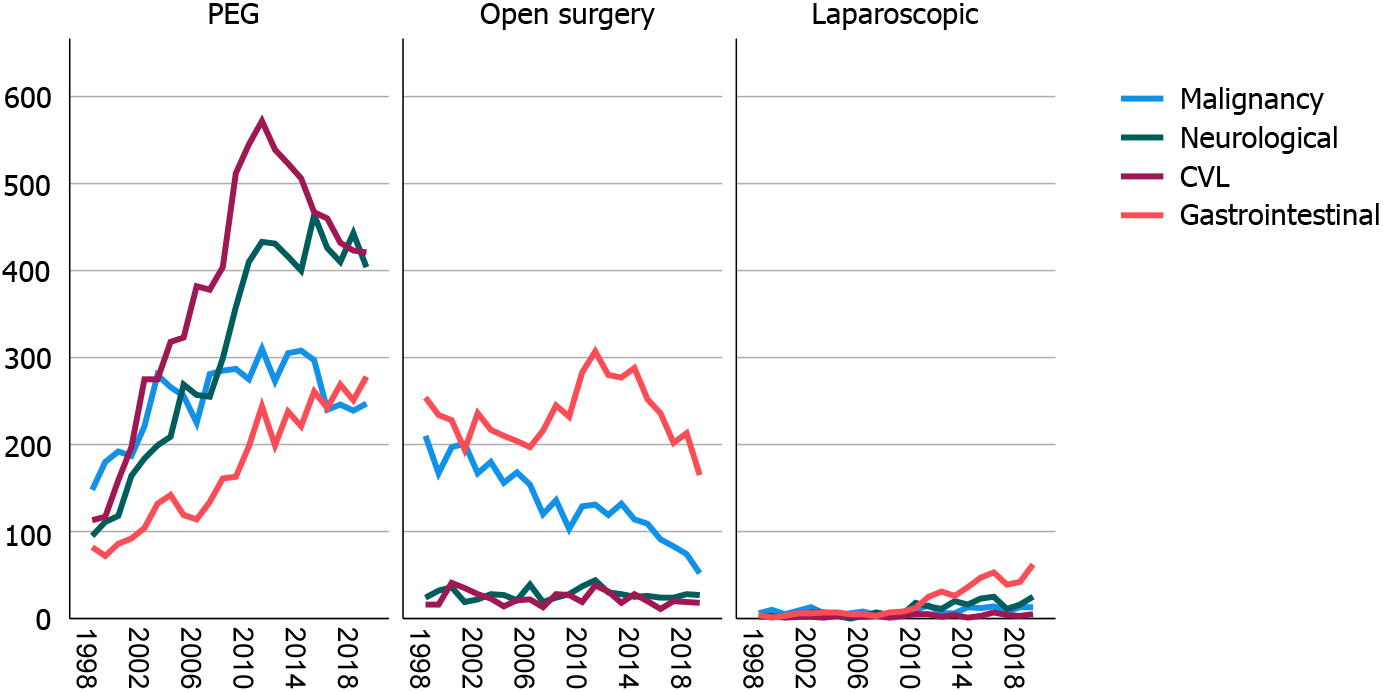
Figure 4 Time trends for different types of gastrostomies (total number by year) by indication.
CVL: Cerebrovascular lesions; PEG: Percutaneous endoscopic gastrostomy.
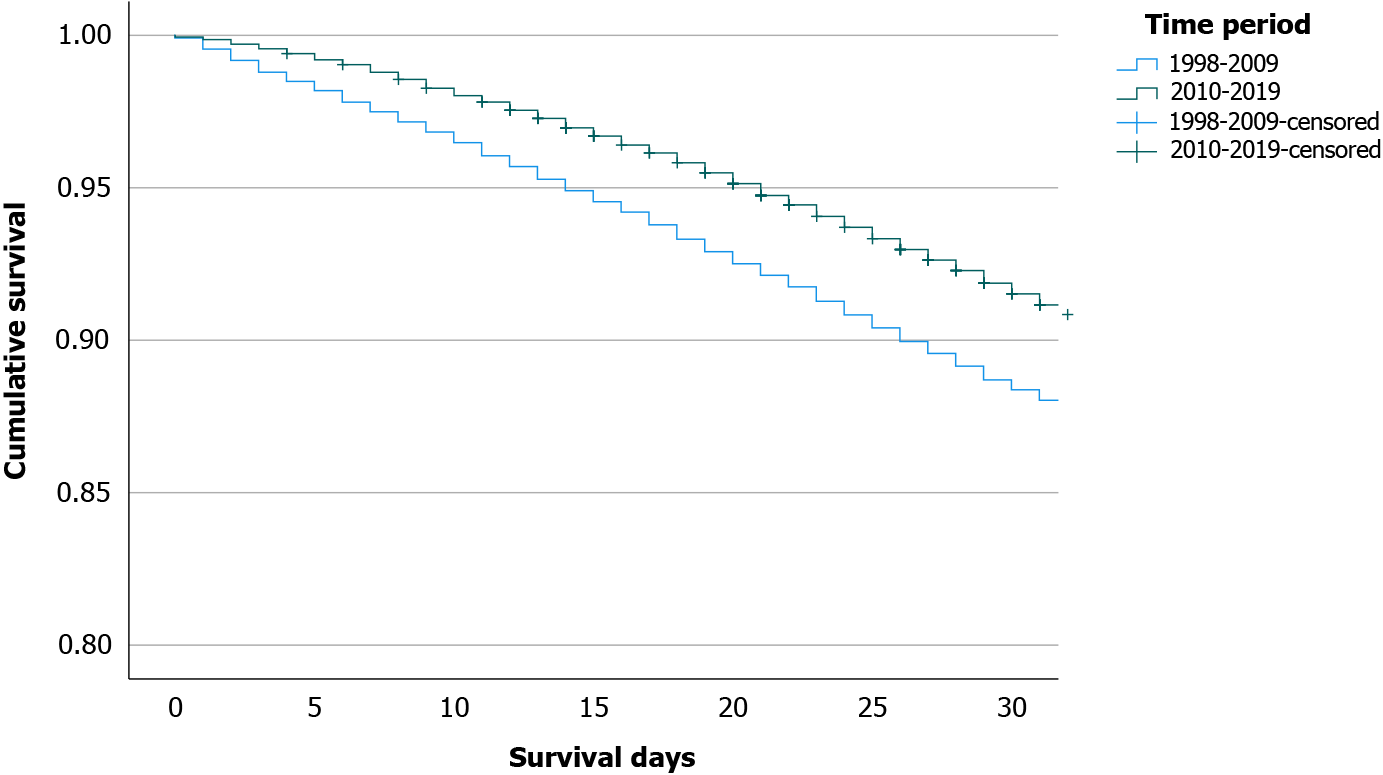
Figure 5 30-d cumulative survival during the early period (1998-2009) and late period (2010-2019).
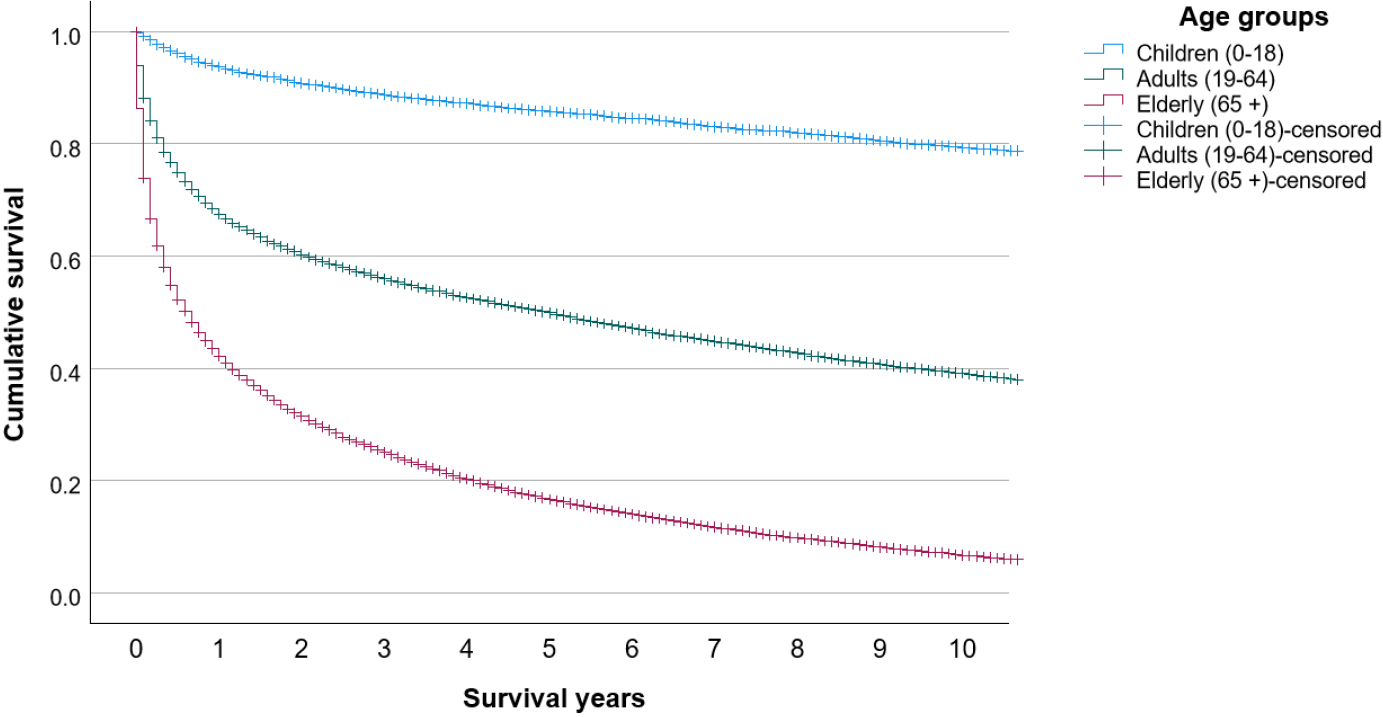
Figure 6 Cumulative overall survival in the three age groups.
- Citation: Skogar ML, Sundbom M. Time trends and outcomes of gastrostomy placement in a Swedish national cohort over two decades. World J Gastroenterol 2024; 30(10): 1358-1367
- URL: https://www.wjgnet.com/1007-9327/full/v30/i10/1358.htm
- DOI: https://dx.doi.org/10.3748/wjg.v30.i10.1358


