©The Author(s) 2023.
World J Gastroenterol. Apr 21, 2023; 29(15): 2310-2321
Published online Apr 21, 2023. doi: 10.3748/wjg.v29.i15.2310
Published online Apr 21, 2023. doi: 10.3748/wjg.v29.i15.2310
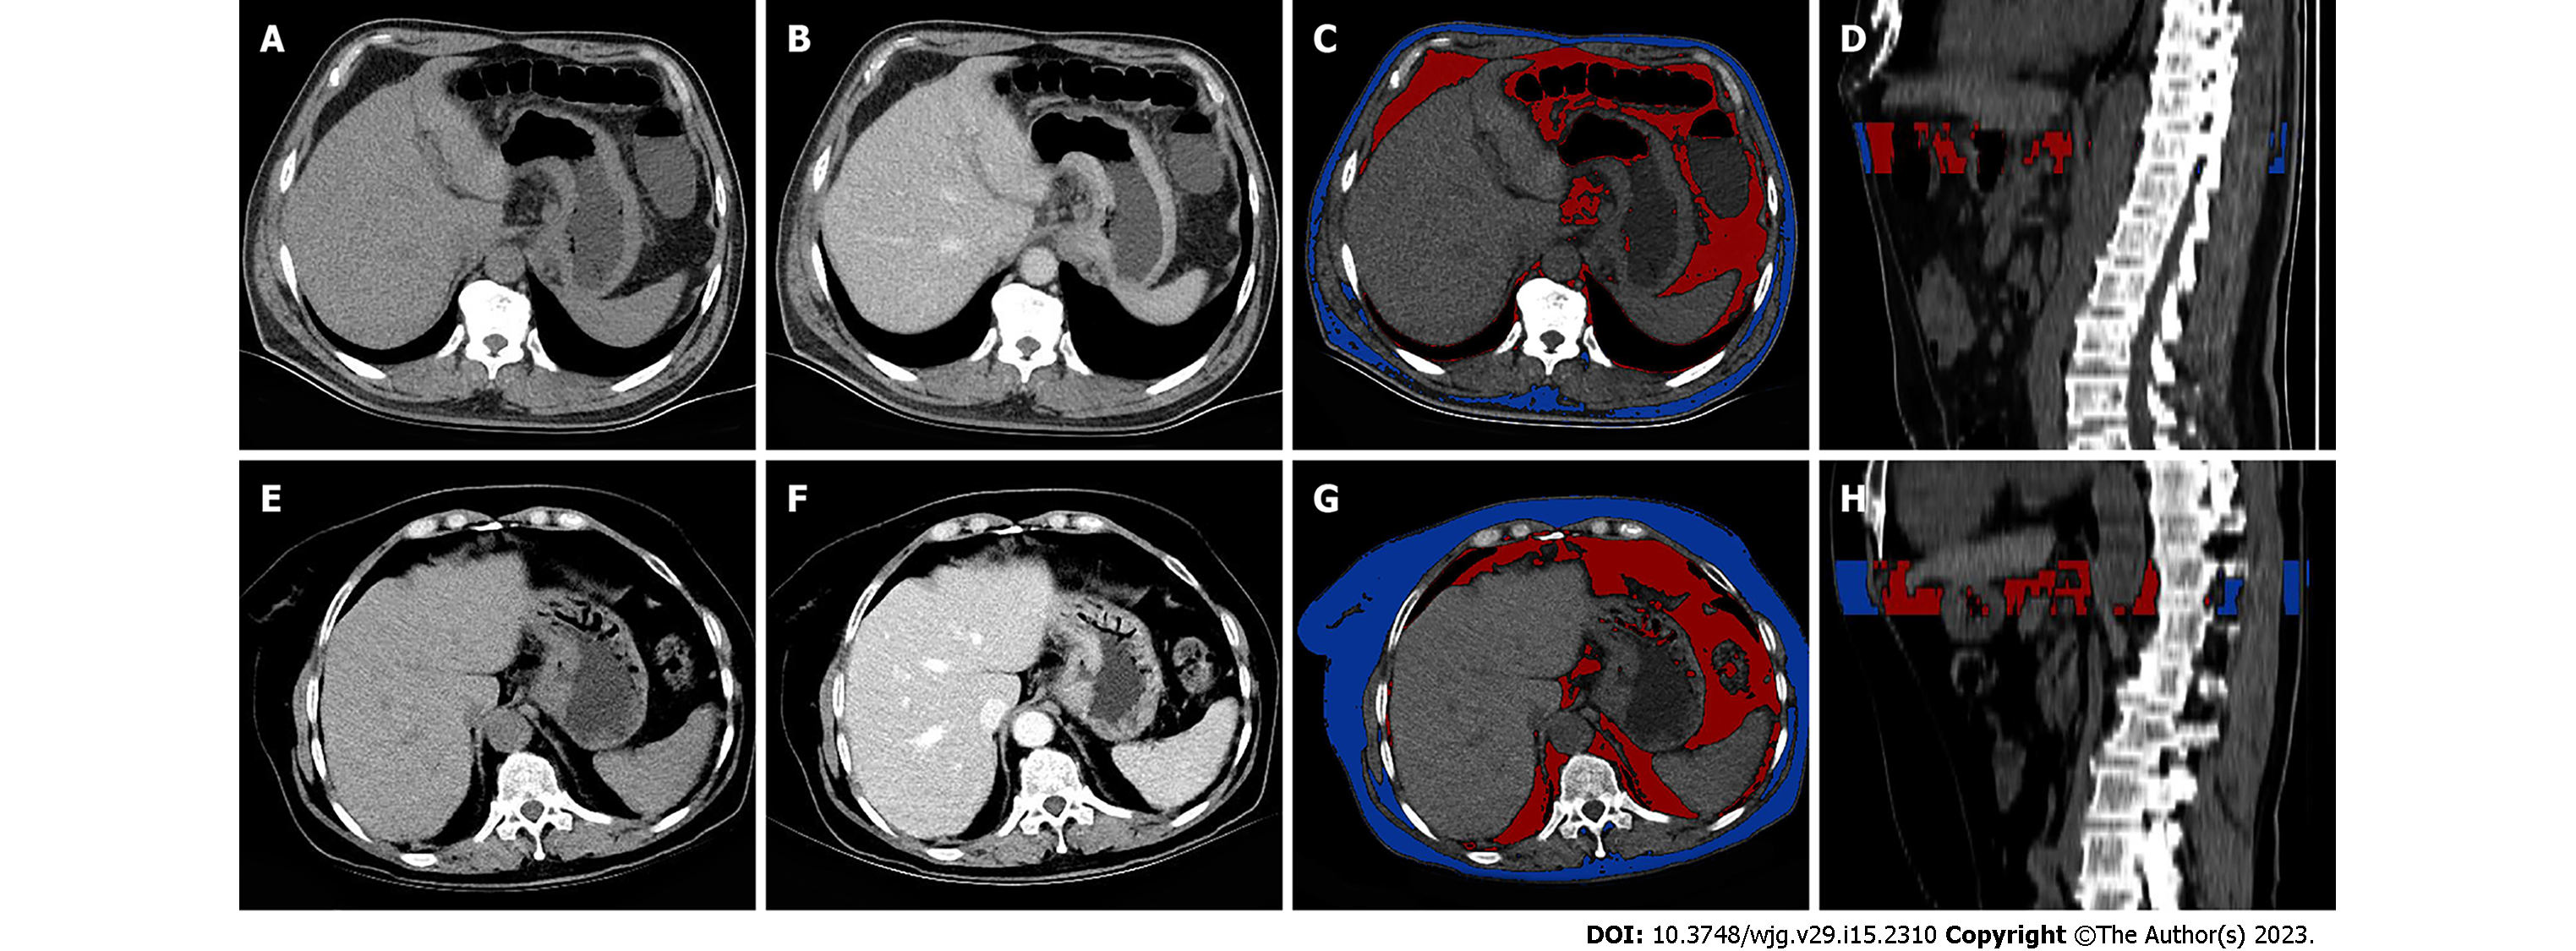
Figure 1 Determination of visceral fat parameters.
A-D: Detection of visceral fat (VF) parameters in a 54-year-old male patient with gastric cancer with peritoneal metastasis (PM); A and B: Axial unenhanced and venous computed tomography (CT) images showing wall thickening in the cardia and the lesser and greater curvatures of the stomach; C: Regions of interest (ROI) were drawn using a semiautomated technique. The red area represents VF, while the blue area represents subcutaneous fat (SF); D: Sagittal image showing a three-dimensional (3D) ROI, delineated starting from the maximal axial section of the tumor and extending 25 mm; E-H: Determination of VF parameters in a 66-year-old female patient with gastric cancer without PM; E and F: Axial unenhanced and venous CT images showing irregular wall thickening and a mass in the cardia of the stomach; G and H: A 3D ROI drawn with a 25-mm height using a semiautomated technique. The red area represents VF, while the blue area represents SF.
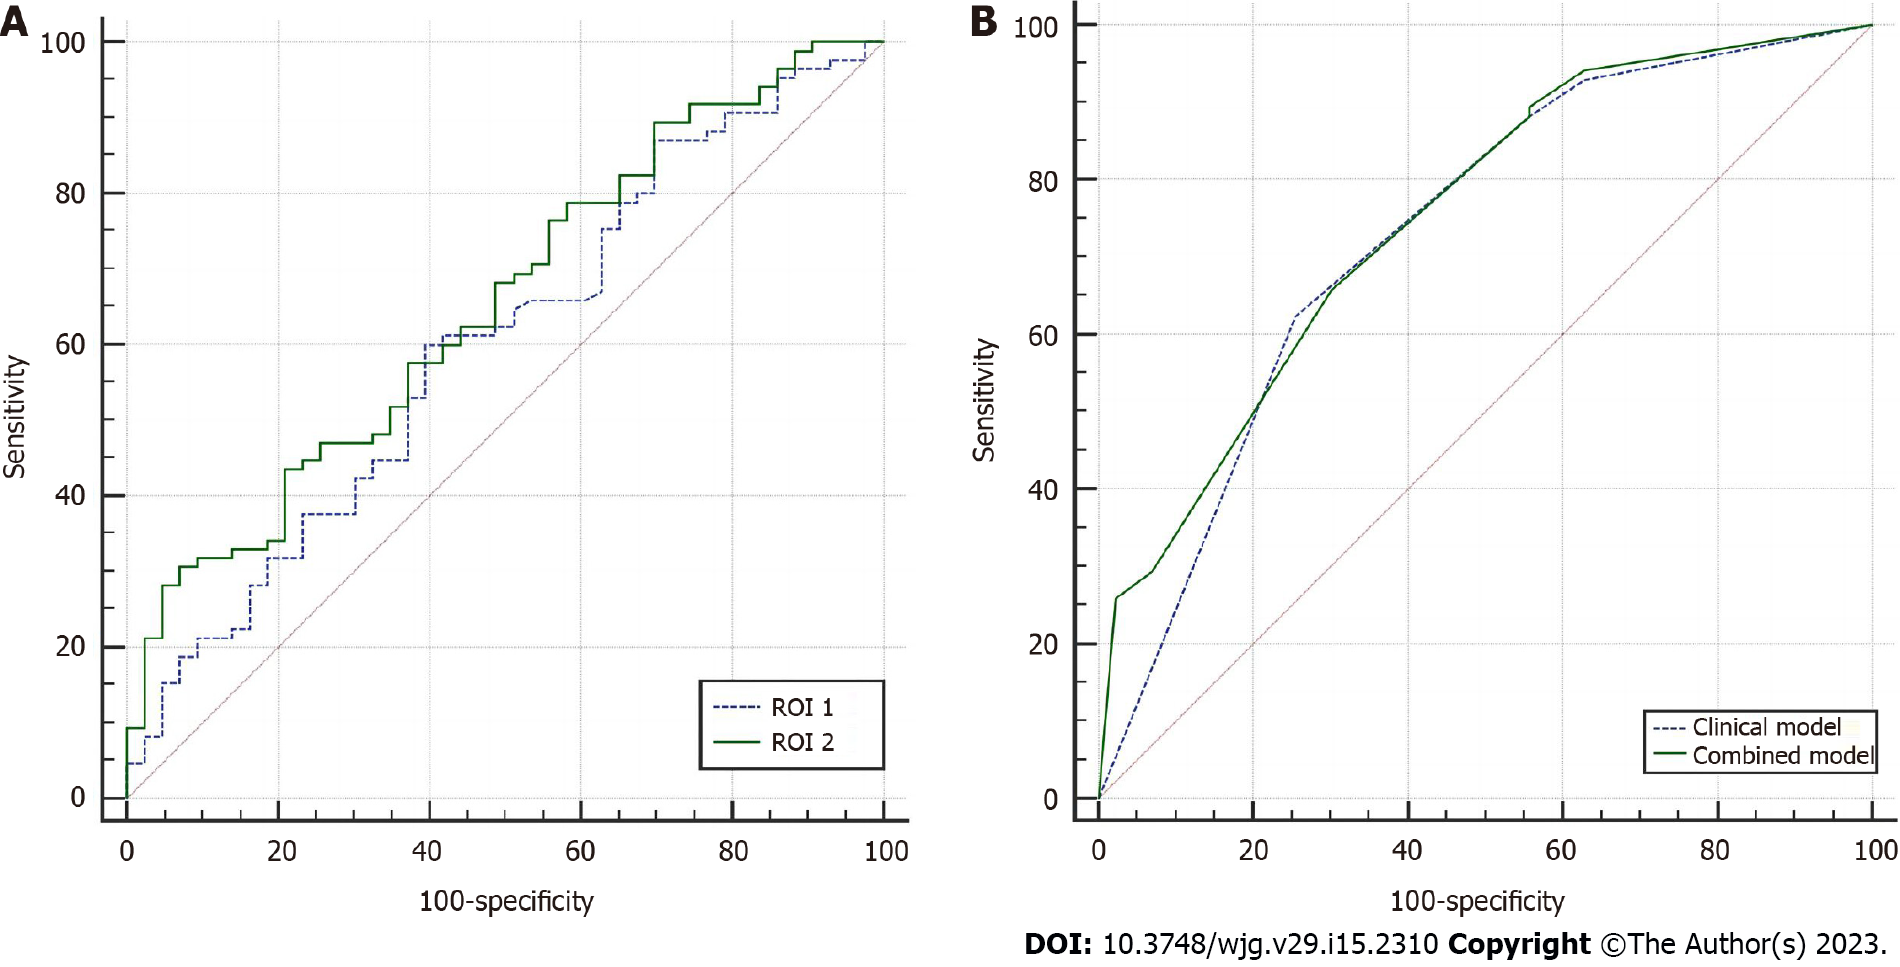
Figure 2 Predictive performance of computed tomography attenuations for visceral fat in two regions of interest and two models for predicting peritoneal metastasis in gastric cancer.
A: Receiving operator characteristic (ROC) curves of the visceral fat (VF) computed tomography (CT) attenuations on ROIs 1 and 2. The VF CT attenuations on ROI 2 [area under the curve (AUC): 0.657, sensitivity 93.0%, specificity 30.6%] showed a better predictive performance than those on ROI 1 (AUC: 0.599, sensitivity 60.0%, specificity 60.0%); B: ROC curves of the clinical and combined models. The two models showed comparable predictive performance for peritoneal metastasis in gastric cancer (AUC: 0.730 vs 0.749, P = 0.399)
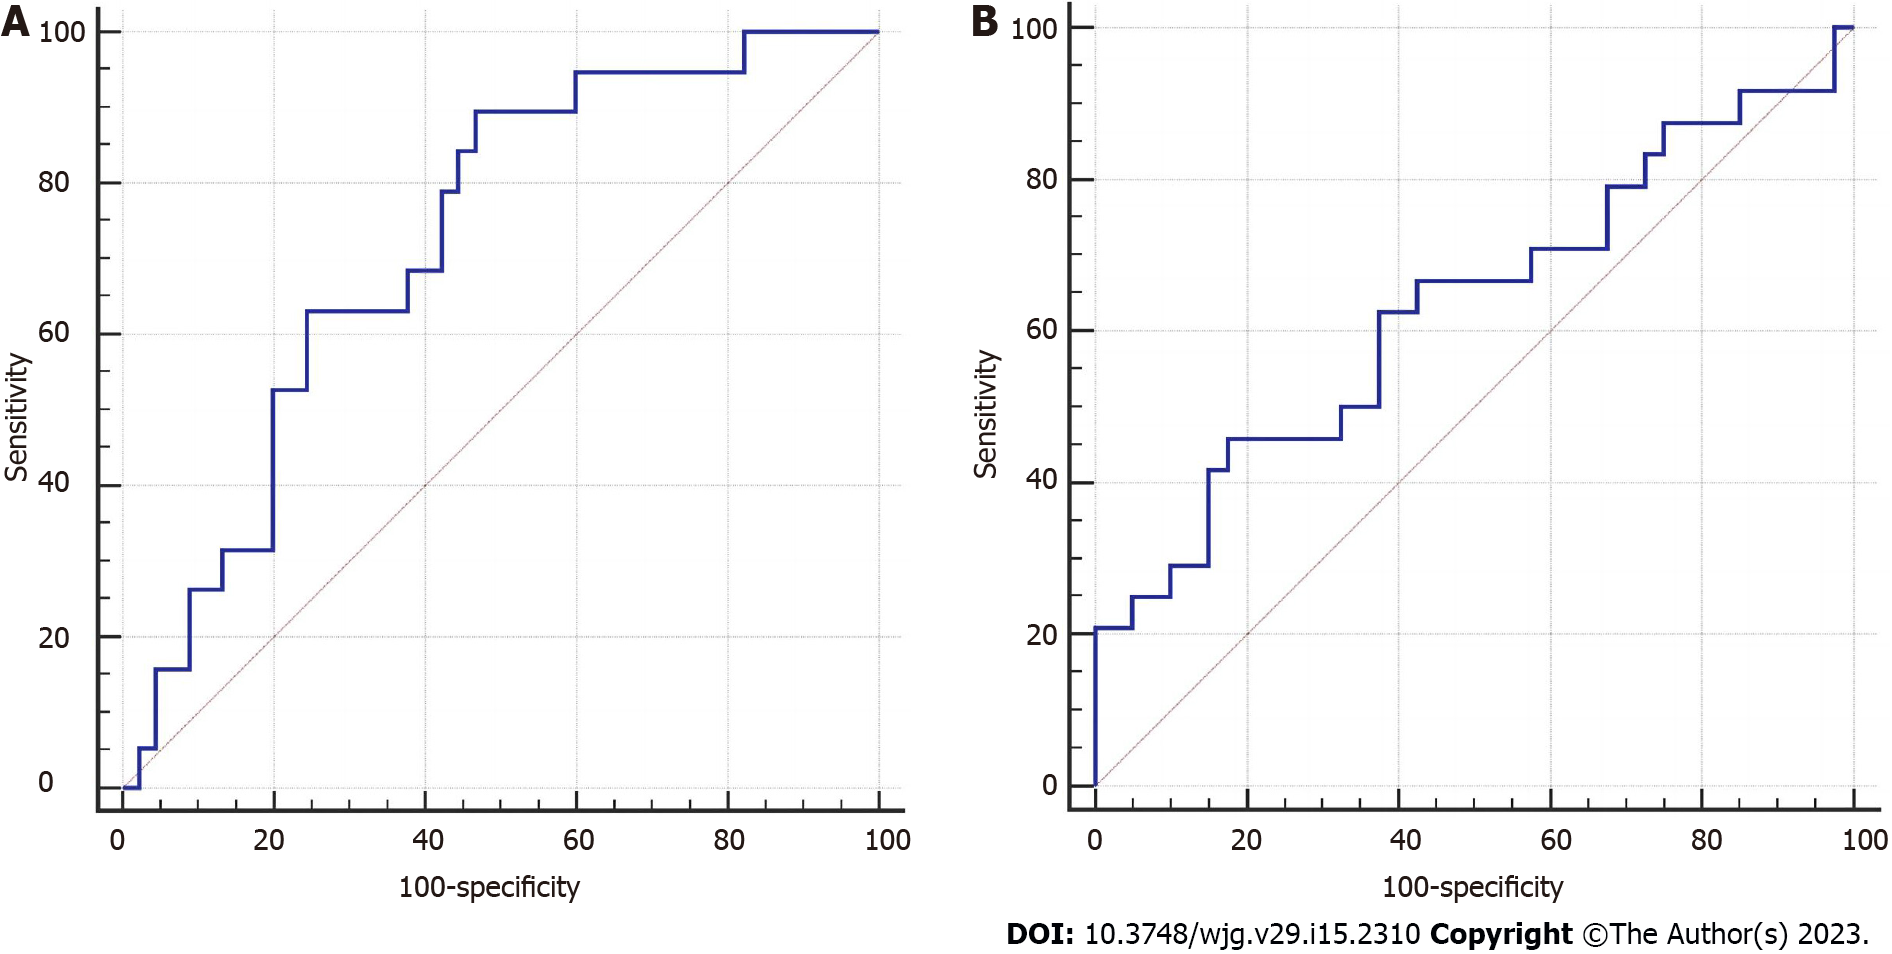
Figure 3 Performance of computed tomography attenuations for visceral fat in predicting peritoneal metastasis in gastric cancer.
A: High-volume group; B: Low-volume group.
- Citation: Li LM, Feng LY, Liu CC, Huang WP, Yu Y, Cheng PY, Gao JB. Can visceral fat parameters based on computed tomography be used to predict occult peritoneal metastasis in gastric cancer? World J Gastroenterol 2023; 29(15): 2310-2321
- URL: https://www.wjgnet.com/1007-9327/full/v29/i15/2310.htm
- DOI: https://dx.doi.org/10.3748/wjg.v29.i15.2310


