Copyright
©The Author(s) 2022.
World J Gastroenterol. Aug 28, 2022; 28(32): 4716-4725
Published online Aug 28, 2022. doi: 10.3748/wjg.v28.i32.4716
Published online Aug 28, 2022. doi: 10.3748/wjg.v28.i32.4716
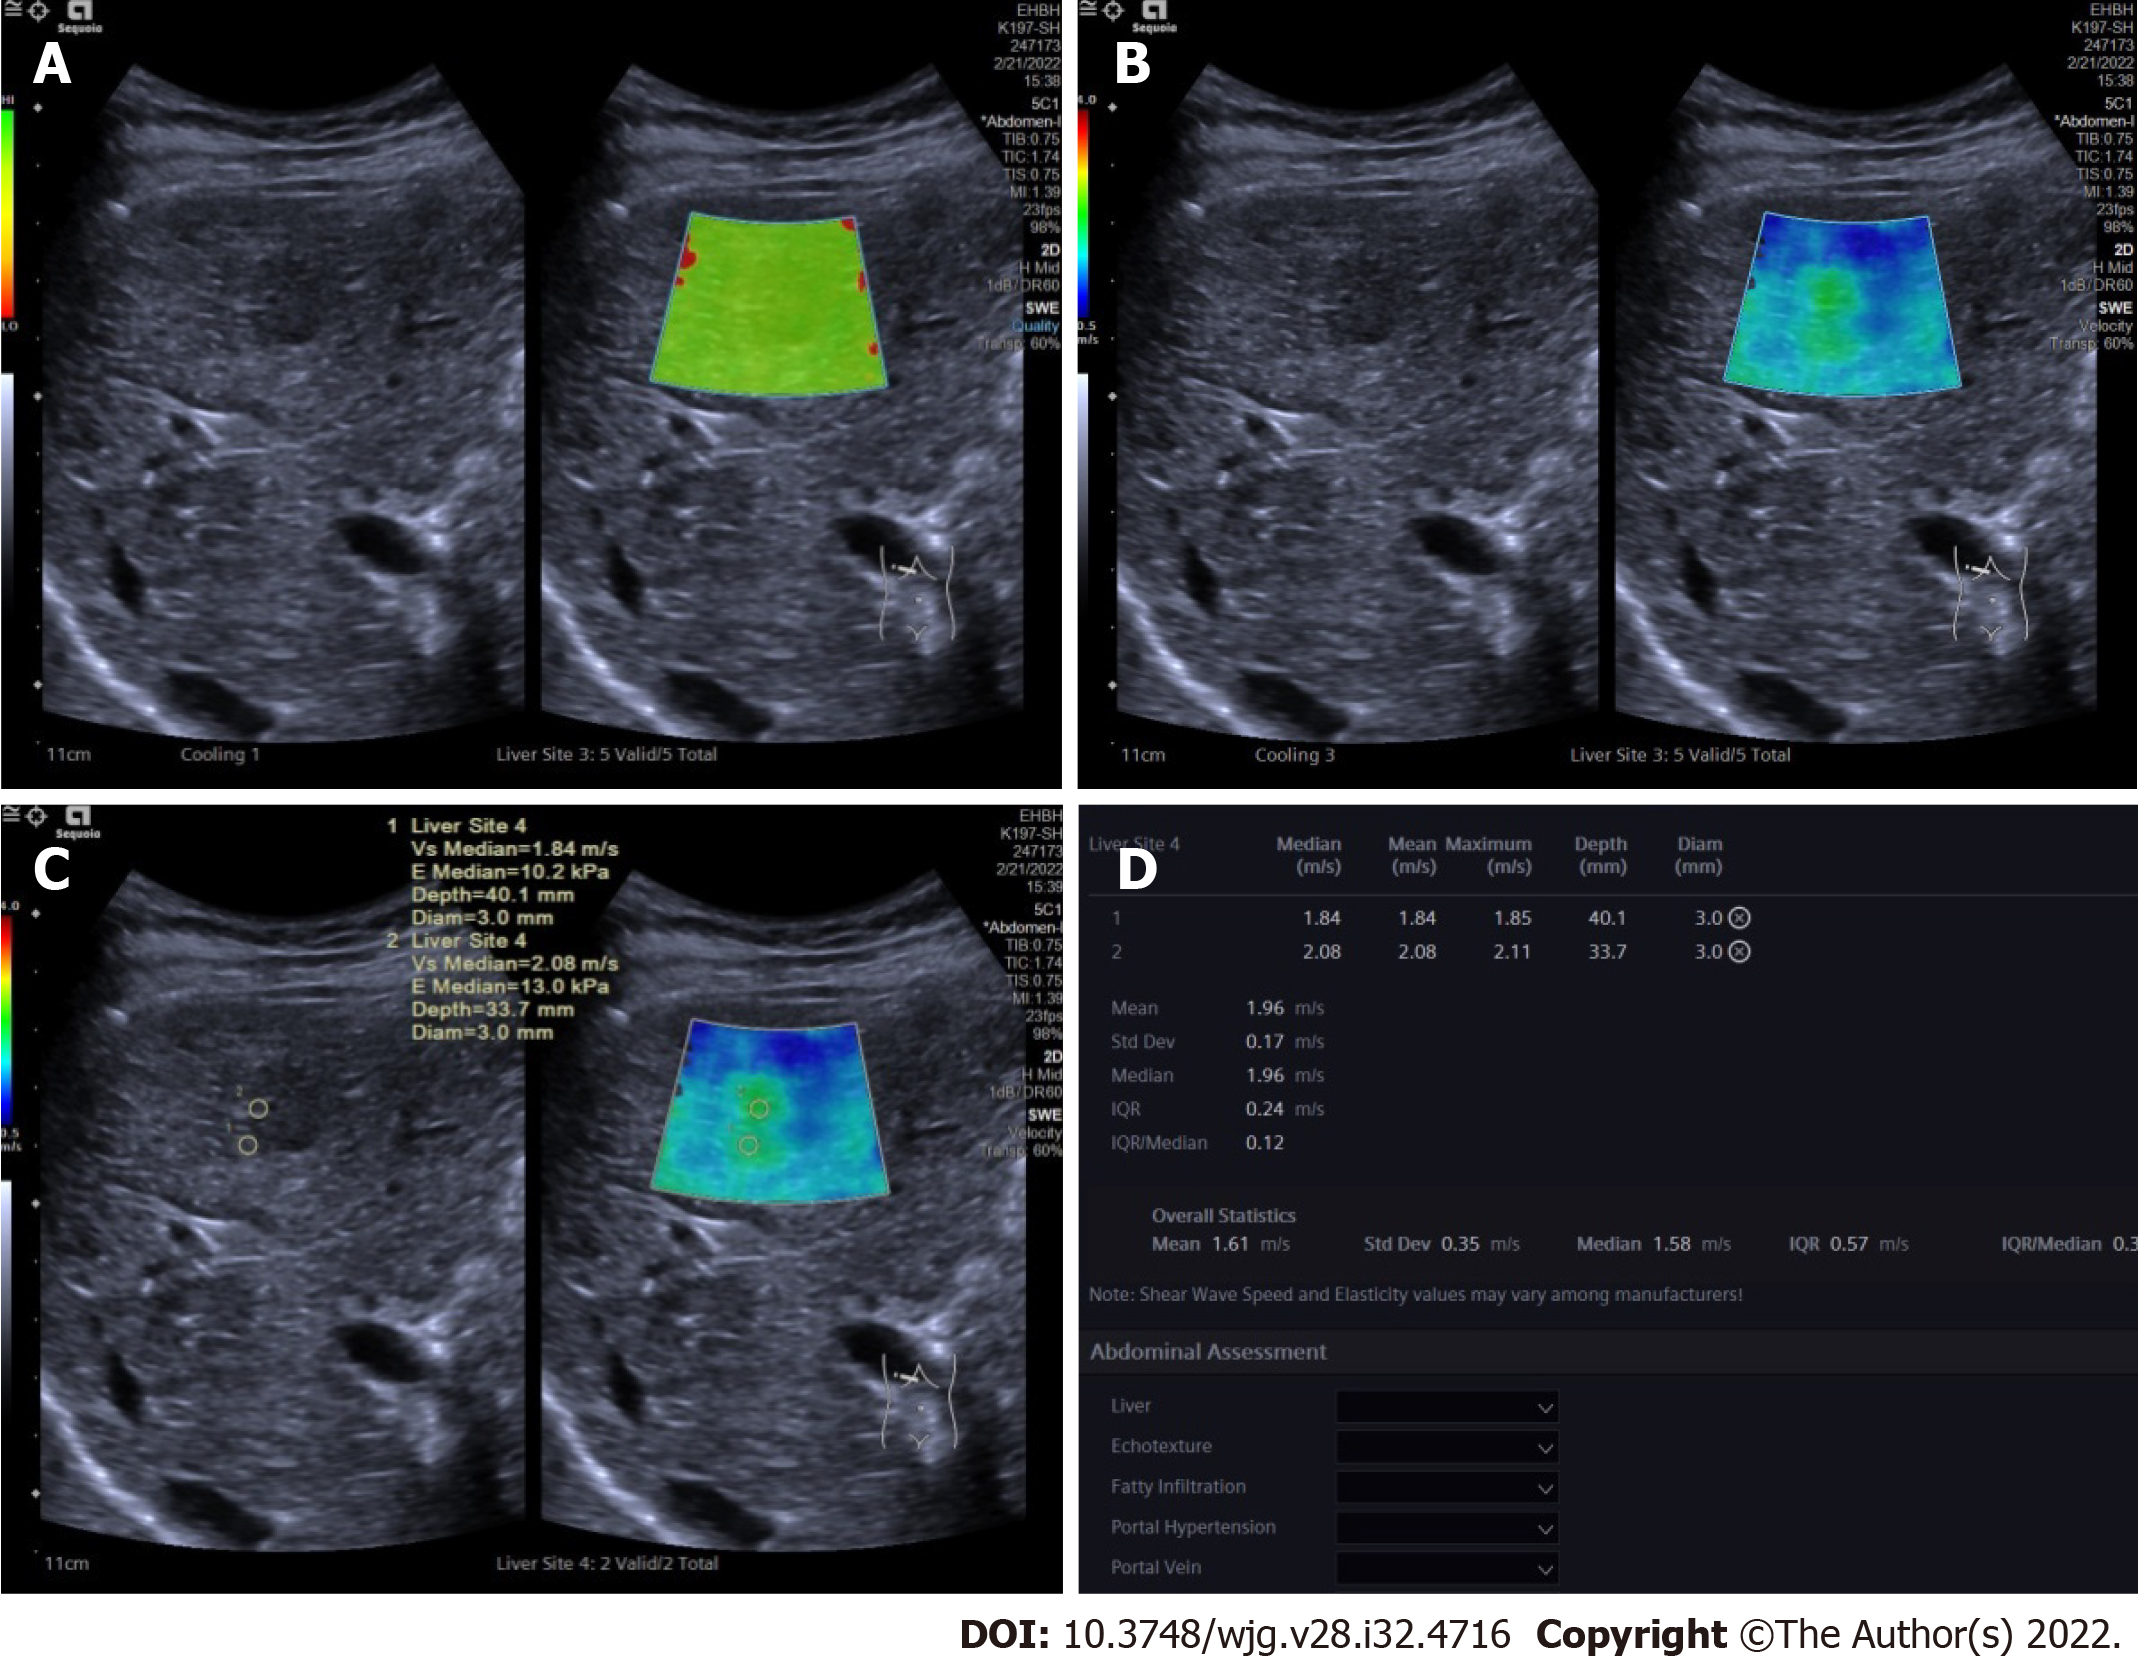
Figure 1 Two-dimensional shear wave elastography images in patients with focal liver lesions.
A: Tumor shown on quality mode as green indicated that the quality of two-dimensional shear wave elastography image was up to standard; B: Tumor shown in velocity mode, speed bar set at 0.5-4.0 m/s; C: Two circular regions of interest (ROIs, with 3 mm diameter) placed at the stiffest site in the tumor and at the periphery of tumor; D: Maximum values of the two ROIs recorded as maximal elasticity.
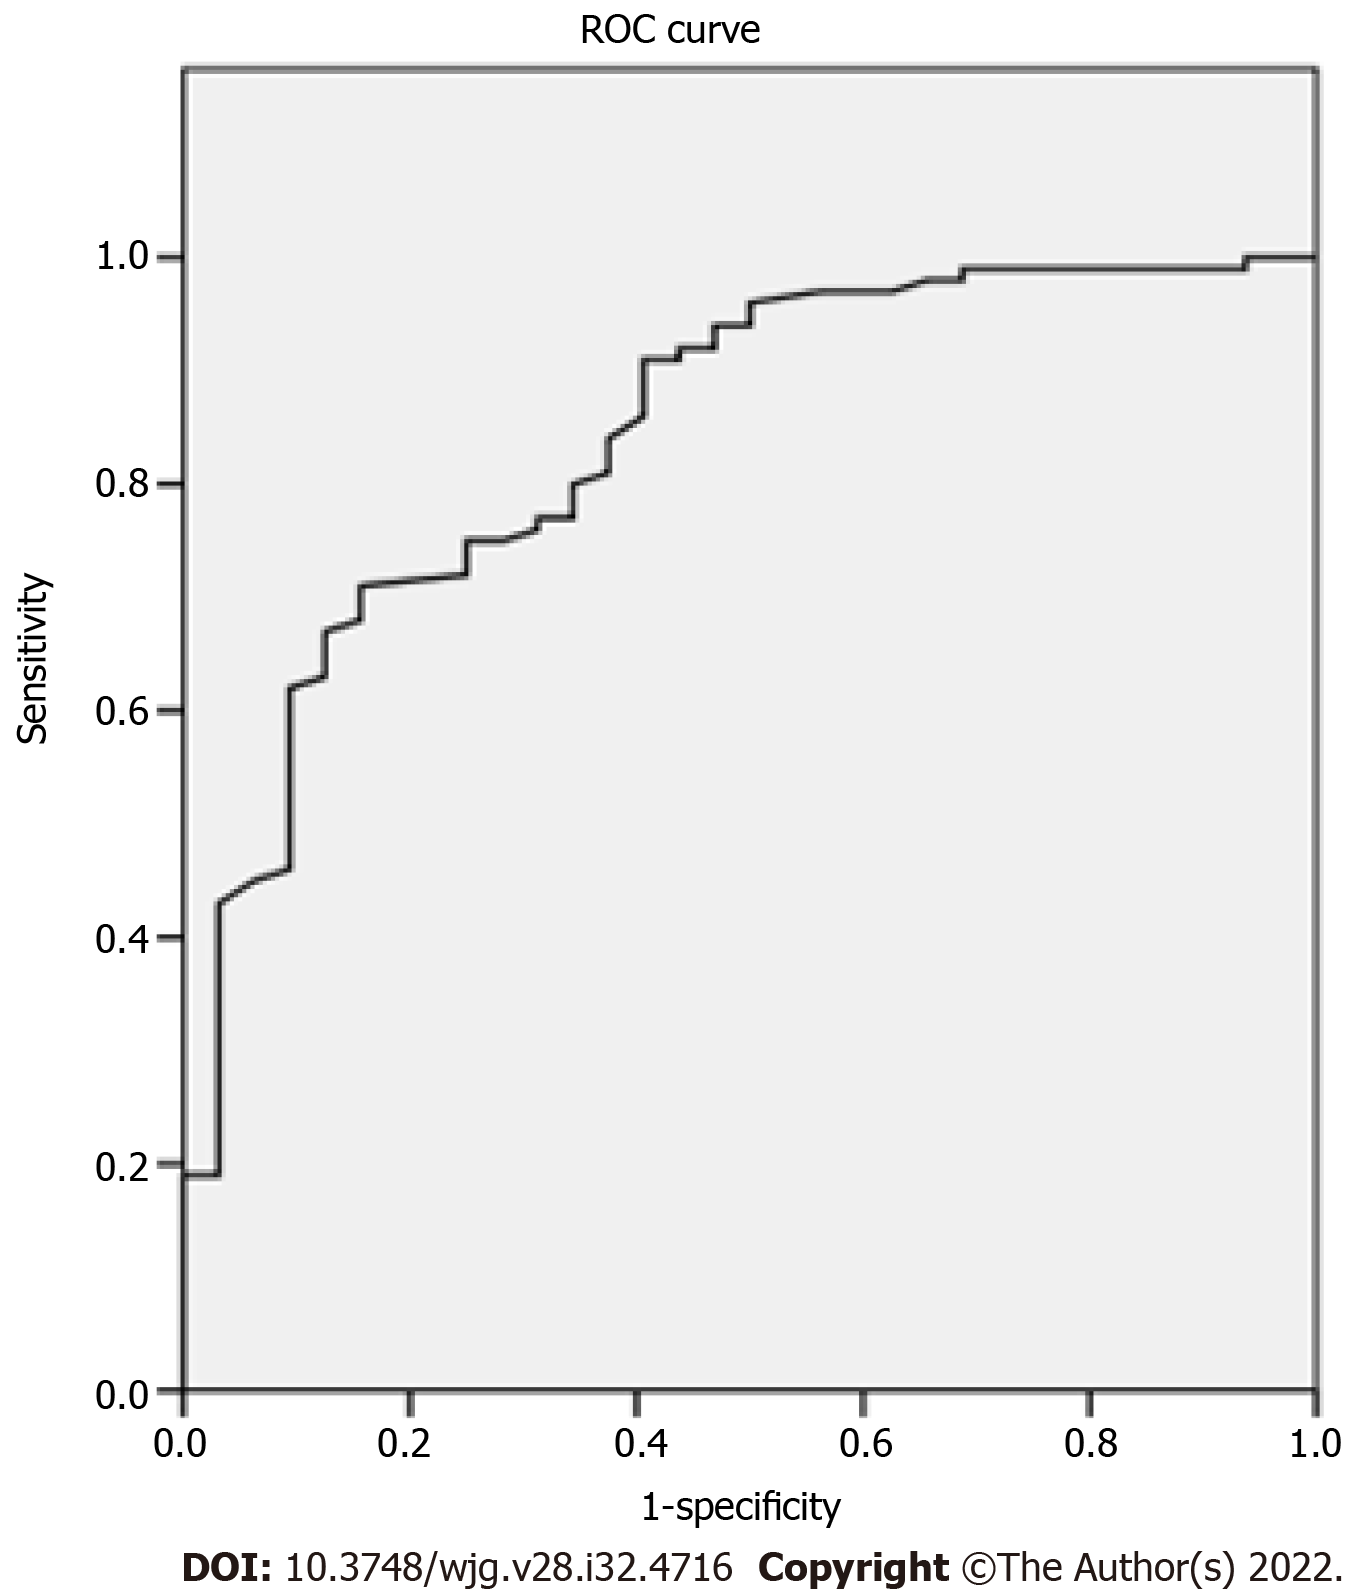
Figure 2 Receiver operating characteristic curve of maximum elasticity for malignant and benign focal liver lesions.
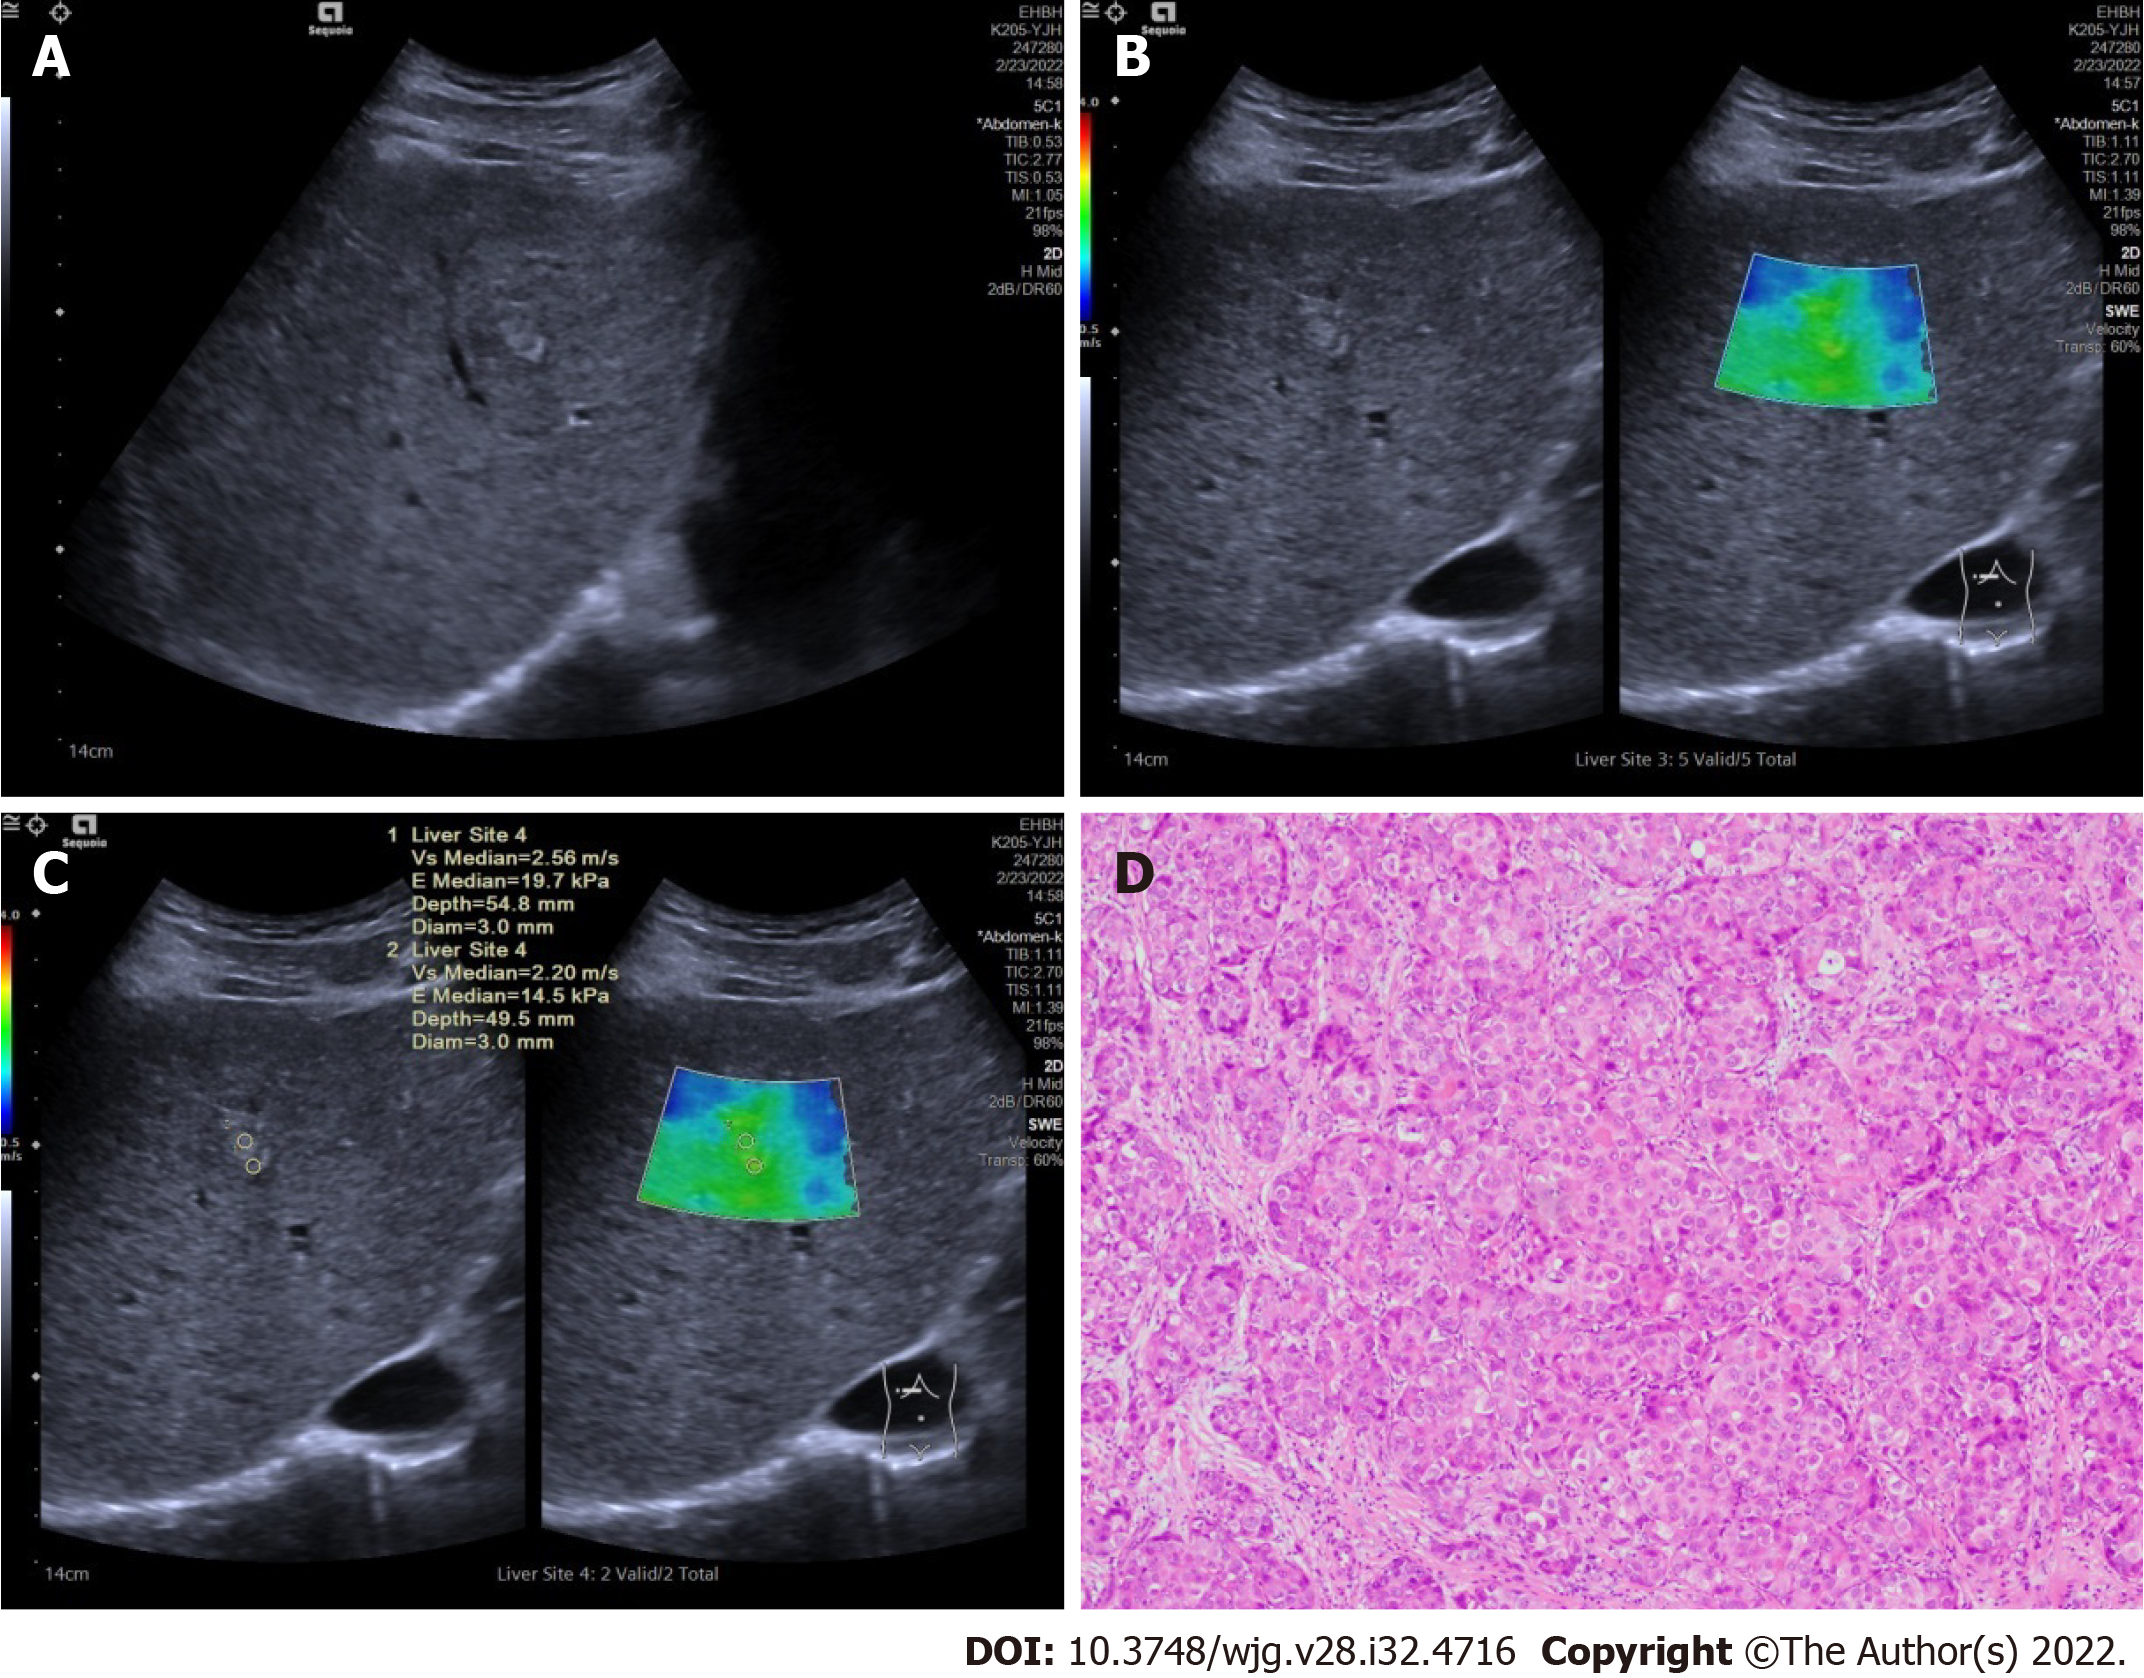
Figure 3 Ultrasound and pathologic images in a 51-year old male patients with hepatocellular carcinomas.
A: A tumor shown on conventional ultrasound were diagnosed as undetermined; B: Tumor shown as stiffer, compared with surrounding liver tissue in two-dimensional shear wave elastography velocity mode; C: Maximal elasticity of the tumor was higher than 1.905 m/s and the tumor was diagnosed as malignant; D: Pathological examination confirmed the tumor as hepatocellular carcinomas (HE, × 200).
- Citation: Guo J, Jiang D, Qian Y, Yu J, Gu YJ, Zhou YQ, Zhang HP. Differential diagnosis of different types of solid focal liver lesions using two-dimensional shear wave elastography. World J Gastroenterol 2022; 28(32): 4716-4725
- URL: https://www.wjgnet.com/1007-9327/full/v28/i32/4716.htm
- DOI: https://dx.doi.org/10.3748/wjg.v28.i32.4716


