Copyright
©The Author(s) 2022.
World J Gastroenterol. Jun 14, 2022; 28(22): 2494-2508
Published online Jun 14, 2022. doi: 10.3748/wjg.v28.i22.2494
Published online Jun 14, 2022. doi: 10.3748/wjg.v28.i22.2494
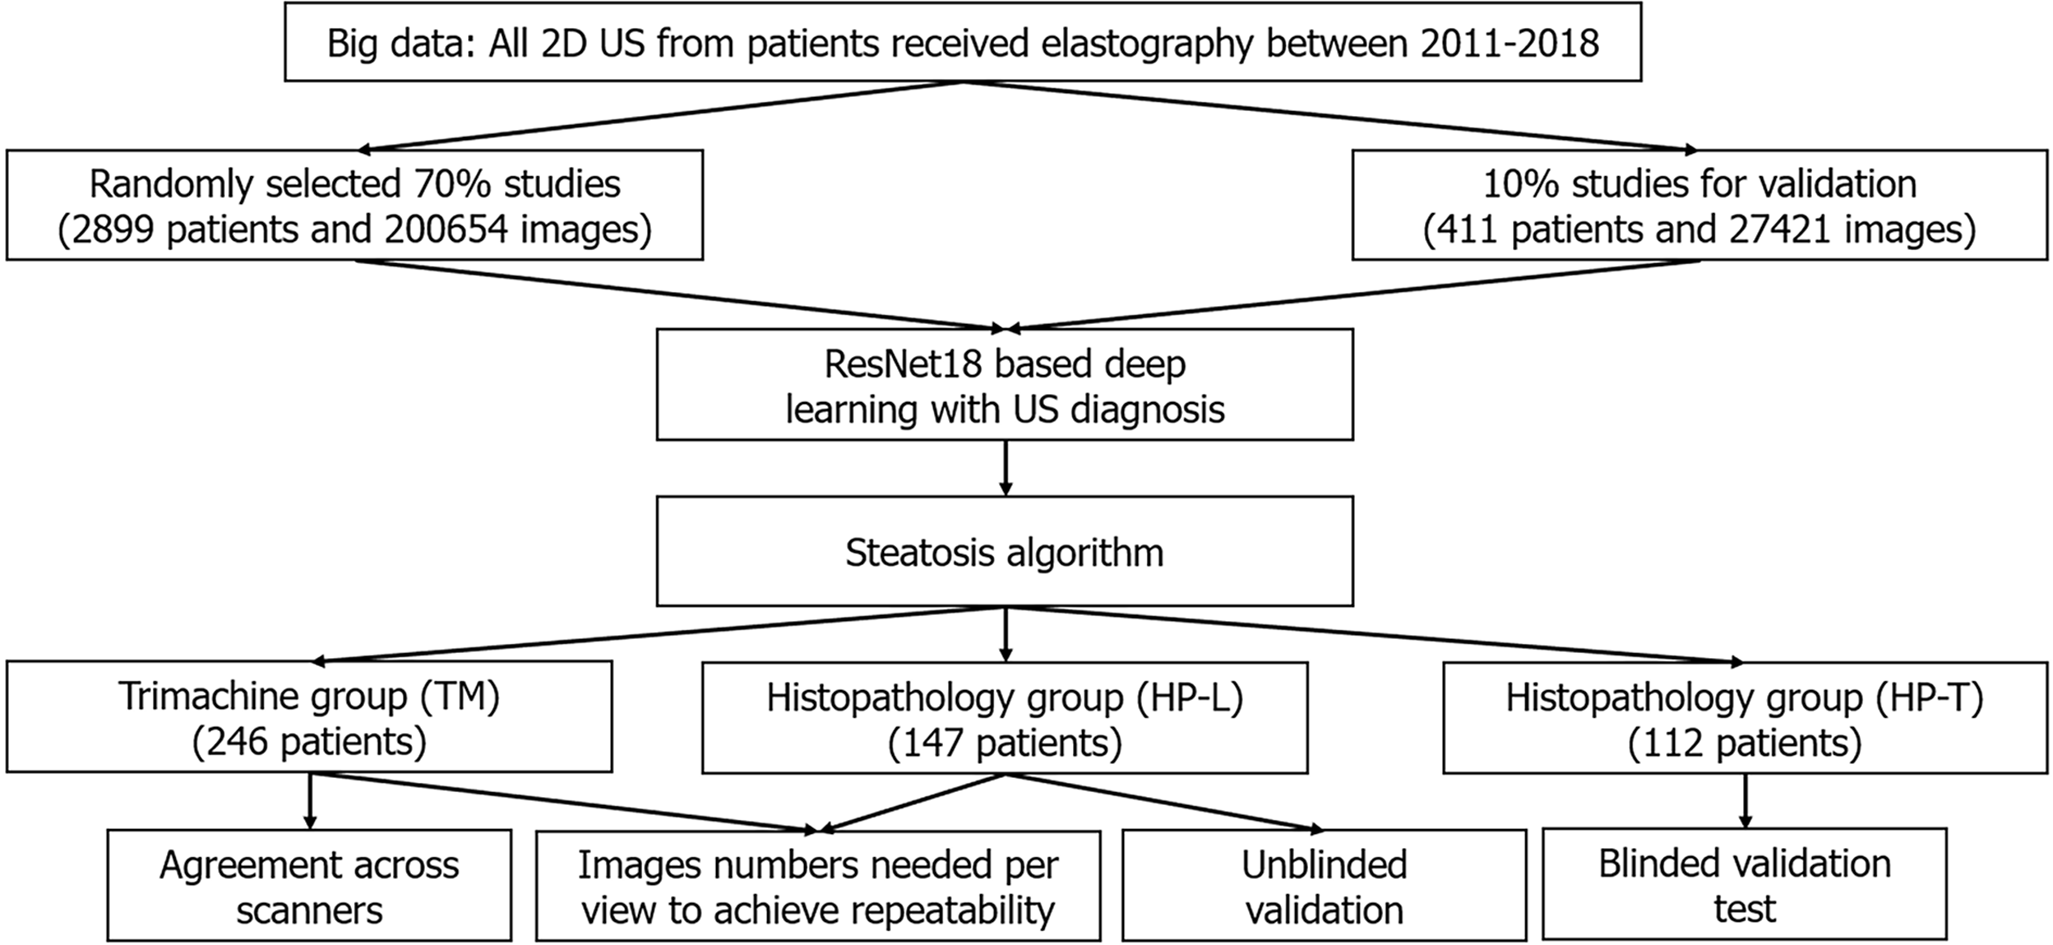
Figure 1 Flowchart.
2D-US: Two-dimensional ultrasound.
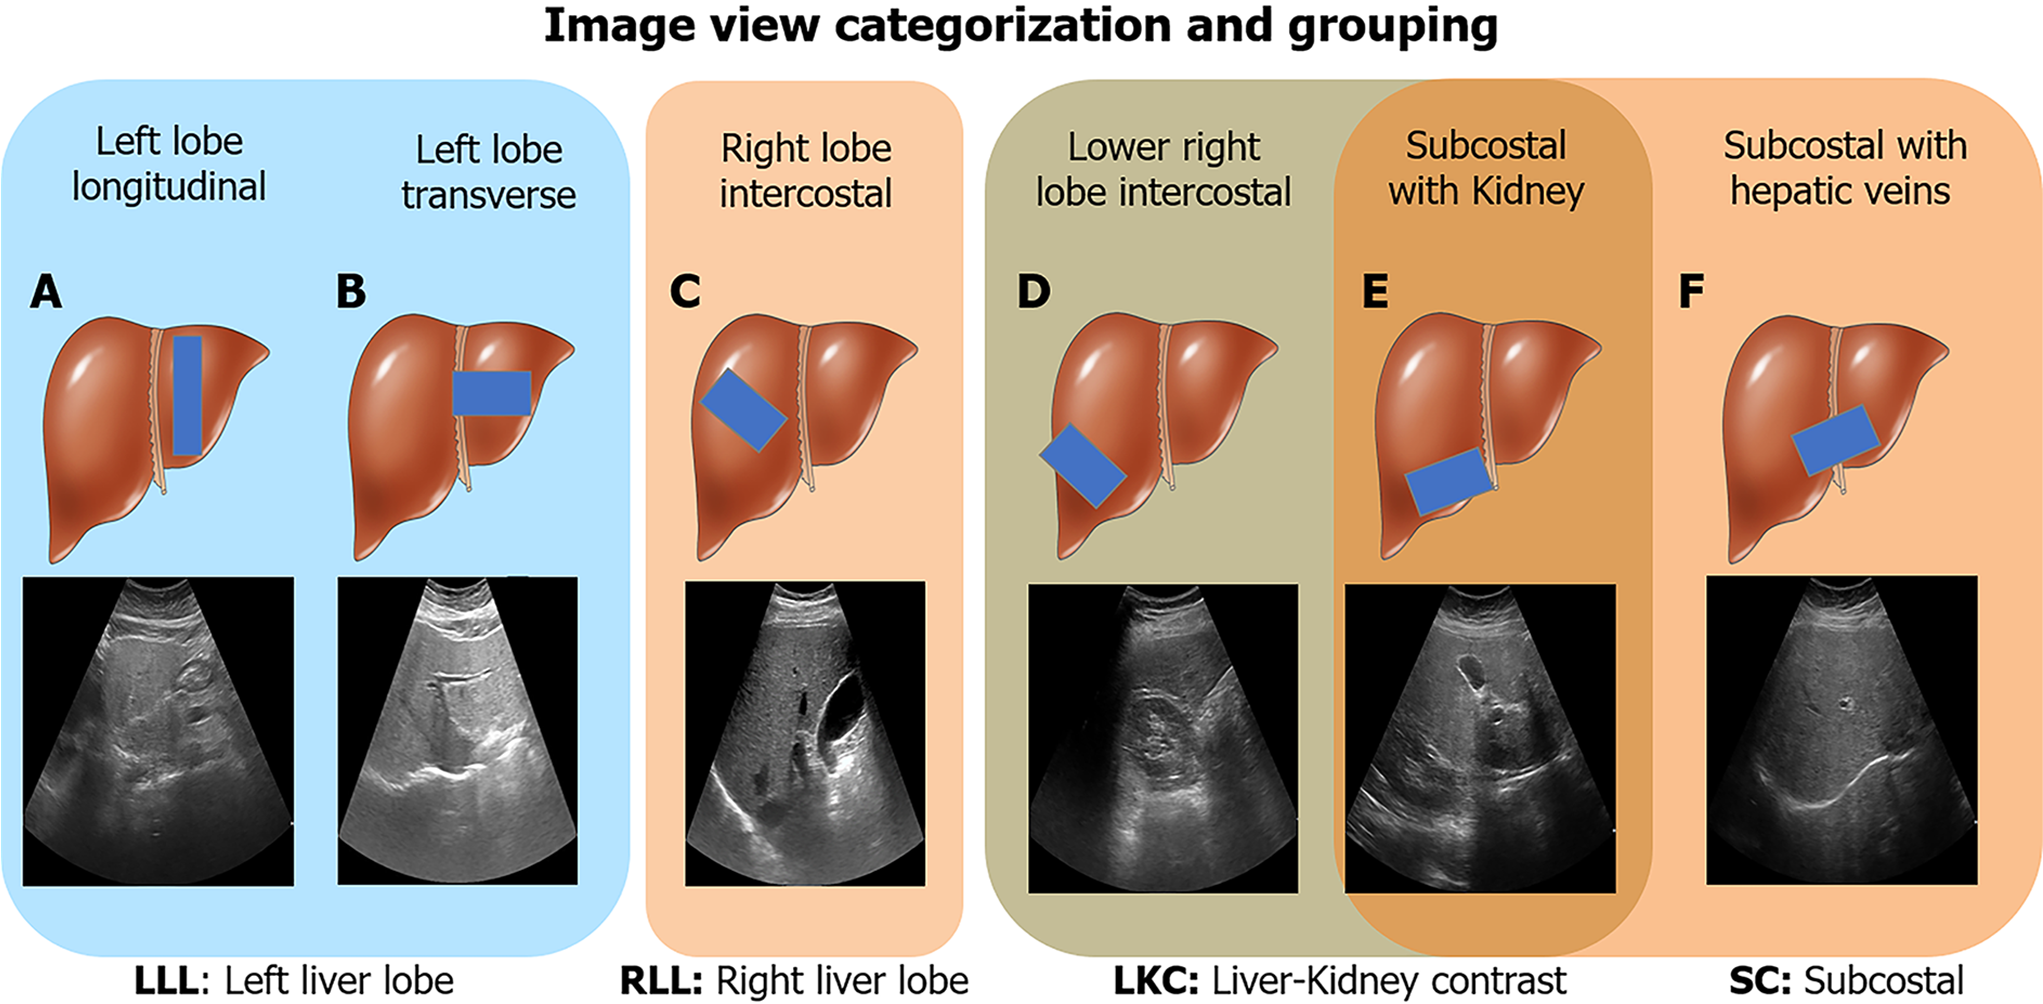
Figure 2 Image view categorization and grouping.
Six ultrasound image viewpoints were used in this study. A: Left lobe longitudinal; B: Left lobe transverse; C: Right lobe intercostal; D: Lower right lobe intercostal (depicting liver/kidney contrast); E: Subcostal depicting liver/kidney contrast; F: Subcostal with hepatic veins. These views were further categorized into four groups: Left liver lobe (A and B), right liver lobe (C), liver/kidney contrast (D and E), and subcostal (E and F). LLL: Left liver lobe; RLL: Right liver lobe; LKC: Liver/kidney contrast; SC: Subcostal. Liver cartoons adapted from the DataBase Center for Life Science (https://commons.wikimedia.org/wiki/File:201405_liver.png), licensed under the Creative Commons Attribution 4.0 International[51] (Copyright permission see Supplementary material).
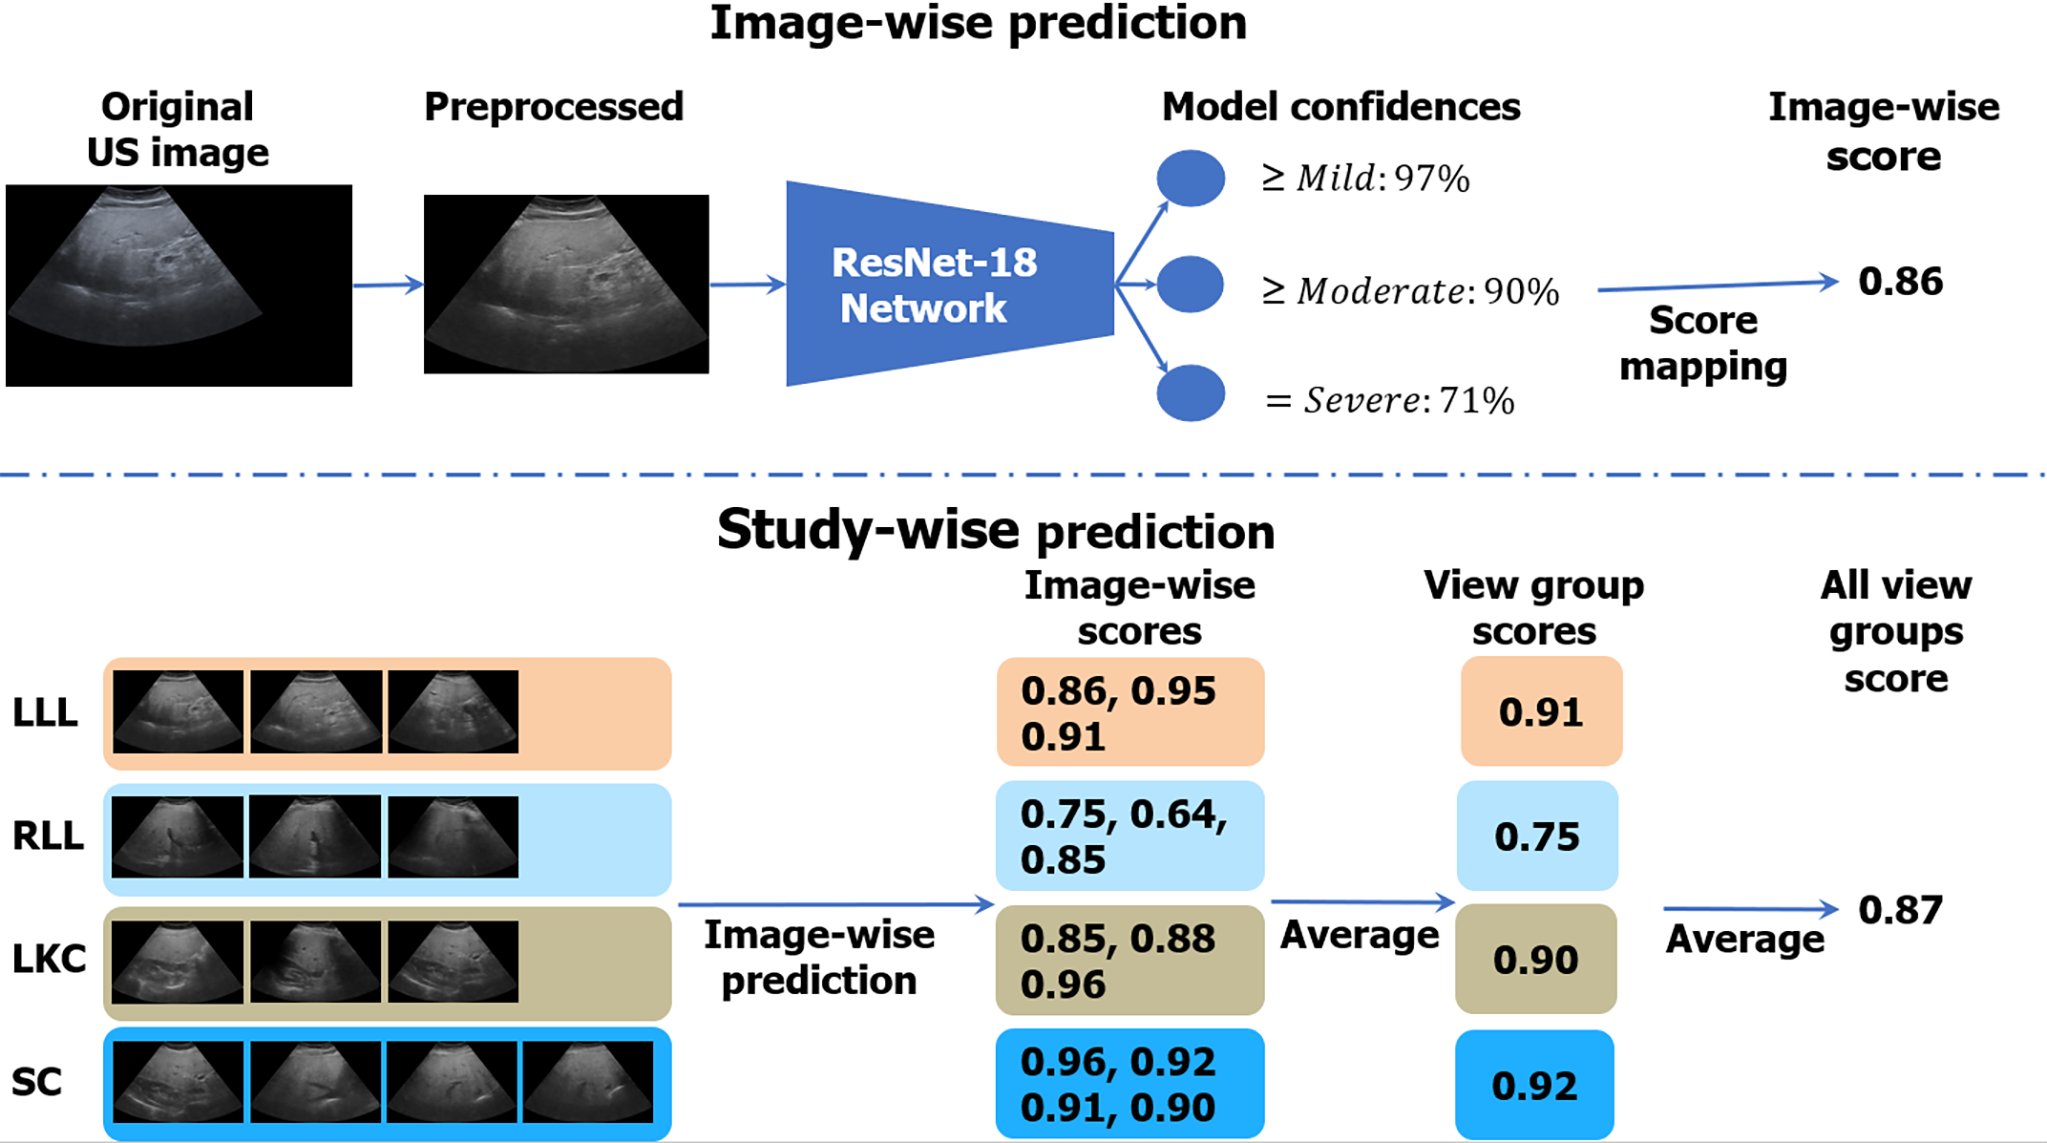
Figure 3 Algorithmic workflow.
Images were first comprehensively preprocessed to remove regions outside the ultrasound beam. A deep learning neural network, called ResNet-18, was trained on individual ultrasound images in the big data learning group. The model predicted confidences in three binary cutoffs: “≥ mild”, “≥ moderate”, or “= severe” steatosis. The confidences were mapped to a continuous image-wise score in the range of [0, 1]. View-group scores were produced by averaging each image within the group. An “All View Groups” score was produced by averaging all available view group scores. In the figure’s example, the gold standard histopathology diagnosis was a fatty cell percentage of 90%. LLL: Left liver lobe; RLL: Right liver lobe; LKC: Liver/kidney contrast; SC: Subcostal.
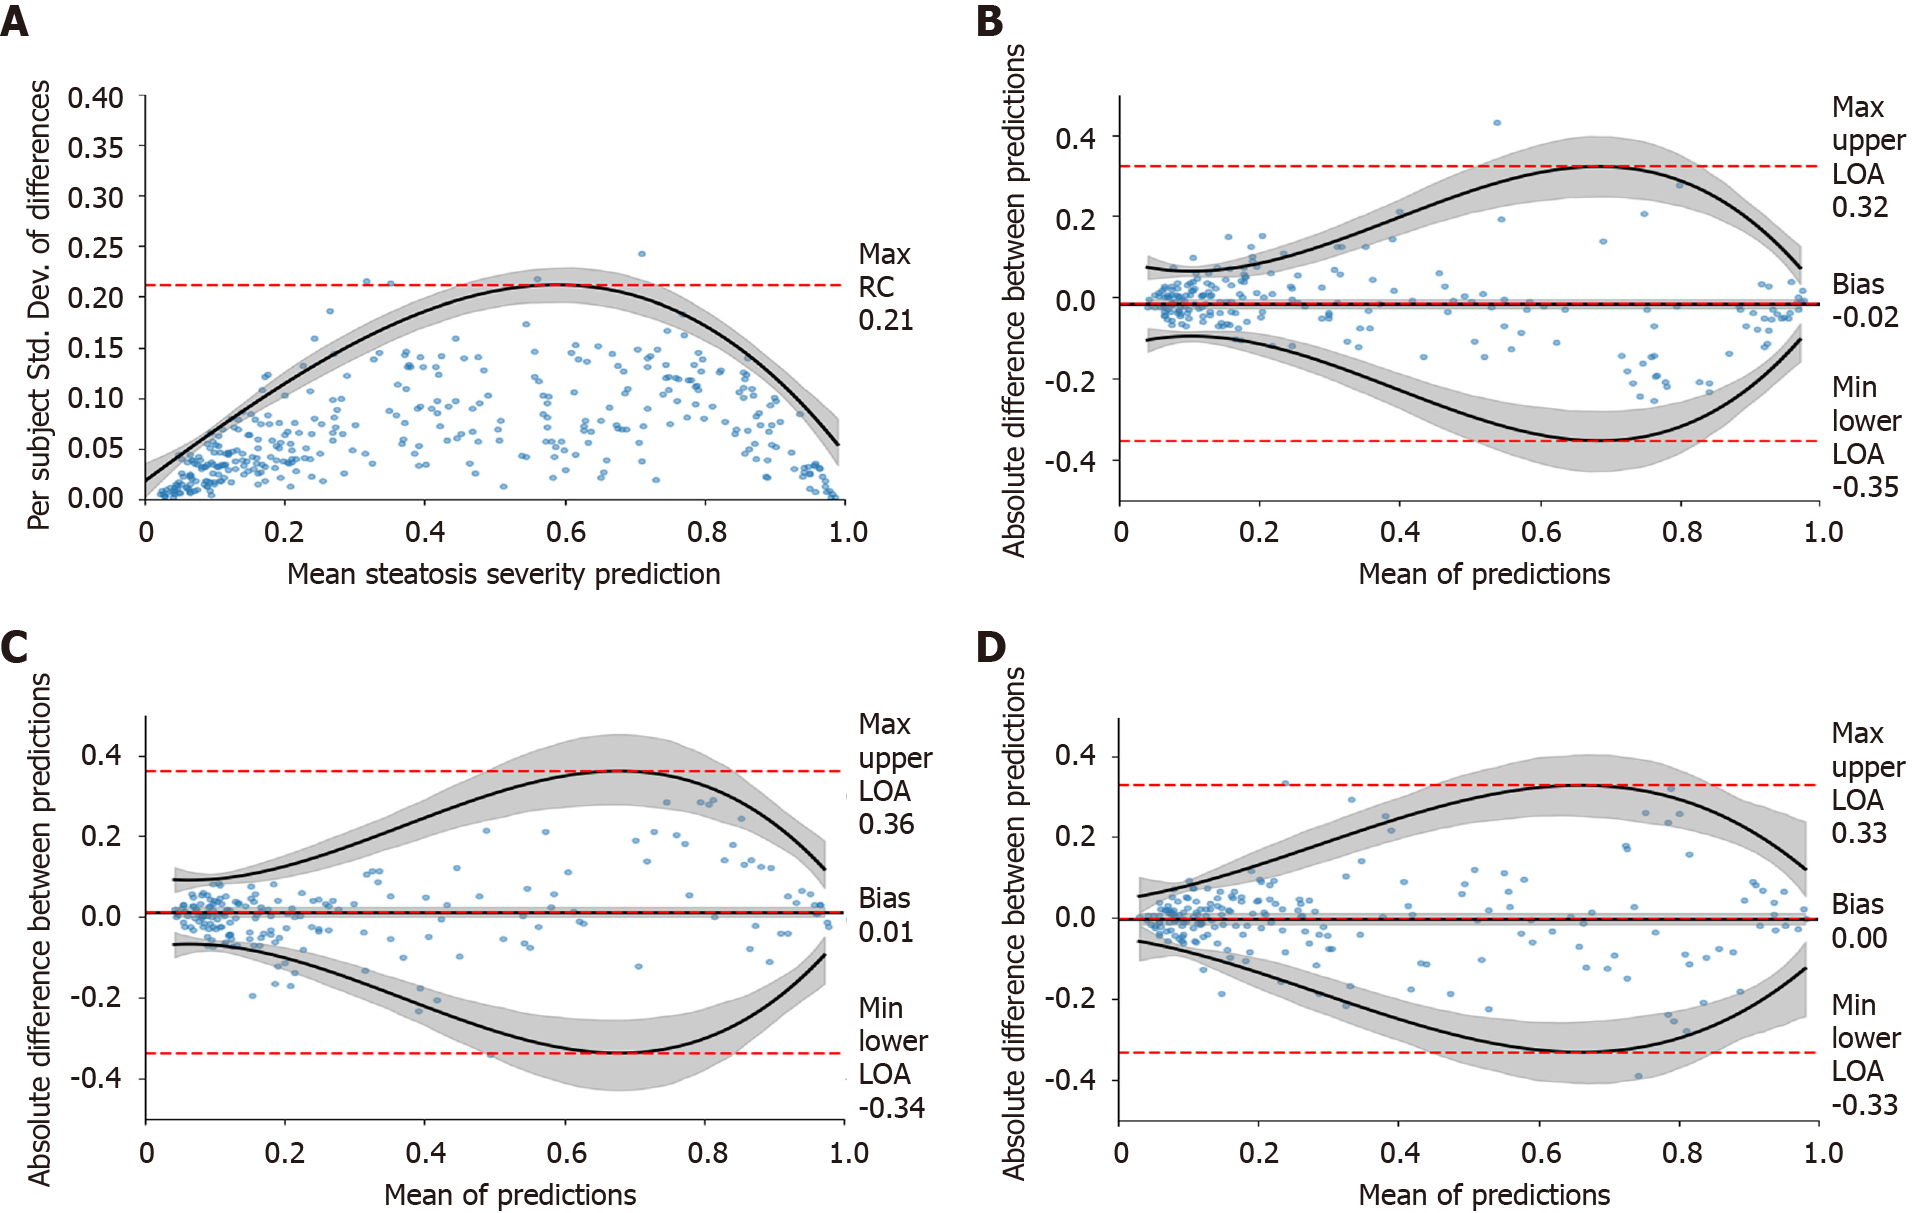
Figure 4 Repeatability study.
A: A repeatability coefficient plot for right liver lobe when using three images; B-D: Cross-scanner Bland-Altman plots for Siemens-Toshiba (B), Toshiba-Philips (C), and Philips-Siemens (D), respectively. Cross-scanner plots were depicted for “All View Groups” when using ≥ three images per view group. Grey-shaded areas indicate 95% confidence intervals. RC: Repeatability coefficient; LOA: Limit of agreement.
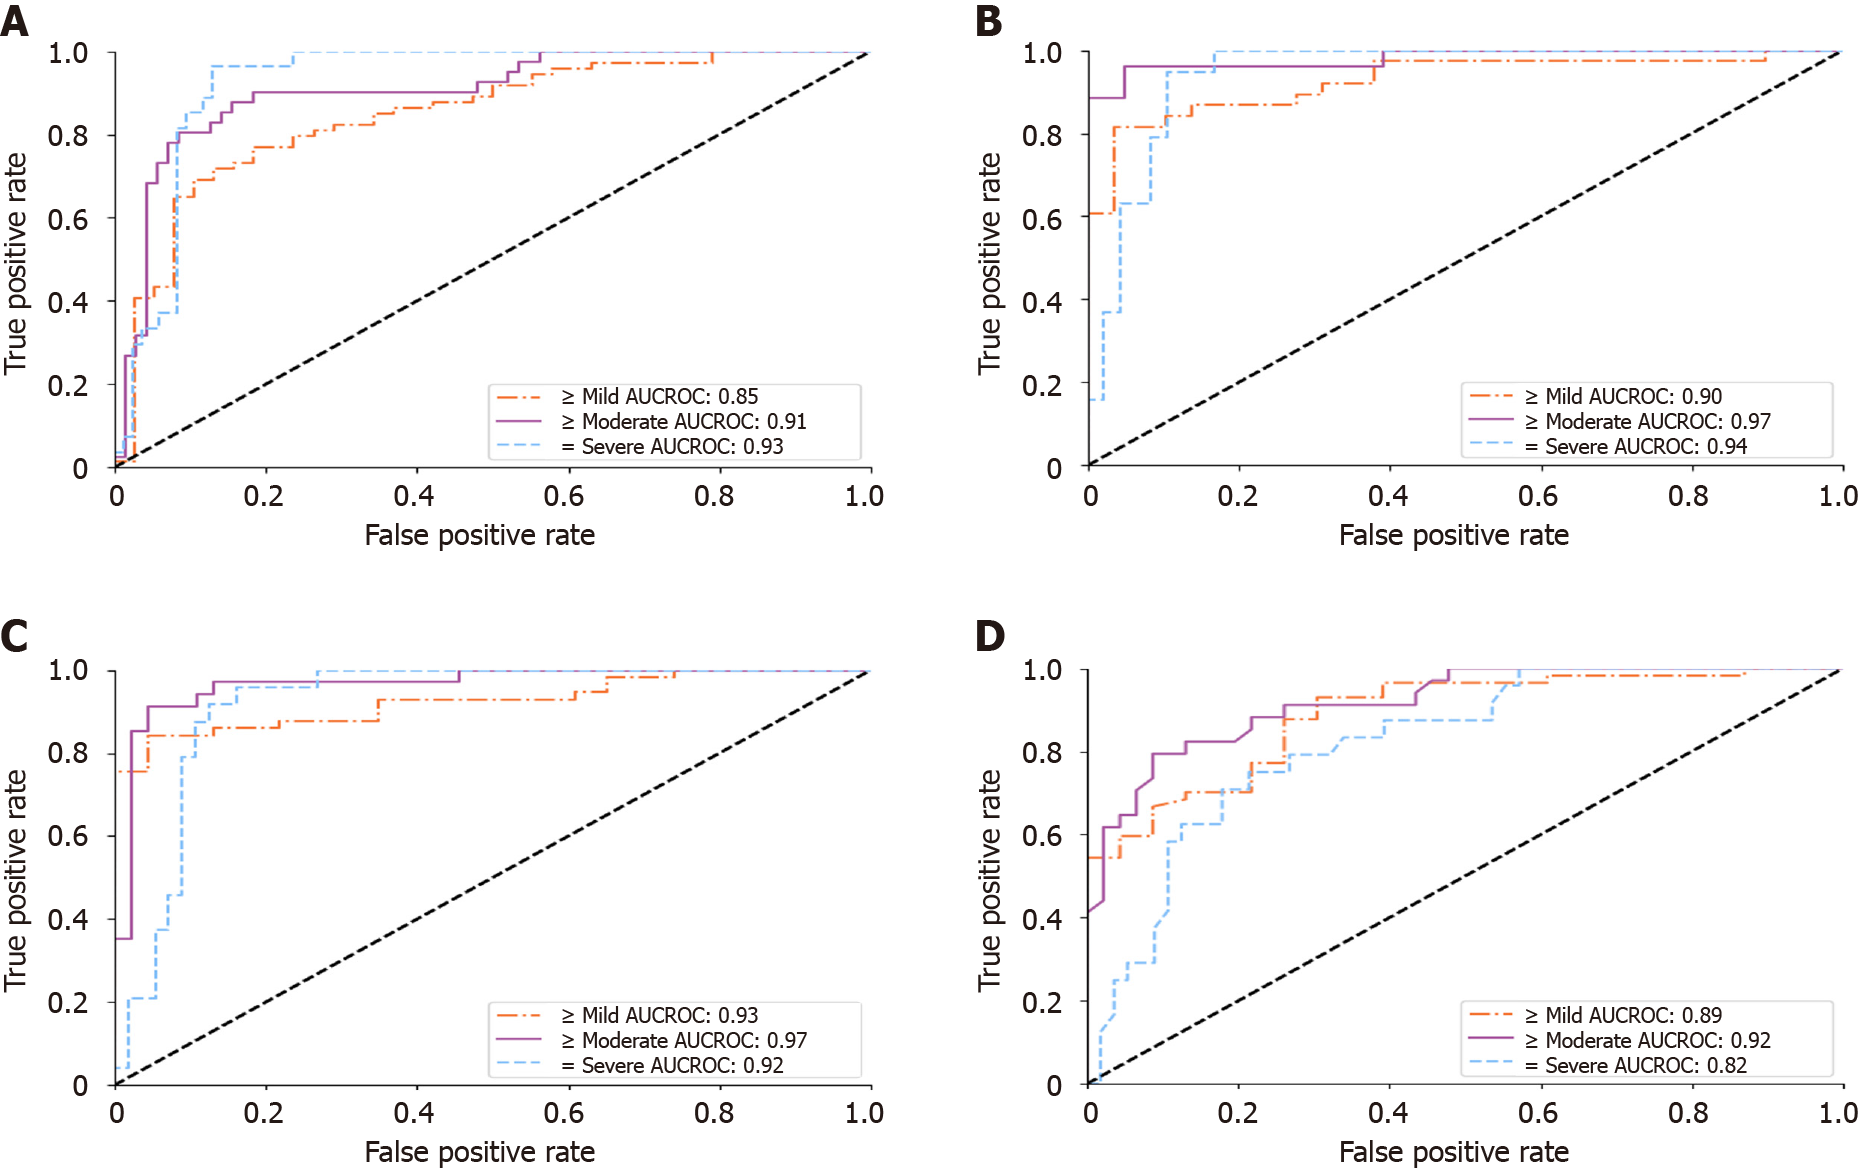
Figure 5 Receiver operating characteristic analysis on histopathology blinded test group.
A and B: Receiver operating characteristic curves of the deep learning model for diagnosing hepatic steatosis grades on histopathology blinded test group (HP-T) when using all scanners and only the Siemens/Toshiba/Philips premium scanners, respectively; C and D: Only select for histopathology blinded test group studies with FibroScan diagnoses, corresponding to the performance of the deep learning algorithm and FibroScan, respectively. All receiver operating characteristic curves were measured against a histopathological gold standard. AUCROC: Area under the curve of the receiver operating characteristic.
- Citation: Li B, Tai DI, Yan K, Chen YC, Chen CJ, Huang SF, Hsu TH, Yu WT, Xiao J, Le L, Harrison AP. Accurate and generalizable quantitative scoring of liver steatosis from ultrasound images via scalable deep learning. World J Gastroenterol 2022; 28(22): 2494-2508
- URL: https://www.wjgnet.com/1007-9327/full/v28/i22/2494.htm
- DOI: https://dx.doi.org/10.3748/wjg.v28.i22.2494


