Copyright
©The Author(s) 2022.
World J Gastroenterol. Jun 7, 2022; 28(21): 2361-2382
Published online Jun 7, 2022. doi: 10.3748/wjg.v28.i21.2361
Published online Jun 7, 2022. doi: 10.3748/wjg.v28.i21.2361
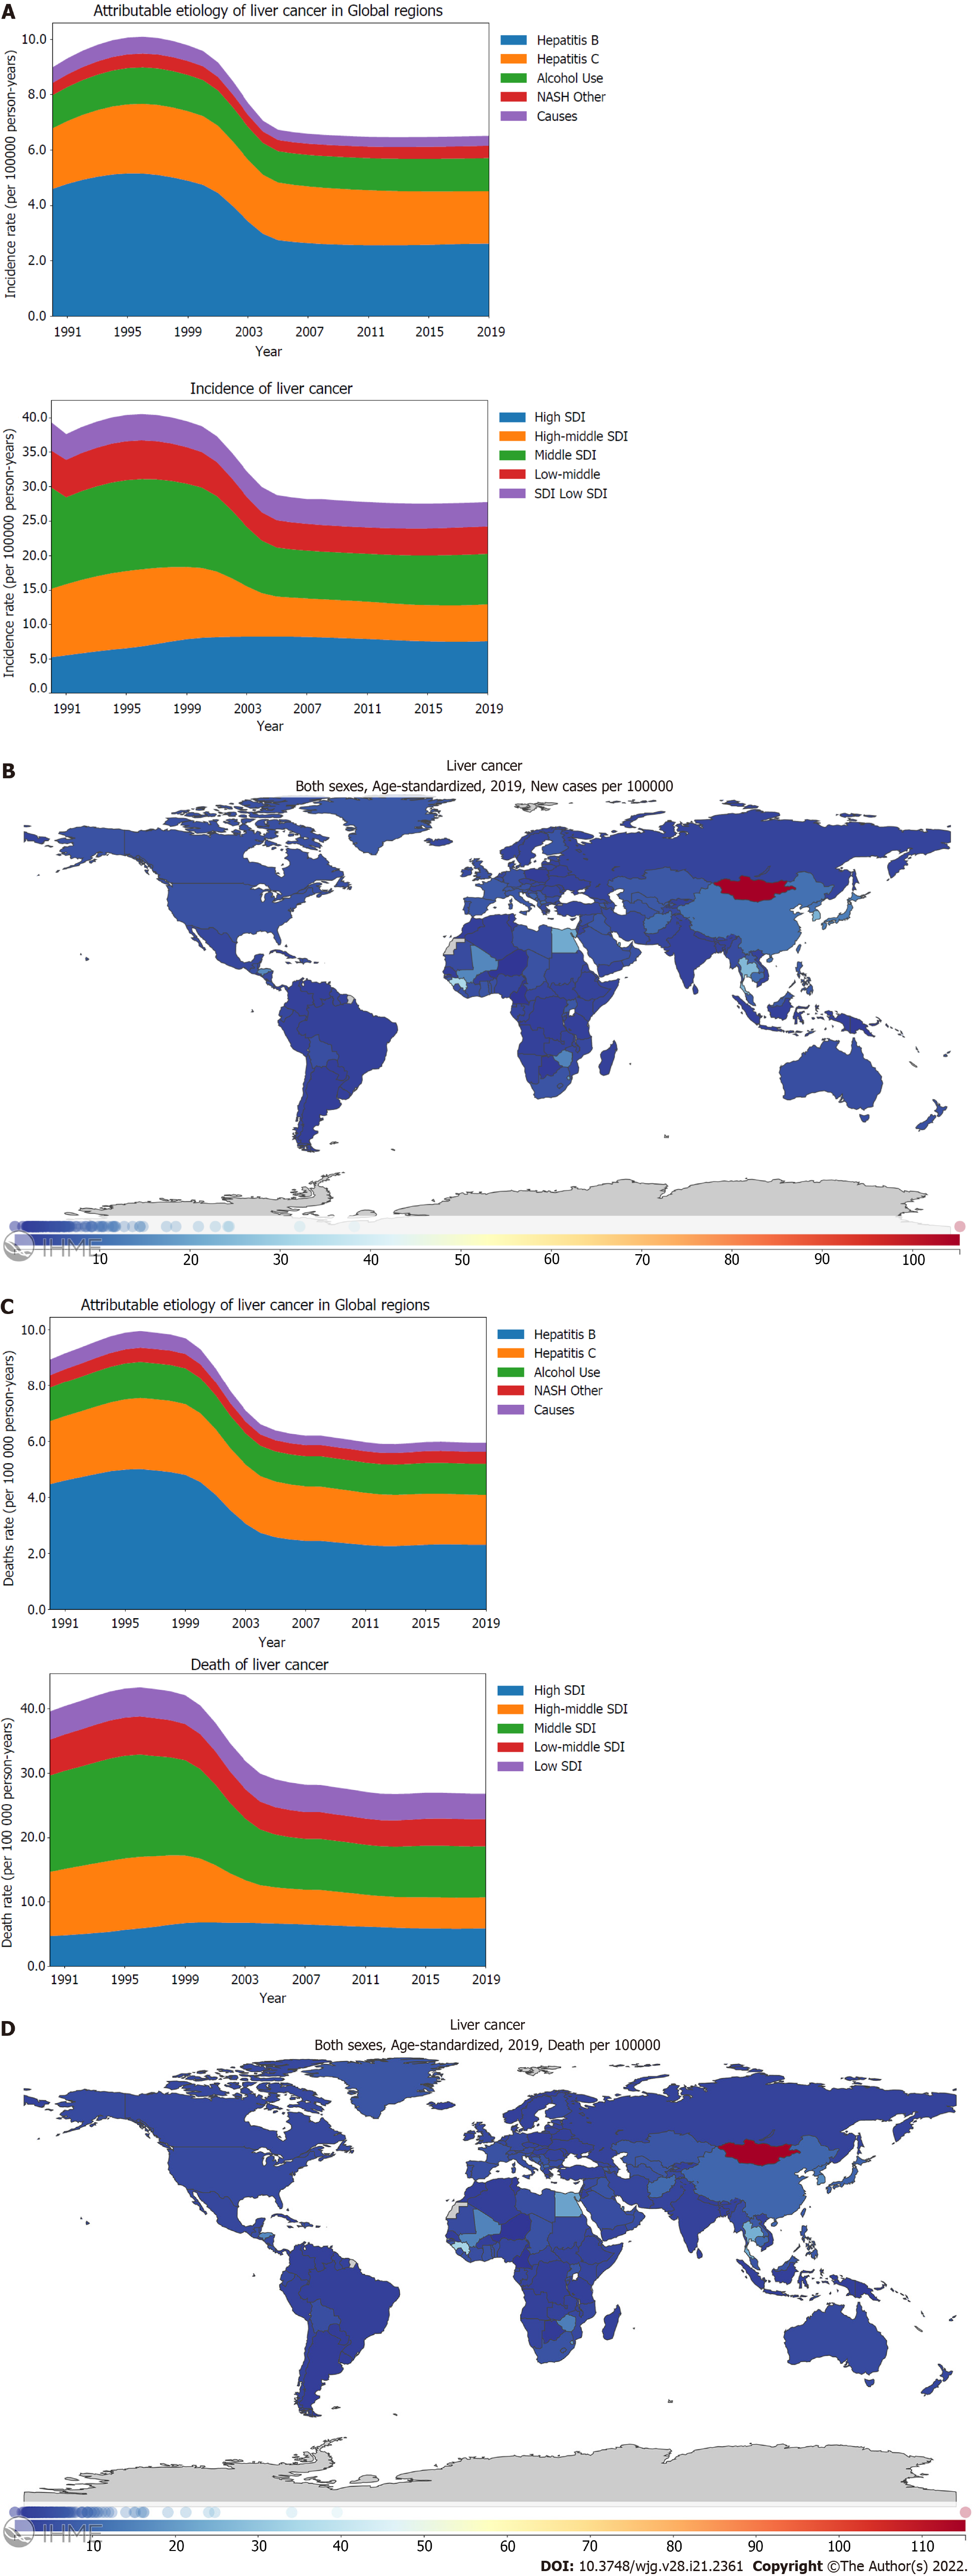
Figure 1 Burden of liver cancer for 204 countries and territories.
A and C: Age-standardized incidence (A) and death (C) rates per 100000 population for liver cancer from 1990 through 2019, stratified by the attributable etiology of liver cancer or the Socio-demographic Index; B and D: Age-standardized incidence (B) and death (D) rate of liver cancer per 100000 person-years by country and territory, in 2019. The maps in (B) and (D) are generated using the Global Burden of Disease 2019 tool. SDI: Socio-demographic Index; NASH: Nonalcoholic steatohepatitis.
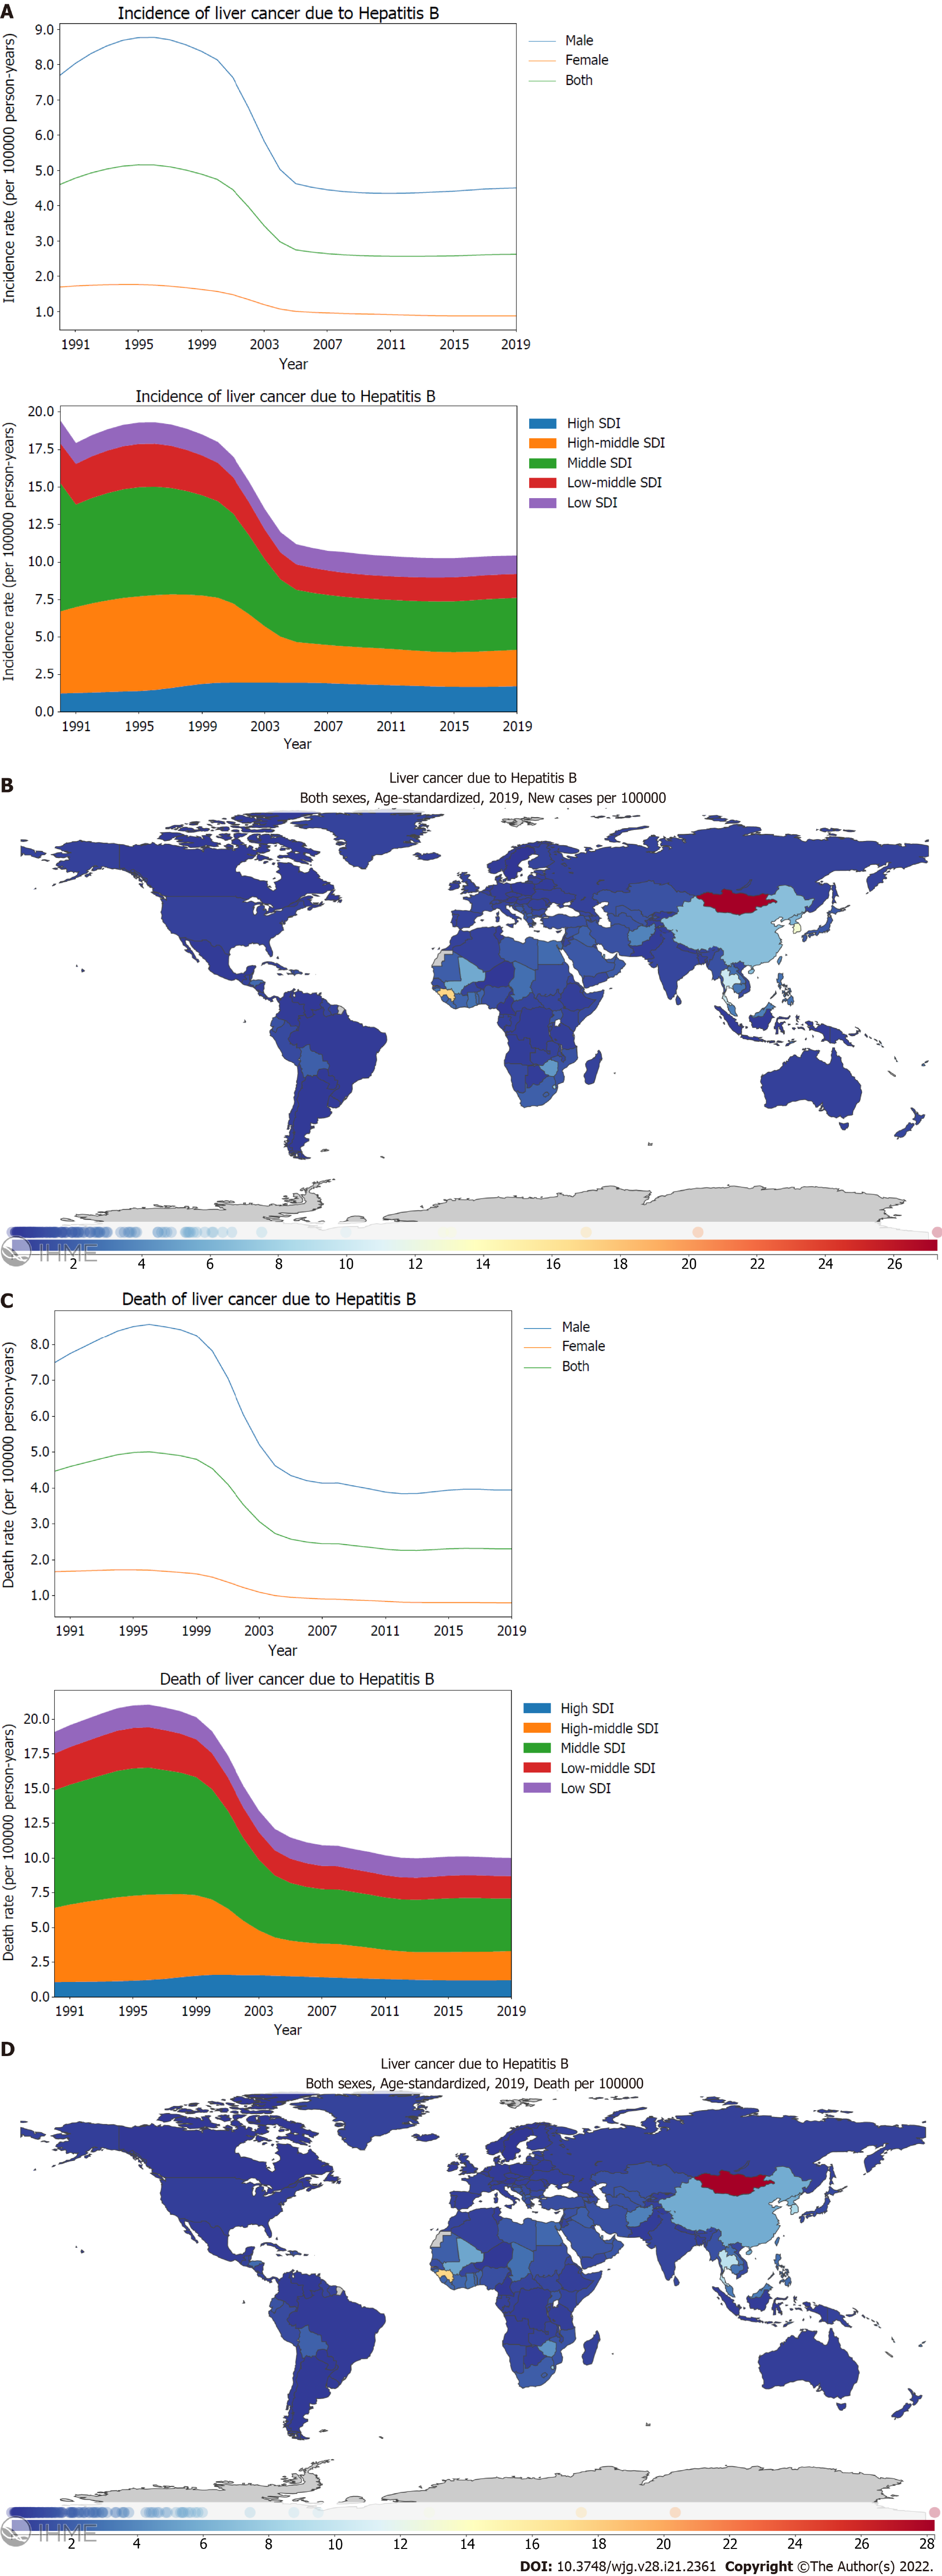
Figure 2 Burden of liver cancer caused by hepatitis B for 204 countries and territories.
A and C: Age-standardized incidence (A) and death (C) rates per 100000 population of liver cancer caused by hepatitis B from 1990 through 2019, stratified by sex or the Socio-demographic Index; B and D: Age-standardized incidence (B) and death (D) rate of liver cancer caused by hepatitis B per 100000 person-years by country and territory, in 2019. The maps in (B) and (D) are generated using the Global Burden of Disease 2019 tool. SDI: Socio-demographic Index.
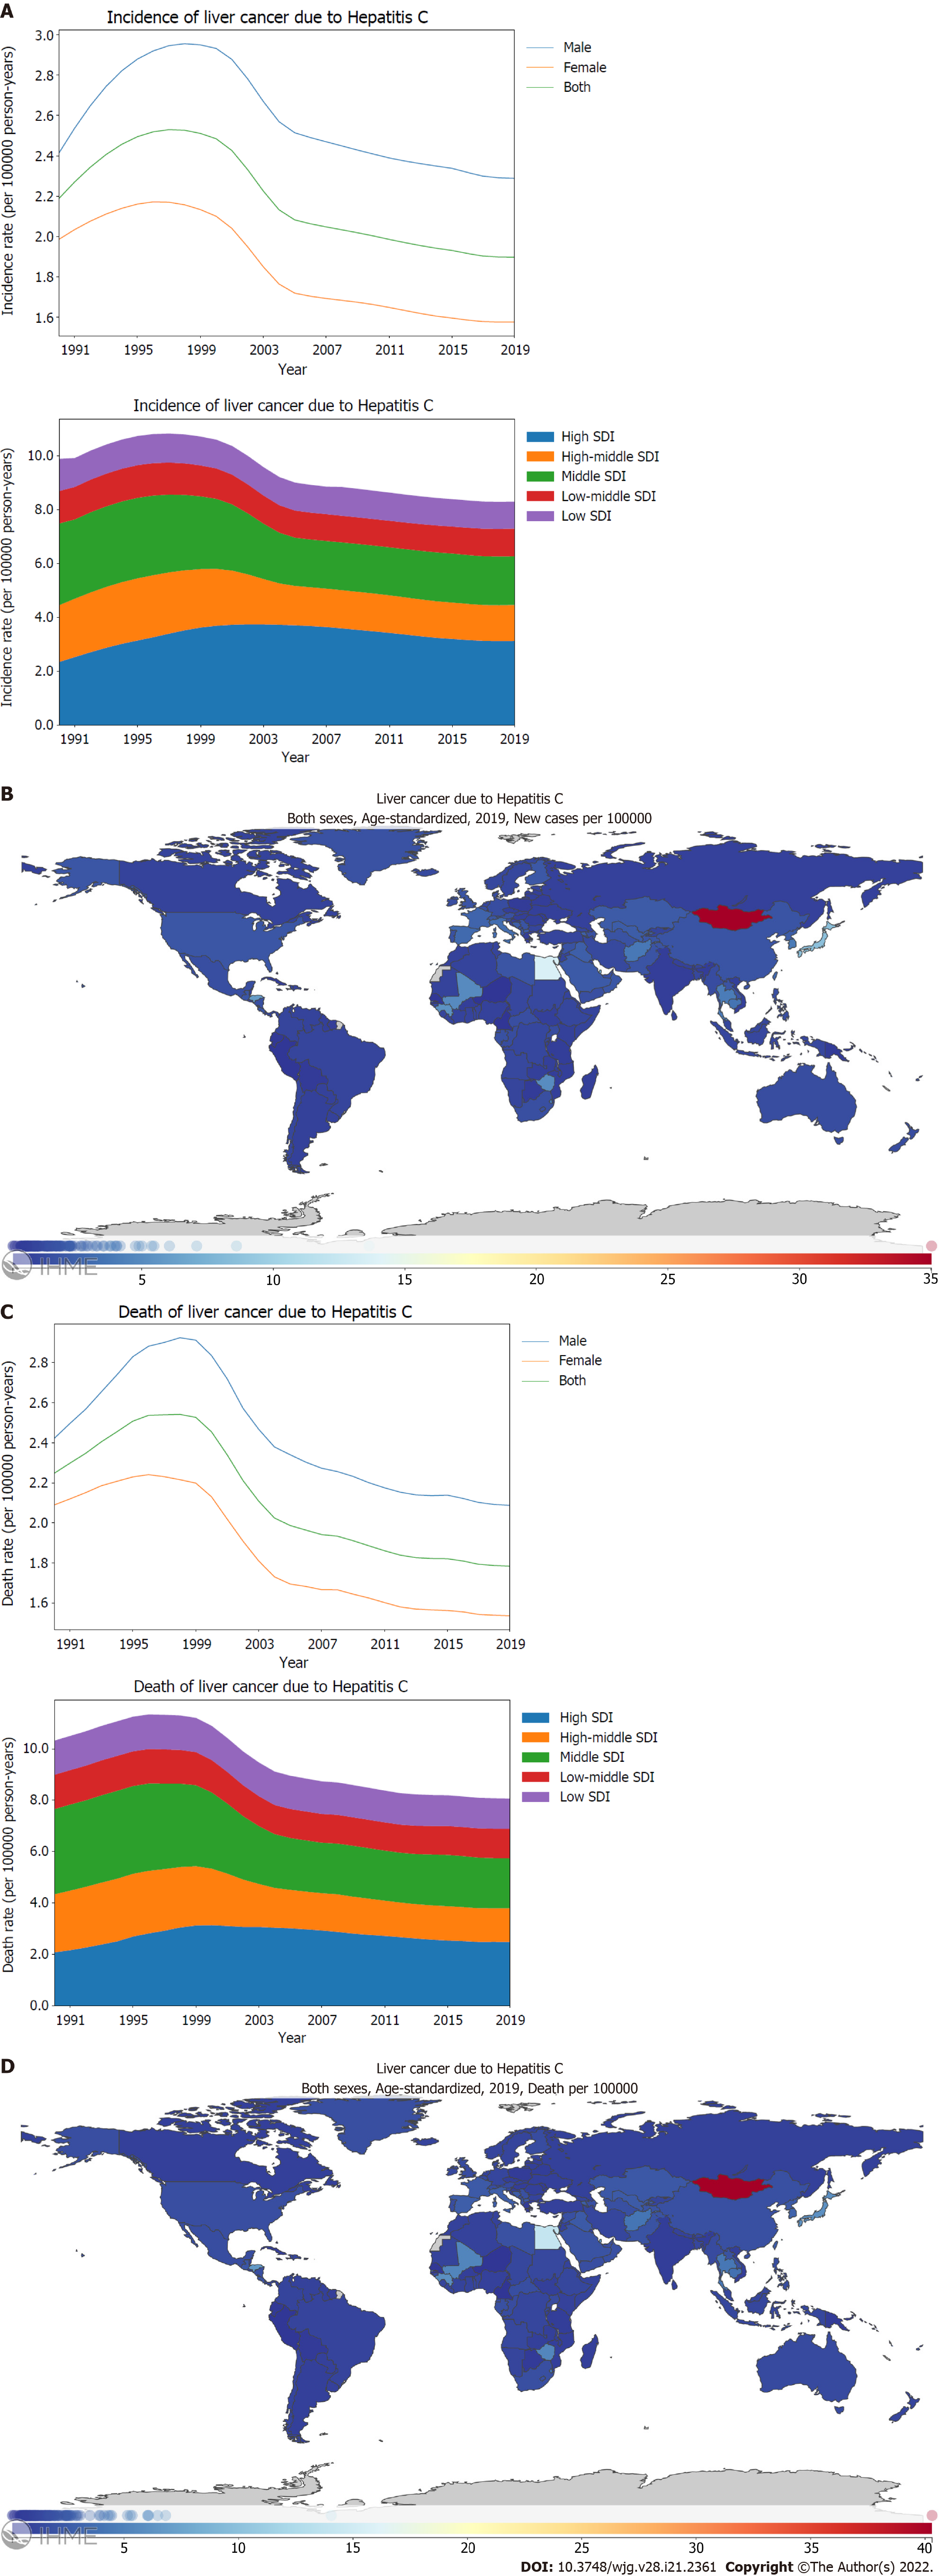
Figure 3 Burden of liver cancer caused by hepatitis C for 204 countries and territories.
A and C: Age-standardized incidence (A) and death (C) rate per 100000 population of liver cancer caused by hepatitis C from 1990 through 2019, stratified by sex or the Socio-demographic Index; B and D: Age-standardized incidence (B) and death (D) rate of liver cancer caused by hepatitis C per 100000 person-years by country and territory, in 2019. The maps in (B) and (D) are generated using the Global Burden of Disease 2019 tool. SDI: Socio-demographic Index.
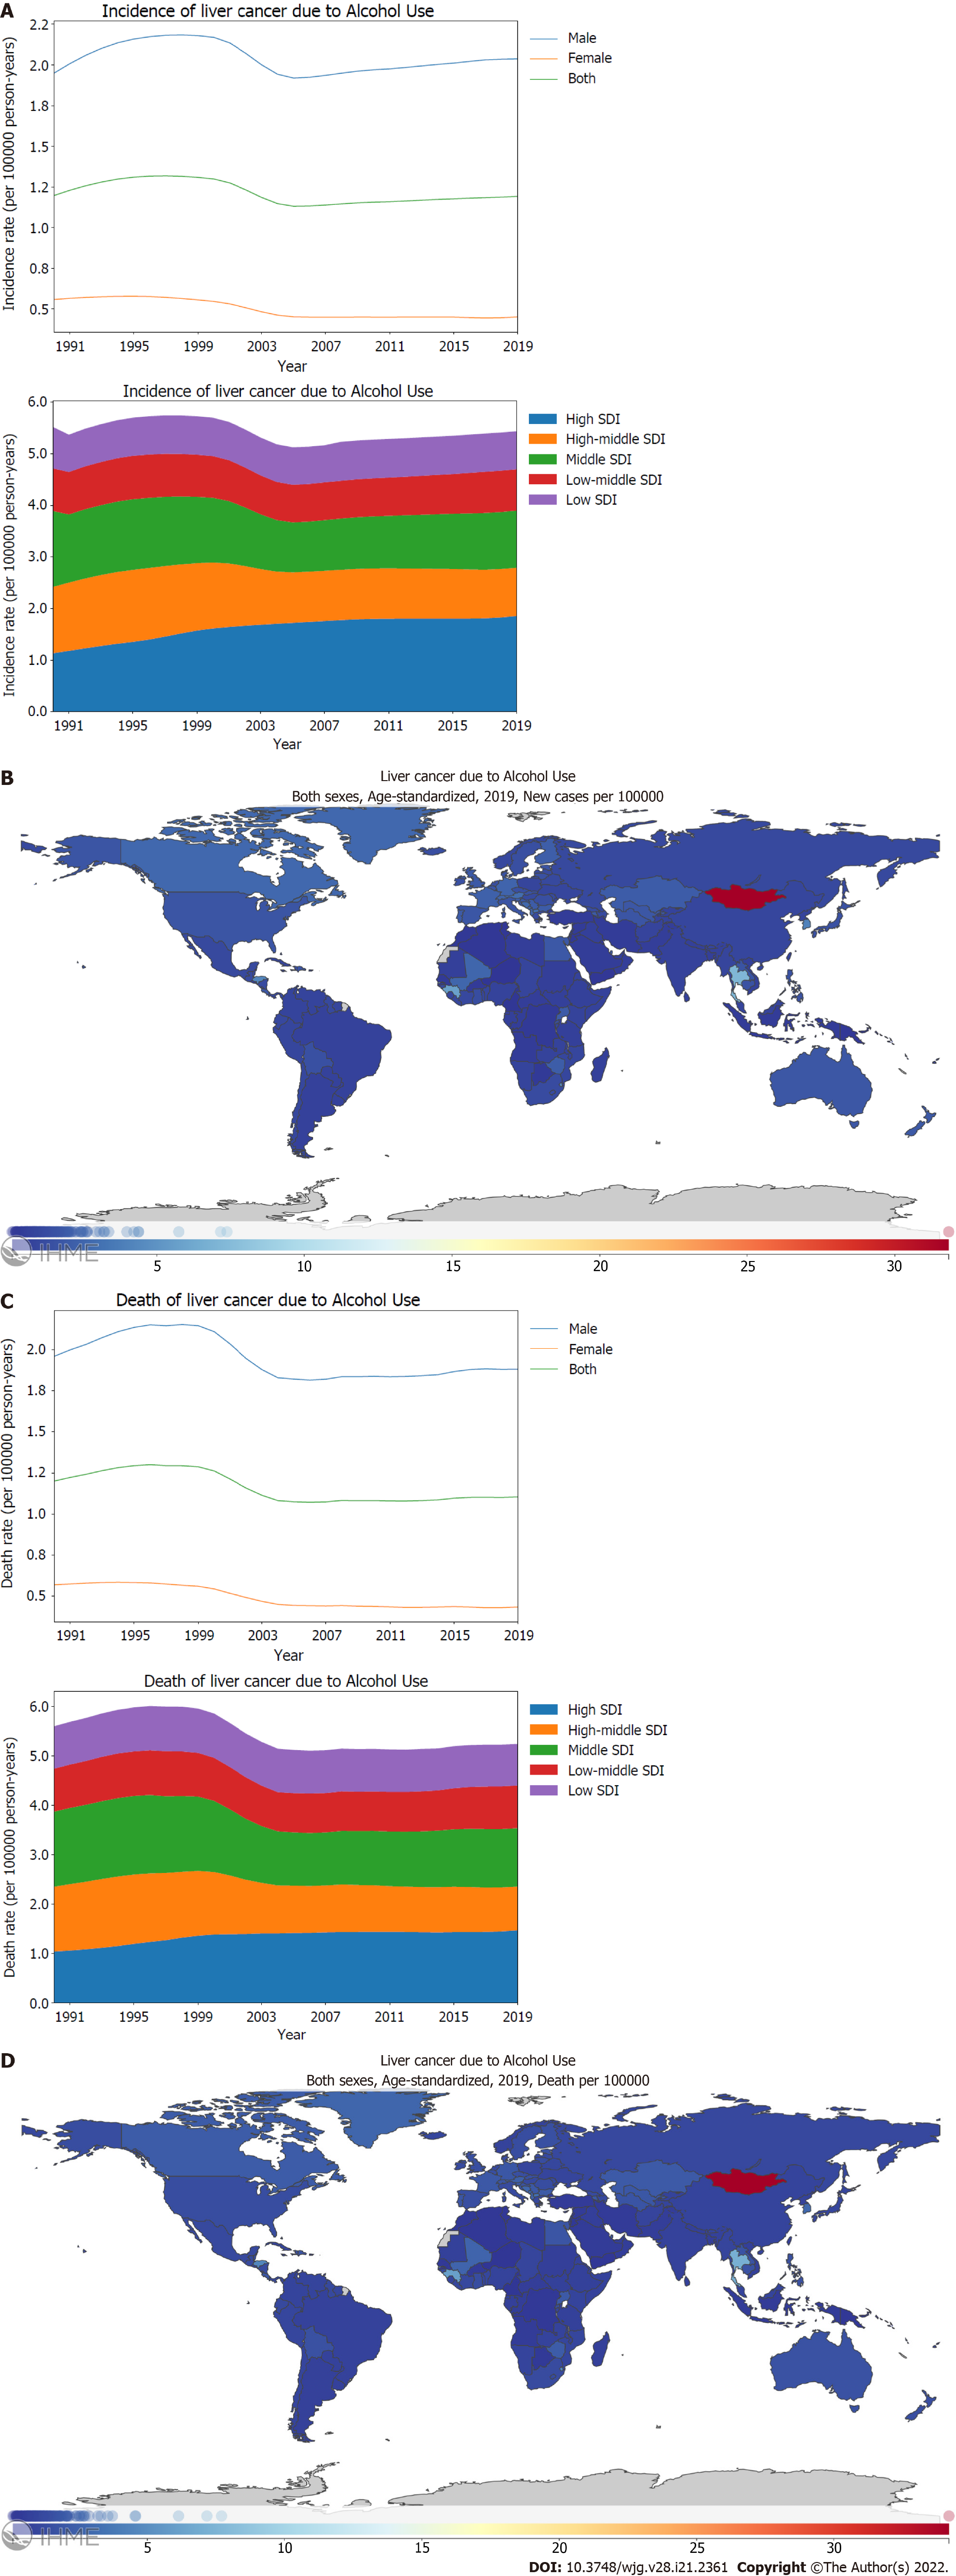
Figure 4 Burden of liver cancer attributed to alcohol use for 204 countries and territories.
A and C: Age-standardized incidence (A) and death (C) rate per 100000 population of liver cancer attributed to alcohol use from 1990 through 2019, stratified by sex or the Socio-demographic Index; B and D: Age-standardized incidence (B) and death (D) rate of liver cancer attributed to alcohol use per 100000 person-years by country and territory, in 2019. The maps in (B) and (D) are generated using the Global Burden of Disease 2019 tool. SDI: Socio-demographic Index.
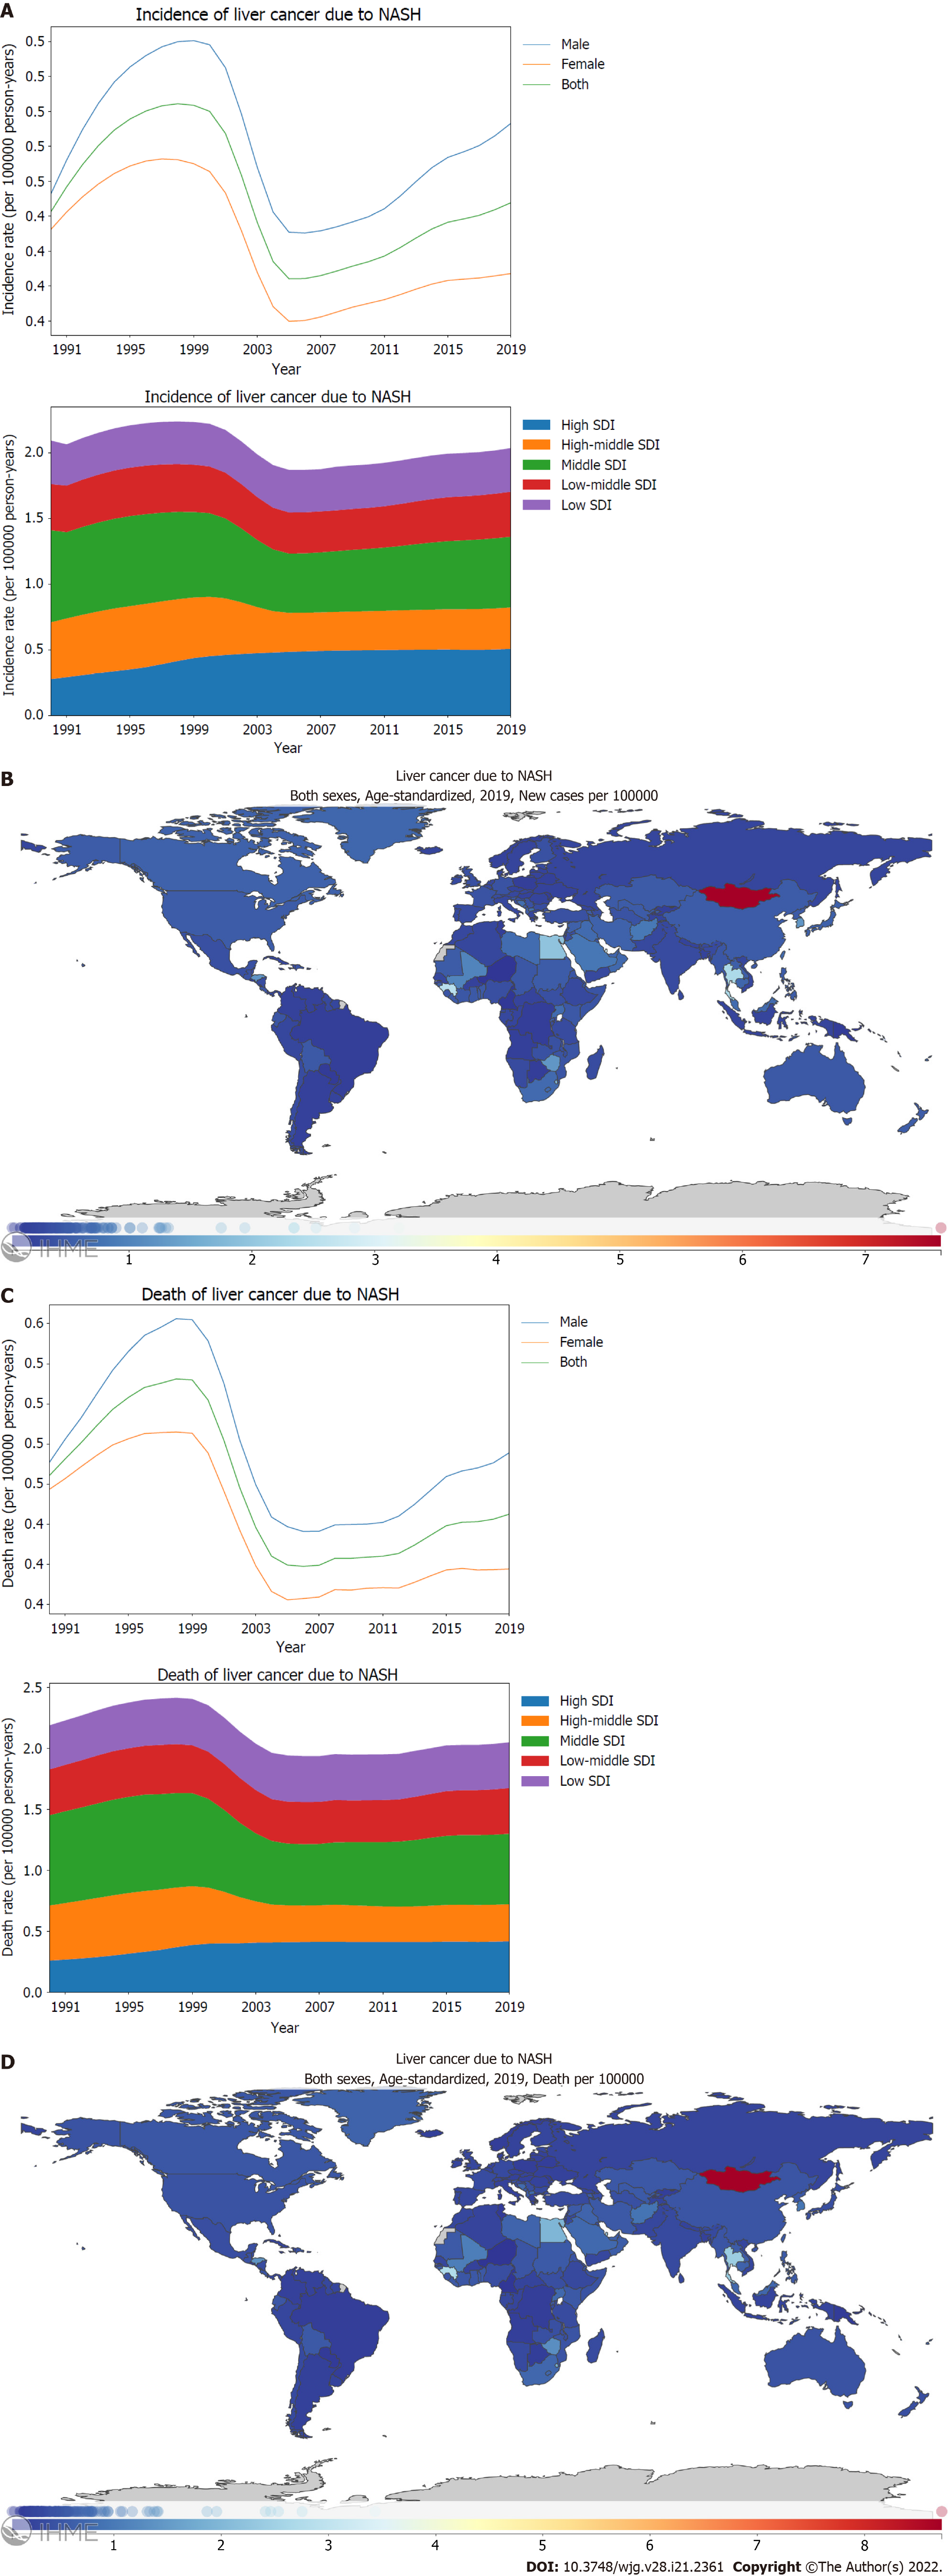
Figure 5 Burden of liver cancer attributed to nonalcoholic steatohepatitis for 204 countries and territories.
A and C: Age-standardized incidence (A) and death (C) rate per 100000 population of liver cancer attributed to nonalcoholic steatohepatitis (NASH) from 1990 through 2019, stratified by sex or the Socio-demographic Index; B and D: Age-standardized incidence (B) and death (D) rate of liver cancer attributed to NASH per 100000 person-years by country and territory, in 2019. The maps in (B) and (D) are generated using the Global Burden of Disease 2019 tool. SDI: Socio-demographic Index.
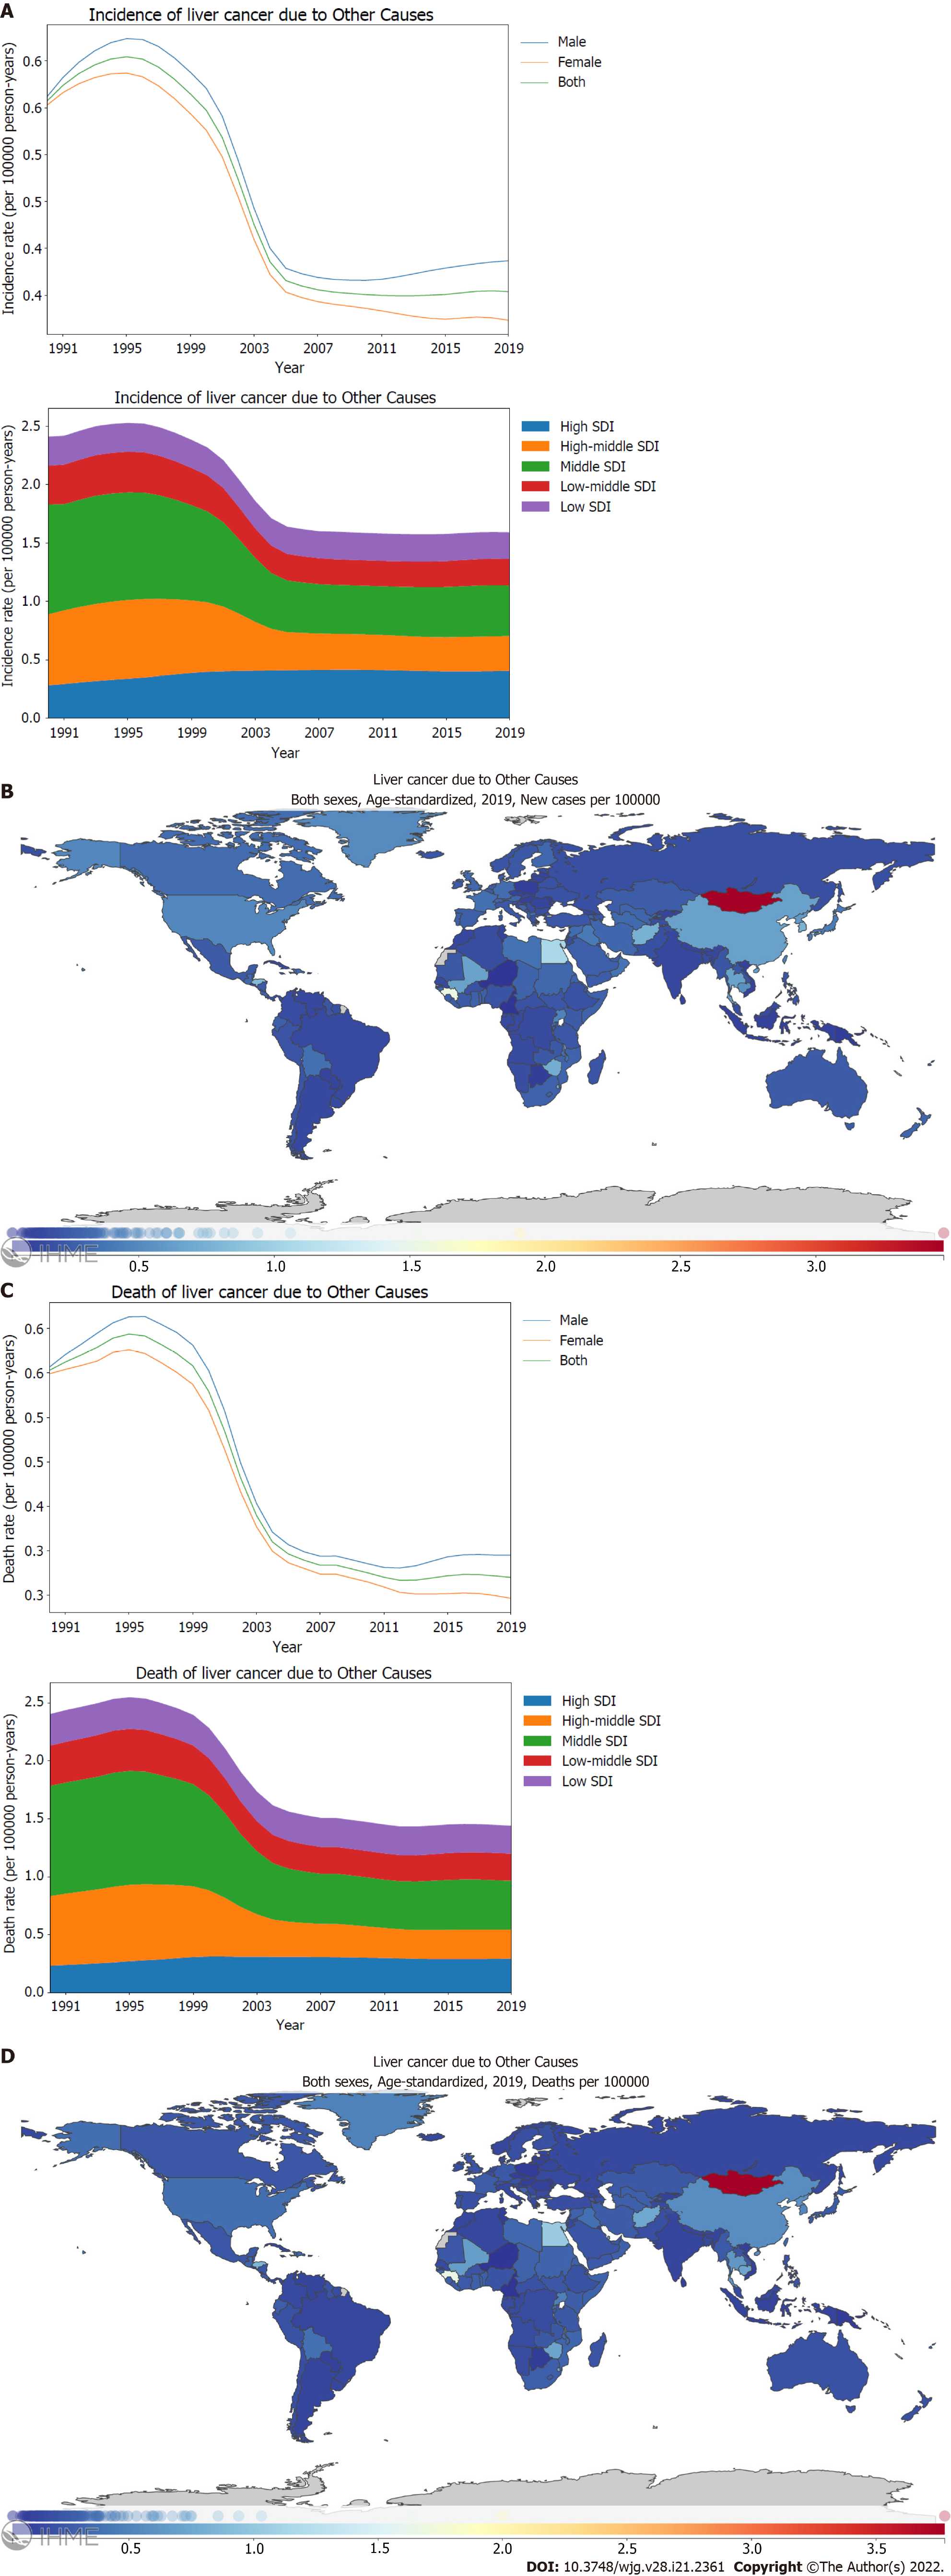
Figure 6 Burden of liver cancer attributed to other causes for 204 countries and territories.
A and C: Age-standardized incidence (A) and death (C) rate per 100000 population of liver cancer attributed to other cause from 1990 through 2019, stratified by sex or the Socio-demographic Index; B and D: Age-standardized incidence (B) and death (D) rate of liver cancer attributed to other causes per 100000 person-years by country and territory, in 2019. The maps in (B) and (D) are generated using the Global Burden of Disease 2019 tool. SDI: Socio-demographic Index.
- Citation: Xing QQ, Li JM, Dong X, Zeng DY, Chen ZJ, Lin XY, Pan JS. Socioeconomics and attributable etiology of primary liver cancer, 1990-2019. World J Gastroenterol 2022; 28(21): 2361-2382
- URL: https://www.wjgnet.com/1007-9327/full/v28/i21/2361.htm
- DOI: https://dx.doi.org/10.3748/wjg.v28.i21.2361


