Copyright
©The Author(s) 2021.
World J Gastroenterol. Feb 7, 2021; 27(5): 391-403
Published online Feb 7, 2021. doi: 10.3748/wjg.v27.i5.391
Published online Feb 7, 2021. doi: 10.3748/wjg.v27.i5.391
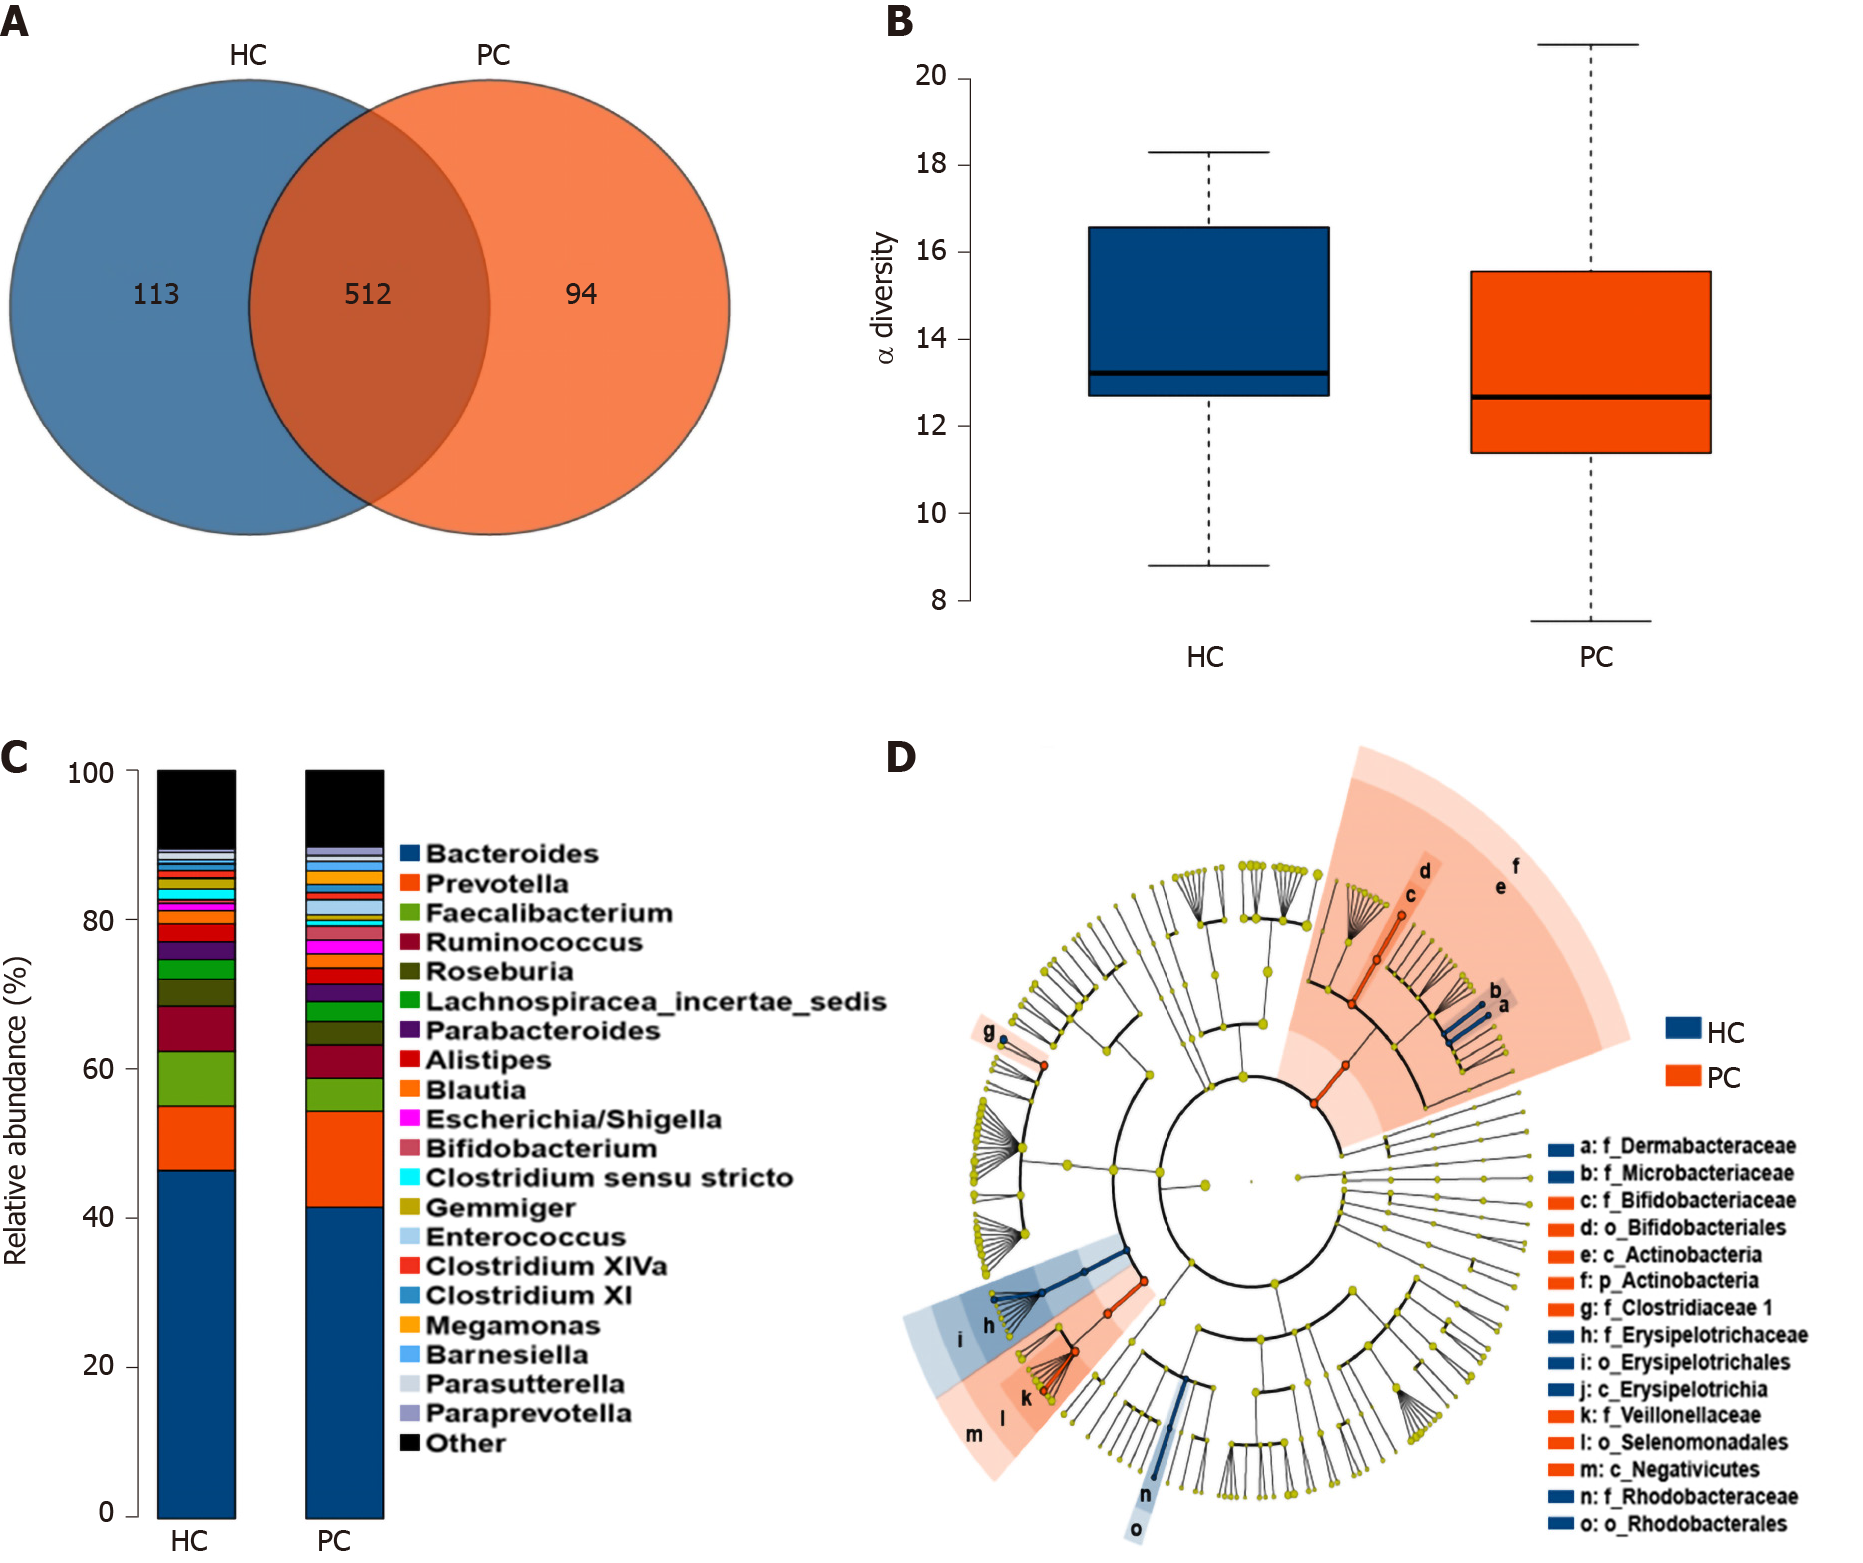
Figure 1 Comparison of gut microbiota structure and abundance between the healthy control and post-cholecystectomy groups.
A: Venn diagram comparing the operational taxonomic units in the fecal microbiota between the two groups; B: Phylogenetic diversity tree used to estimate the diversity of the gut microbiota; C: Profiling of bacterial taxa at the genus level; D: Logarithmic linear discriminant analysis score identifying the taxa with the greatest differences in abundance between the healthy control and post-cholecystectomy groups. The brightness of each dot is proportional to the effect size. HC: Healthy control; PC: Post-cholecystectomy.
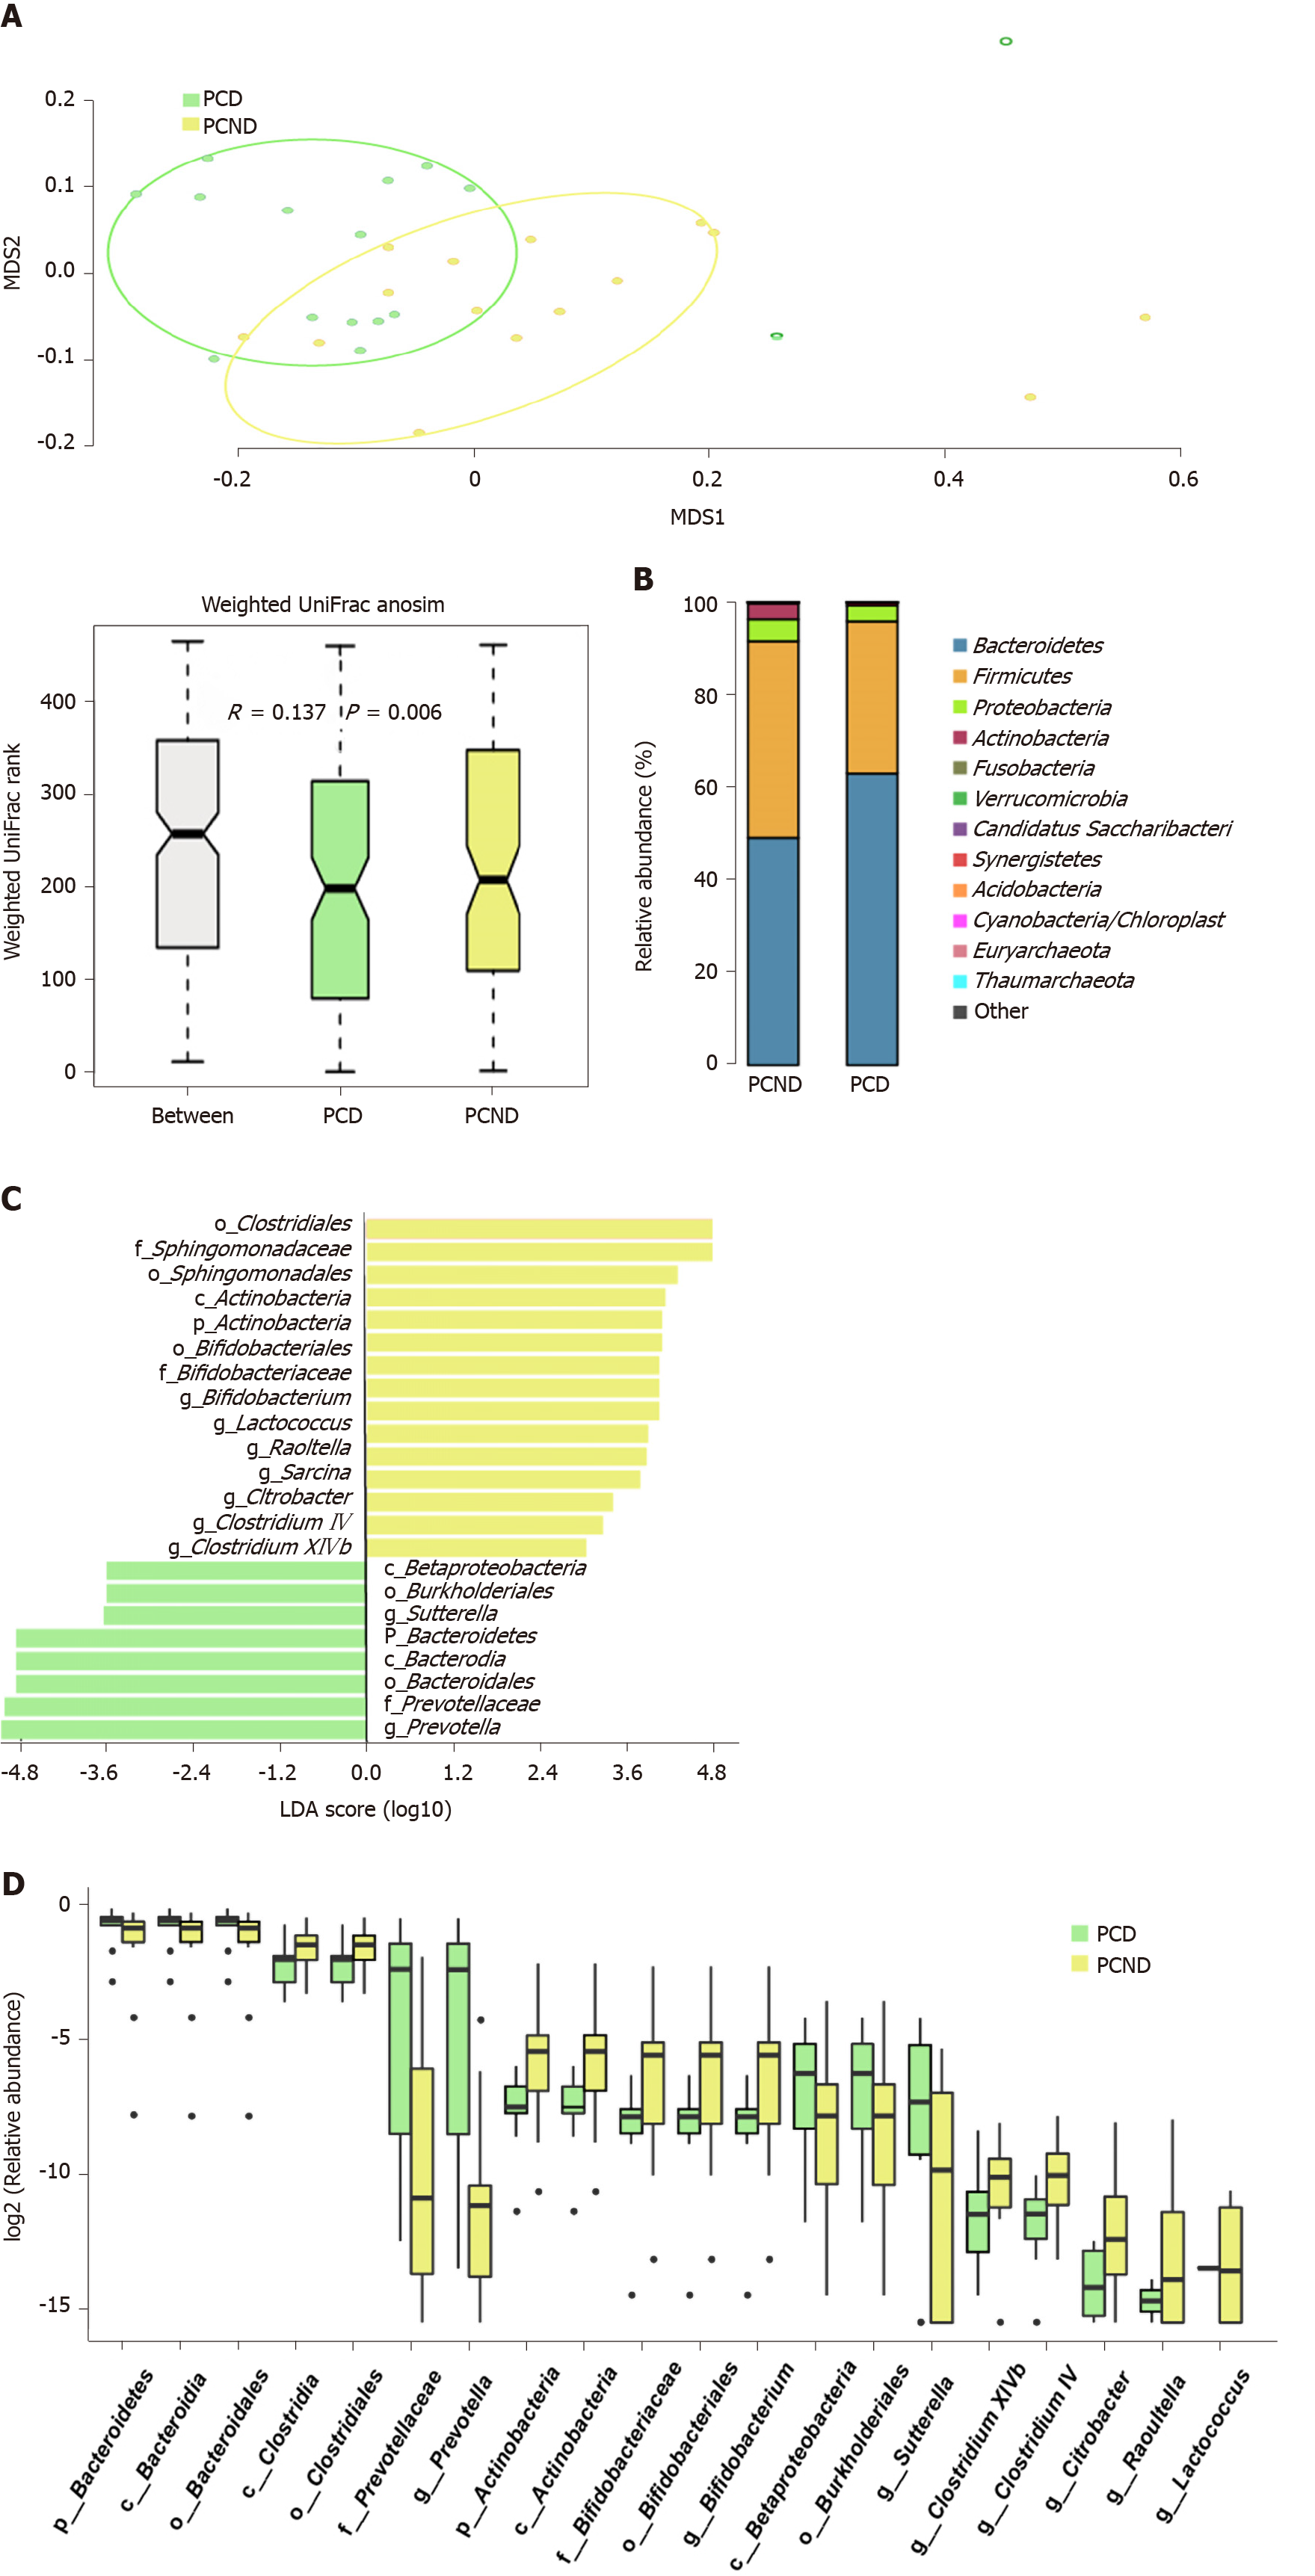
Figure 2 Comparison of gut microbiota structure and abundance between the post-cholecystectomy diarrhea and post-cholecystectomy non-diarrhea groups.
A: Differences between and within post-cholecystectomy diarrhea (PCD) and post-cholecystectomy non-diarrhea (PCND) groups were assessed by one-way analysis of similarities and nonmetric multidimensional scaling analysis of the gut microbiota based on the weighted UniFrac metric; B: Comparison of the relative abundance at the phylum level between the PCD and PCND groups; C: Linear discriminant analysis effect size analysis showing the taxa with the greatest differences in abundance between the PCD and PCND groups. Green bars: PCD group-enriched taxa; yellow bars: PCND group-enriched taxa. The brightness of each dot is proportional to the effect size; D: Box plots showing the relative abundance of the top 20 microbial taxa with differential abundance. PCD: Post-cholecystectomy diarrhea; PCND: Post-cholecystectomy non-diarrhea; LDA: Linear discriminant analysis.
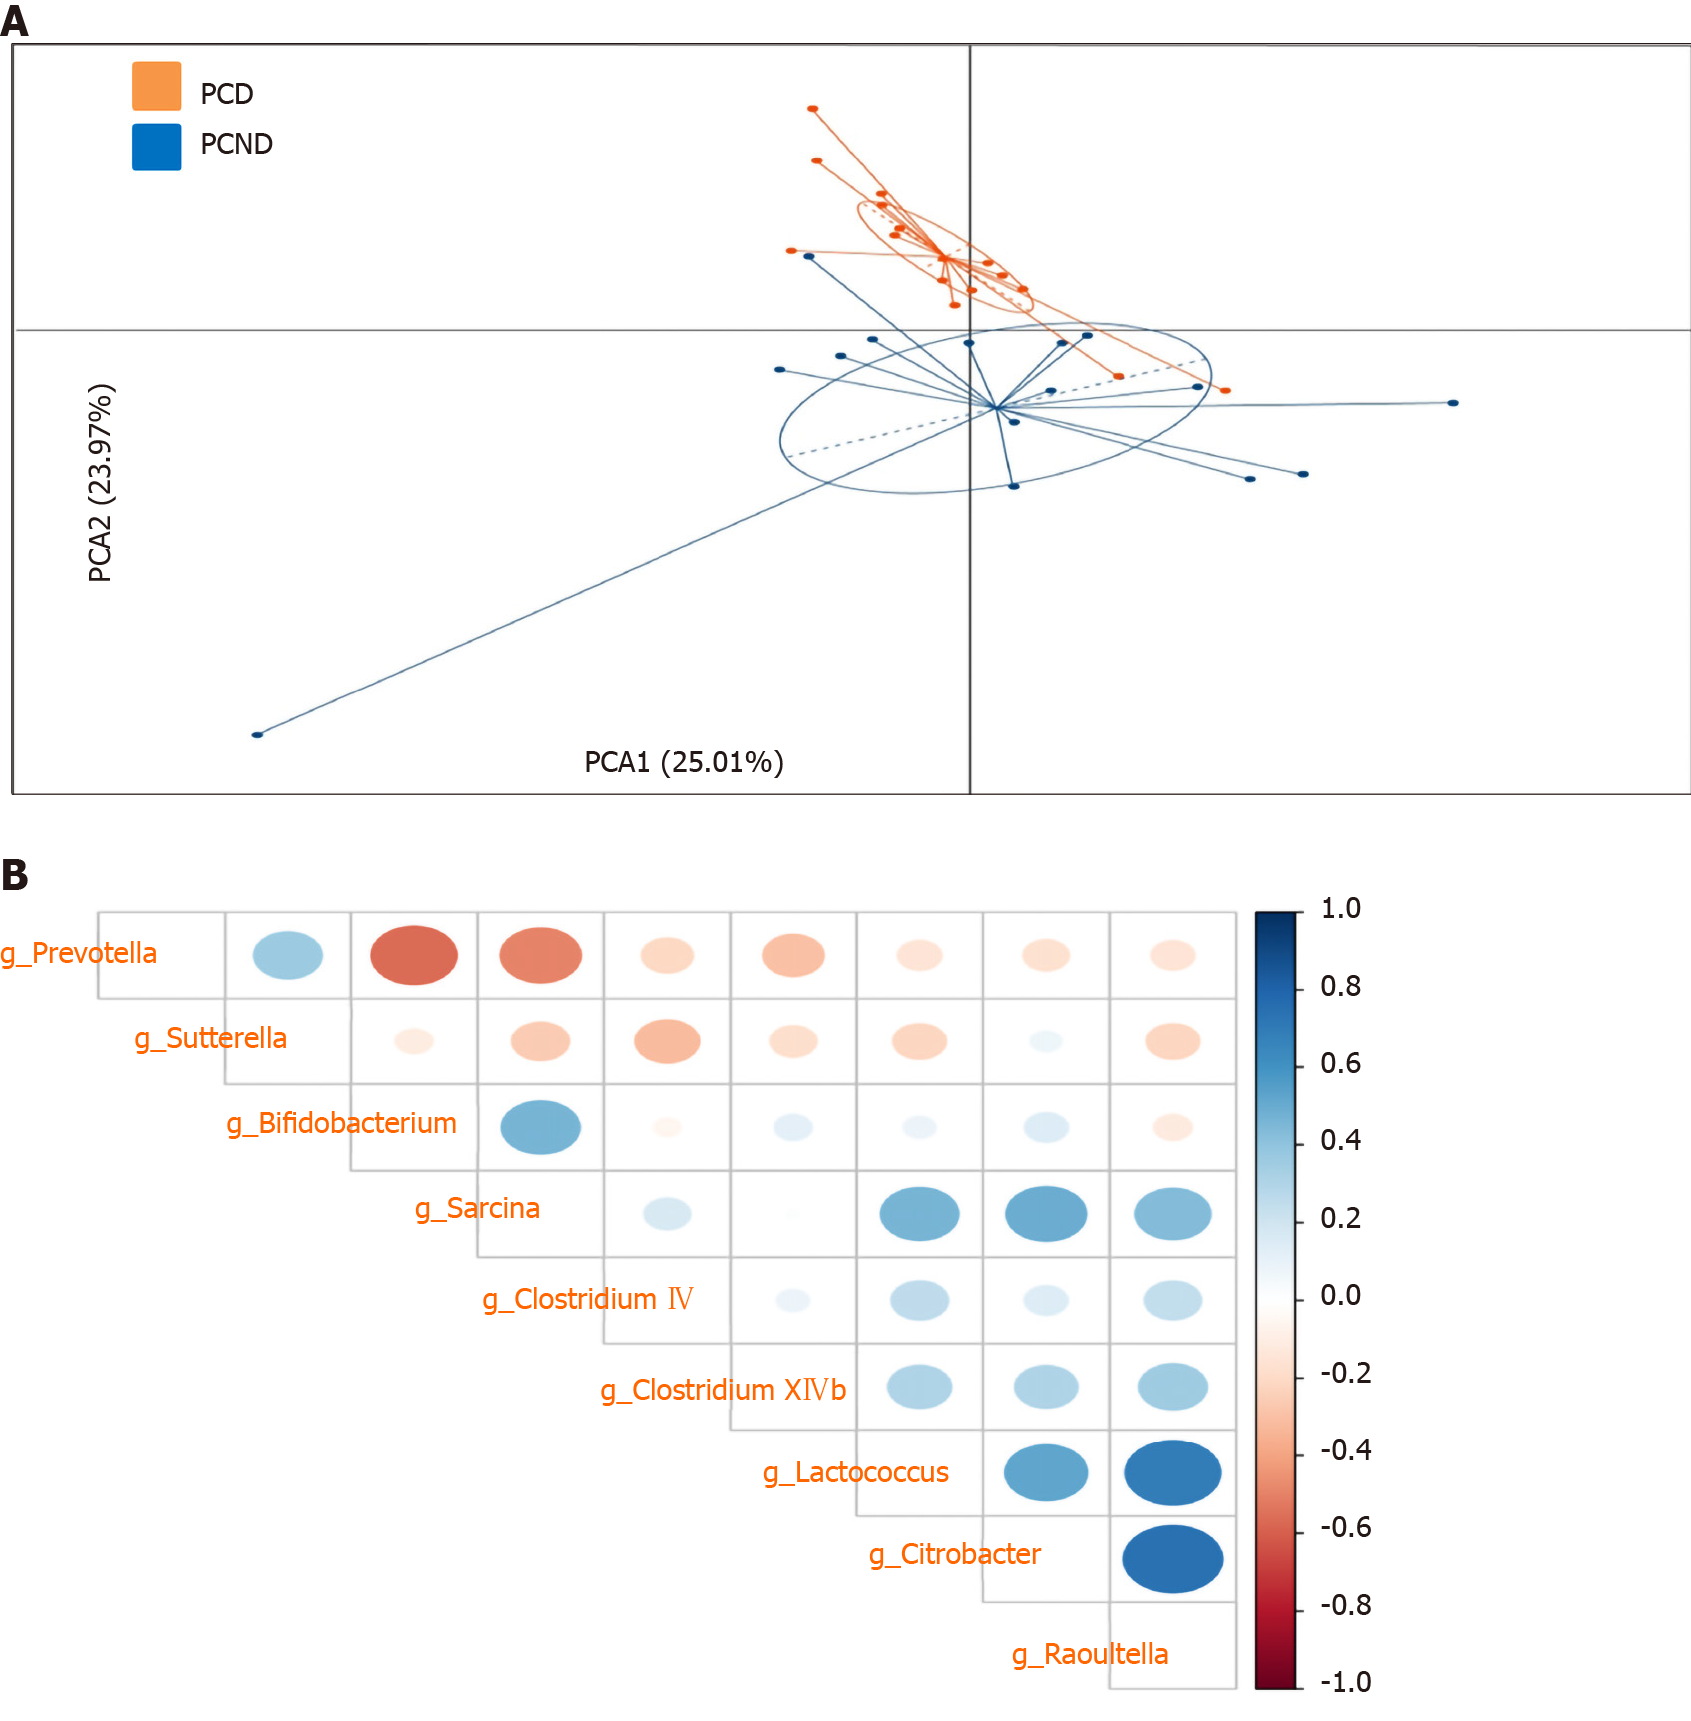
Figure 3 Principal component analyses and correlation plots of different microbial taxa in the post-cholecystectomy diarrhea and post-cholecystectomy non-diarrhea groups.
A: Principal component analysis plot of different taxa in the post-cholecystectomy diarrhea and post-cholecystectomy non-diarrhea groups; B: Spearman’s correlation plots of the relative abundances of the differentially abundant bacteria at the genus level. Statistical significance was determined for all pairwise comparisons. Positive values (blue circles) indicate positive correlations, and negative values (red circles) indicate negative correlations. The shade and size of each circle indicate the magnitude of the correlation (with darker shades indicating higher correlations). PCD: Post-cholecystectomy diarrhea; PCND: Post-cholecystectomy non-diarrhea.
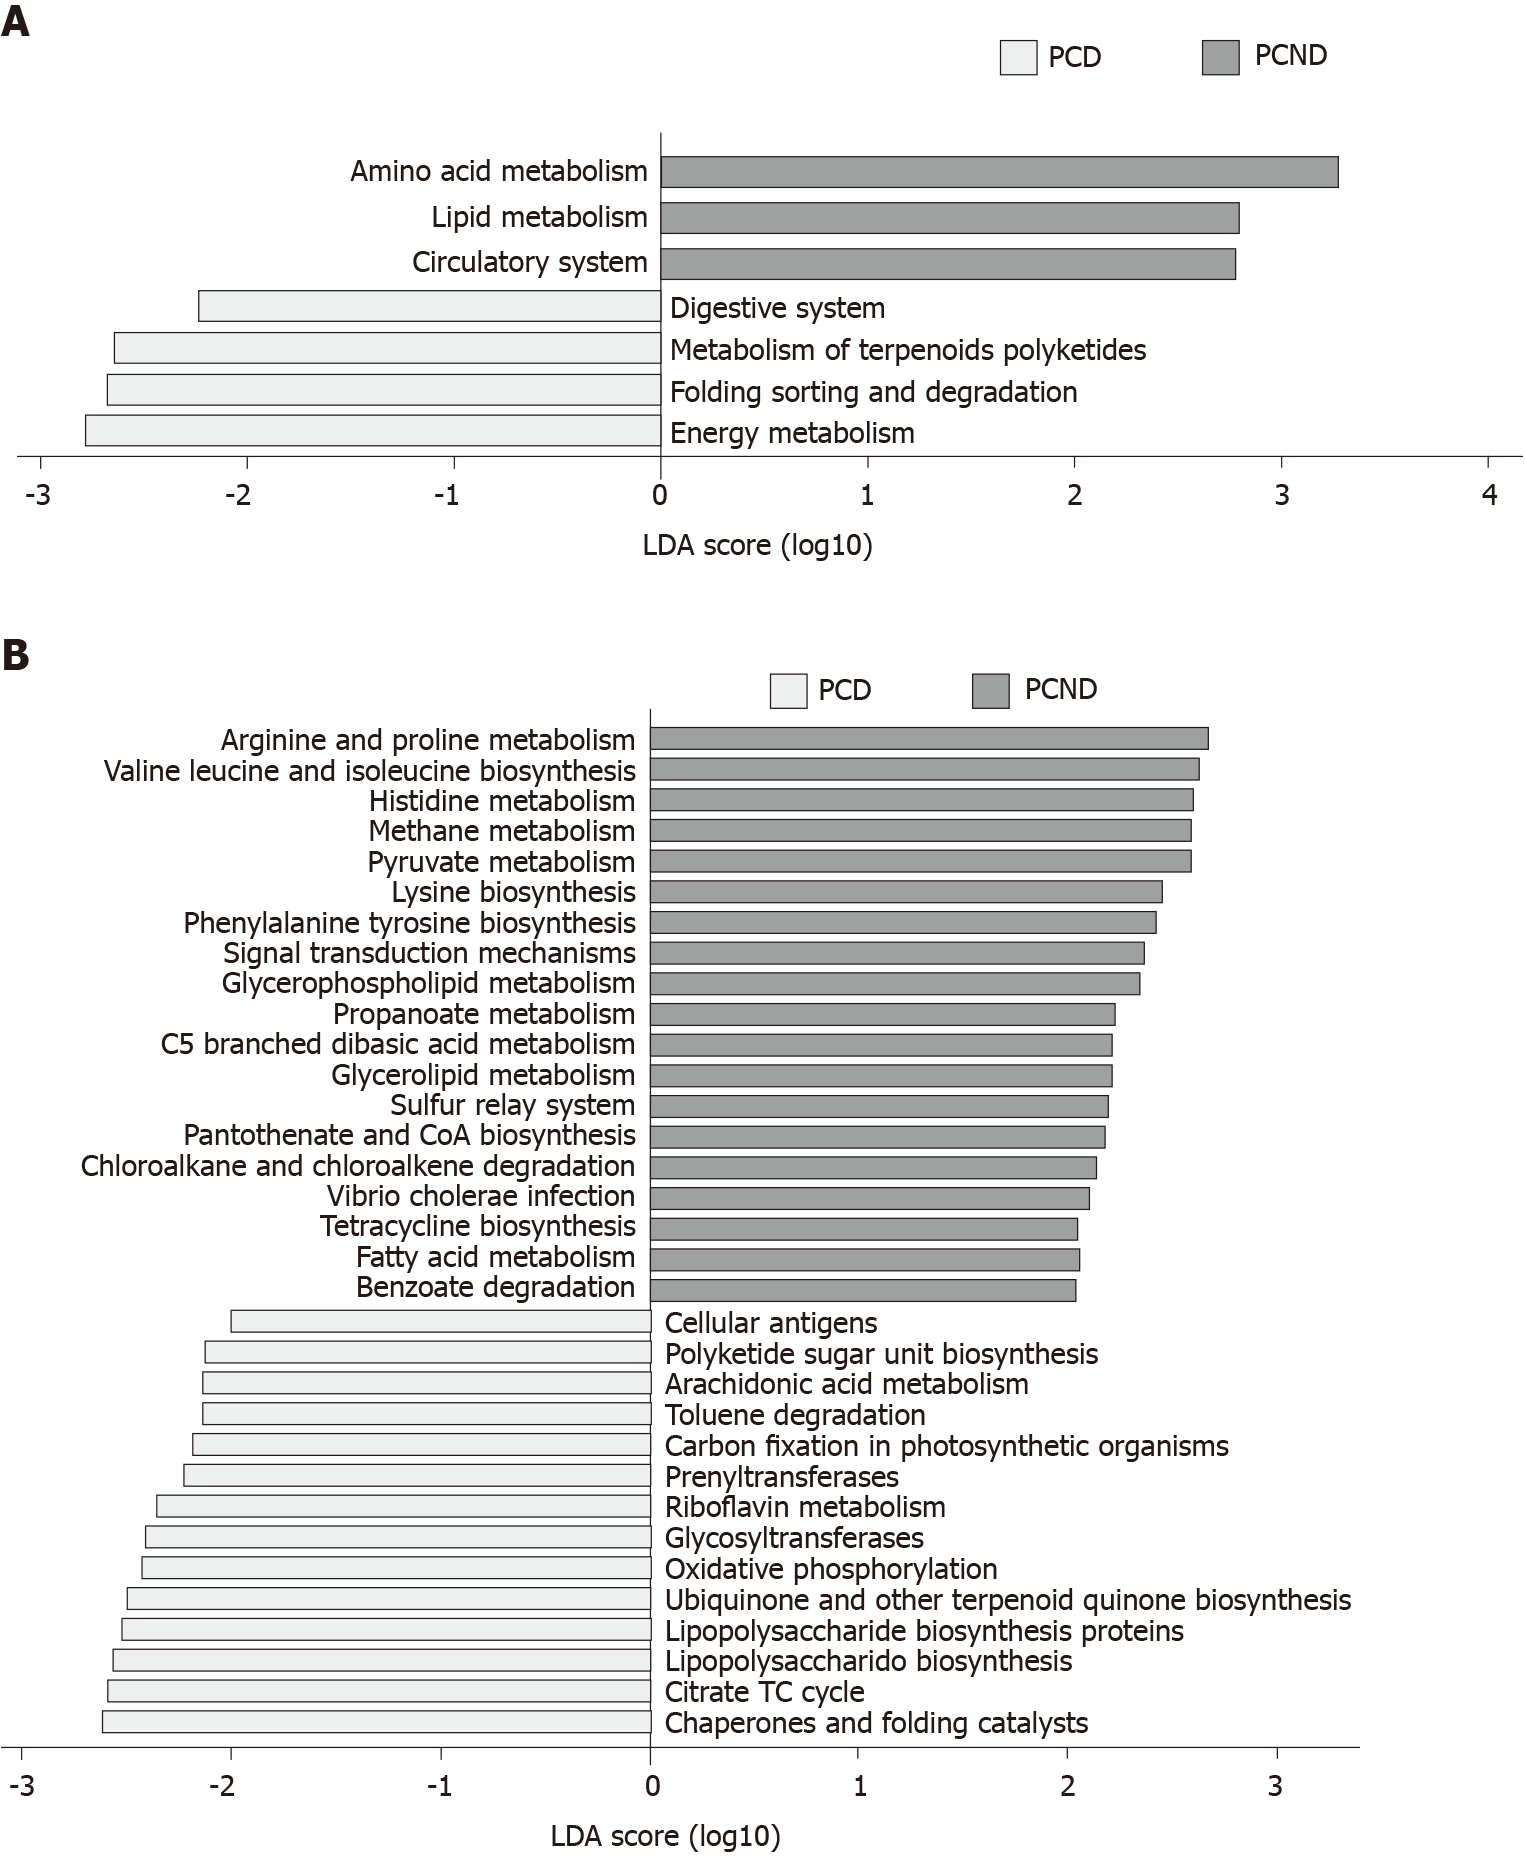
Figure 4 Kyoto Encyclopedia of Genes and Genomes functional categories of microbiota with differential abundance.
A: Comparison between the post-cholecystectomy diarrhea-enriched and post-cholecystectomy non-diarrhea-enriched markers regarding the Kyoto Encyclopedia of Genes and Genomes level 2 functional categories; B: Comparison between the post-cholecystectomy diarrhea-enriched and post-cholecystectomy non-diarrhea-enriched markers regarding the Kyoto Encyclopedia of Genes and Genomes level 3 functional categories. PCD: Post-cholecystectomy diarrhea; PCND: Post-cholecystectomy non-diarrhea; LDA: Linear discriminant analysis.
- Citation: Li YD, Liu BN, Zhao SH, Zhou YL, Bai L, Liu EQ. Changes in gut microbiota composition and diversity associated with post-cholecystectomy diarrhea. World J Gastroenterol 2021; 27(5): 391-403
- URL: https://www.wjgnet.com/1007-9327/full/v27/i5/391.htm
- DOI: https://dx.doi.org/10.3748/wjg.v27.i5.391


