Copyright
©The Author(s) 2019.
World J Gastroenterol. Jul 28, 2019; 25(28): 3753-3763
Published online Jul 28, 2019. doi: 10.3748/wjg.v25.i28.3753
Published online Jul 28, 2019. doi: 10.3748/wjg.v25.i28.3753
Figure 1 Pathogenesis of pyrrolizidine alkaloids-induced hepatic sinusoidal obstruction syndrome.
A: Oral PAs are transported into the liver, metabolites bind with glutathione, resulting in detoxification, or combine with protein to generate PPAs; B: In HSECs, PPAs cause depolymerization of F-actin and release of MMP-9, which damages HSECs; C: Injured HSECs round up, MMP-9 triggers degradation of extracellular matrix, then gaps between HSECs appear, blood cells penetrate the gaps into the space of Disse, and sinusoidal lining cells obstruct the sinusoidal flow, resulting in postsinusoidal portal hypertension. PAs: Pyrrolizidine alkaloids; GSH: Glutathione; PPAs: Protein-pyrrole adducts; HSECs: Hepatic sinusoidal endothelial cells; MMP-9: Matrix metalloproteinase-9; ECM: Extracellular matrix; DHPAs: Dehydropyrrolizidine alkaloids; DHR: Dehydroretronecine; HSOS: Hepatic sinusoidal obstruction syndrome.
Figure 2 A 53-year-old man with pyrrolizidine alkaloids-induced hepatic sinusoidal obstruction syndrome who received contrast-enhanced computed tomography.
A: Image of plain phase. The imaging signs included hepatomegaly, ascites (white star), heterogeneous hypodensity (white arrow); B and C: Image of equilibrium phase. Gallbladder wall thickening (white arrow, B), patchy liver enhancement, “claw-shaped” enhancement surrounding hepatic veins (white arrow, C), obscuring of hepatic main veins; D: Sagittal images. Stenosis of hepatic segmental inferior vena cava (white arrow) was indicated.
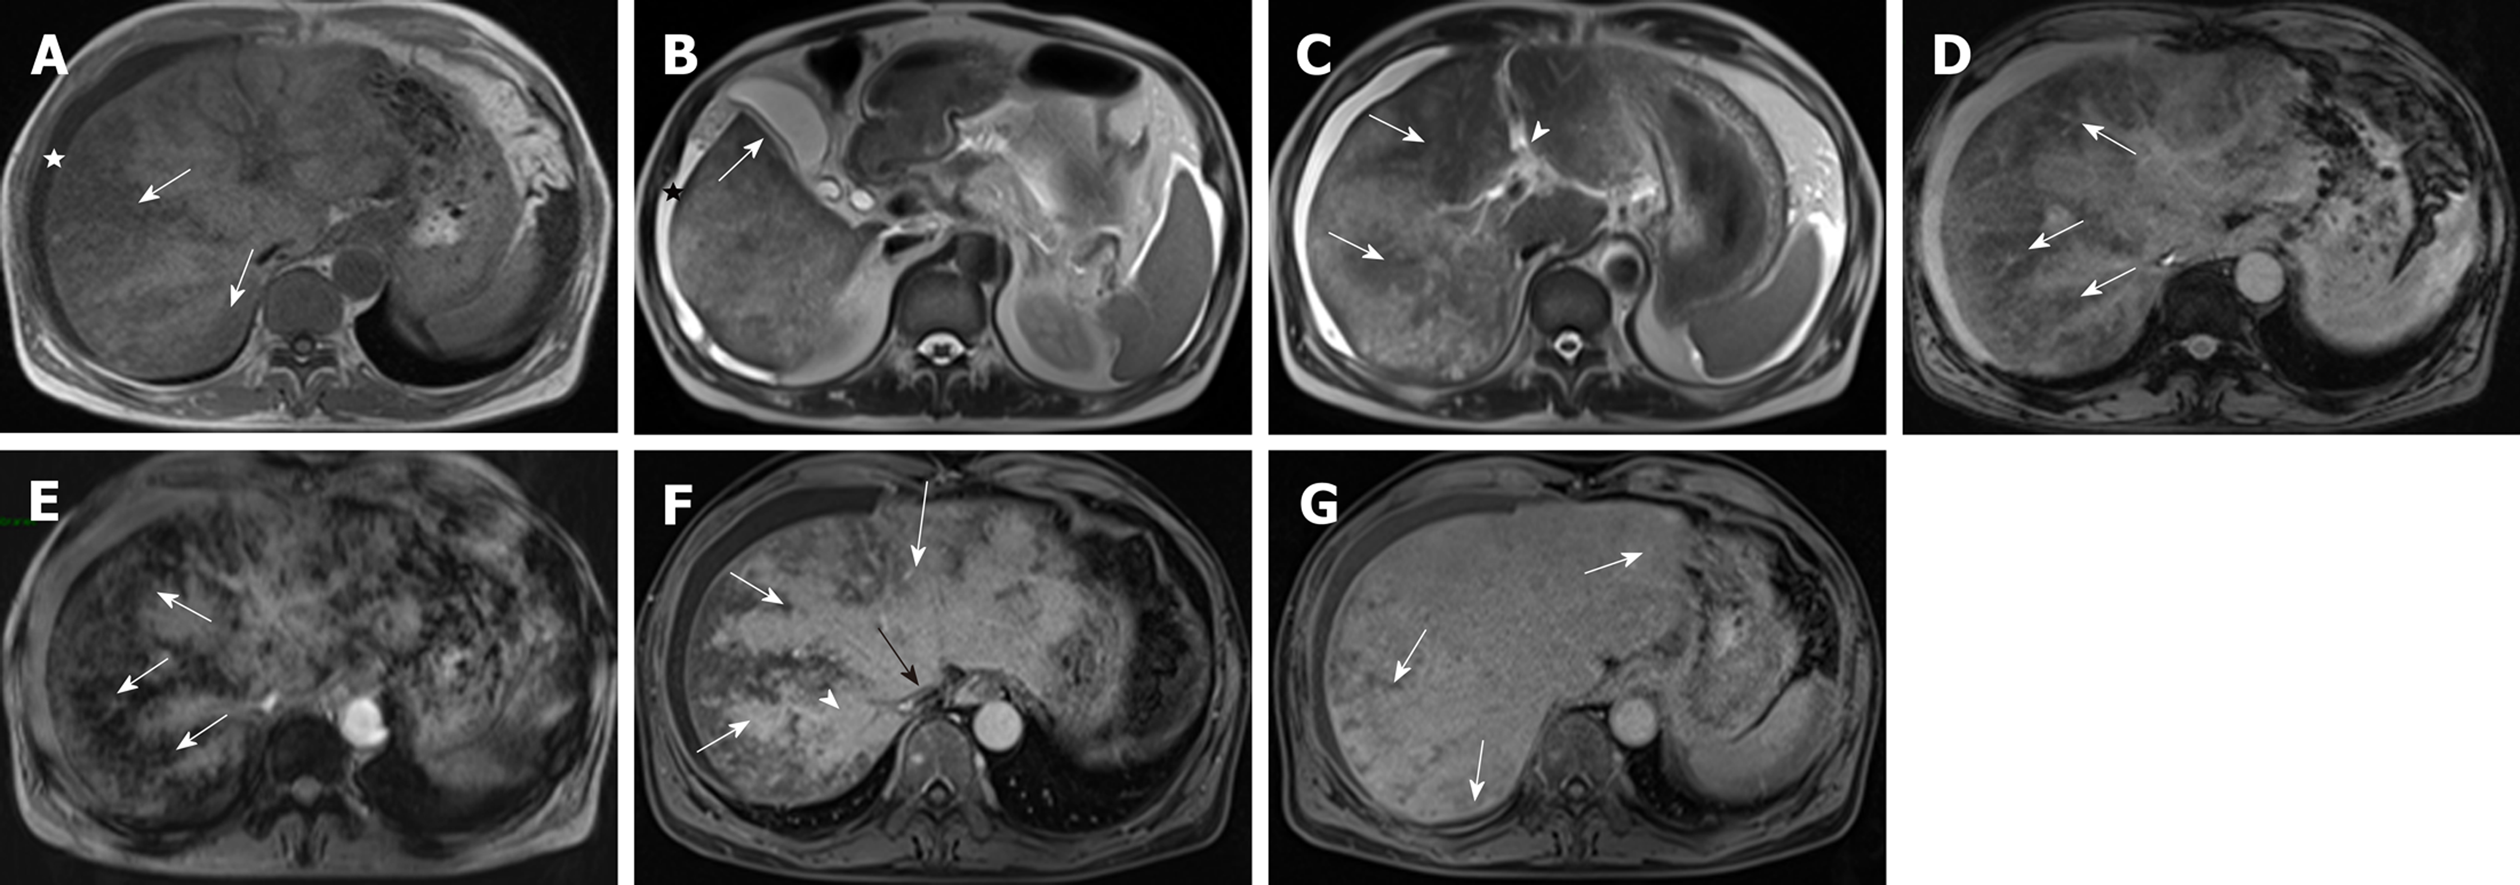
Figure 3 A 53-year-old man with pyrrolizidine alkaloids-induced hepatic sinusoidal obstruction syndrome (same patient) received gadoxetic acid-enhanced magnetic resonance imaging scan.
A: T1-weighted imaging. Ascites (white star), heterogeneous hypointensity (white arrow) were shown; B and C: T2-weighted imaging. Imaging findings included ascites (black star, B), gallbladder wall thickening (white arrow, B), periportal edema (arrowhead, C), heterogeneous hypointensity (white arrow, C); D and E: T2*WI (D) and SWI (E). Heterogeneous hypointensity (white arrow) was observed, and distribution of hypointensity in SWI and T2*WI was similar; F: Image of portal venous phase. Patchy liver enhancement, “claw-shaped” enhancement surrounding hepatic veins (white arrow), stenosis of right hepatic vein (arrowhead) and inferior vena cava (black arrow); G: Image of hepatobiliary phase. Heterogeneous hypointensity (white arrow) was shown. SWI: Susceptibility-weighted imaging; T2*WI: T2*-weighted imaging.
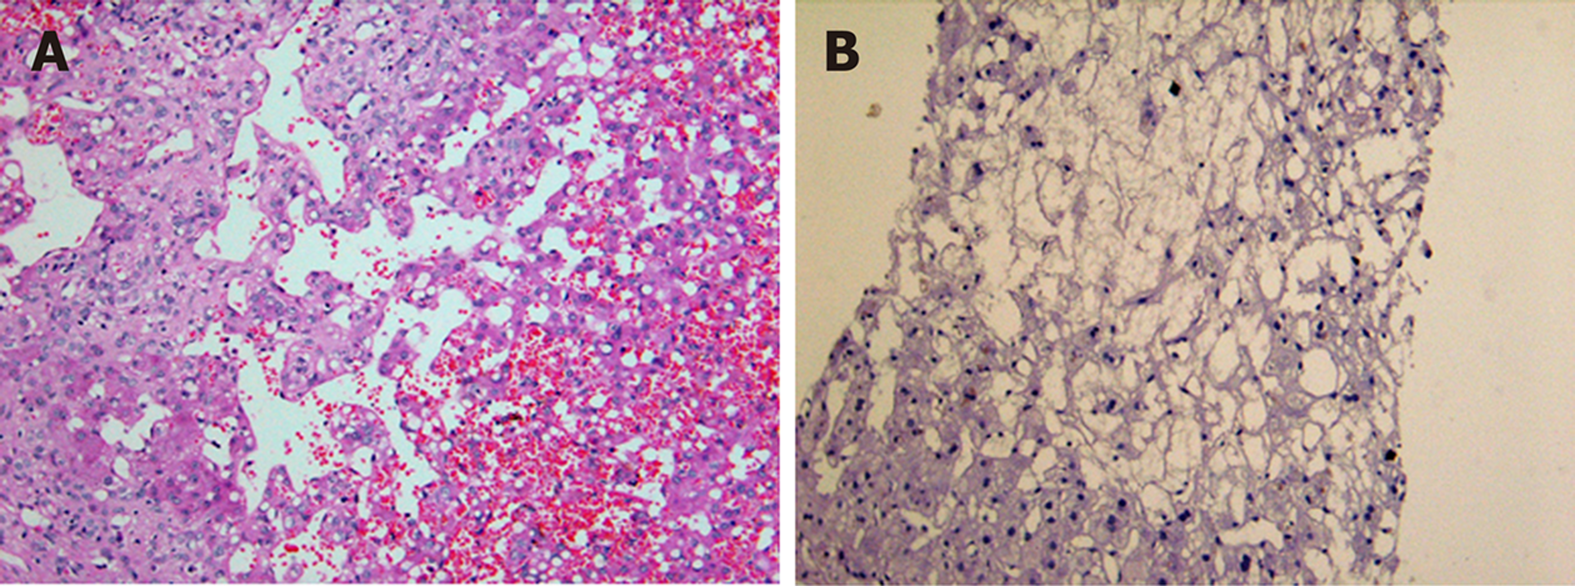
Figure 4 Pathology of pyrrolizidine alkaloids-induced hepatic sinusoidal obstruction syndrome.
A: Acute stage (200 ×). Dilation and congestion of hepatic sinusoidals, the penetration of erythrocytes into the space of Disse; B: Subacute stage (200 ×). Complete loss of pericentral hepatocytes, sinusoidal dilatation.
- Citation: Yang XQ, Ye J, Li X, Li Q, Song YH. Pyrrolizidine alkaloids-induced hepatic sinusoidal obstruction syndrome: Pathogenesis, clinical manifestations, diagnosis, treatment, and outcomes. World J Gastroenterol 2019; 25(28): 3753-3763
- URL: https://www.wjgnet.com/1007-9327/full/v25/i28/3753.htm
- DOI: https://dx.doi.org/10.3748/wjg.v25.i28.3753


