Copyright
©The Author(s) 2019.
World J Gastroenterol. Jun 14, 2019; 25(22): 2776-2787
Published online Jun 14, 2019. doi: 10.3748/wjg.v25.i22.2776
Published online Jun 14, 2019. doi: 10.3748/wjg.v25.i22.2776
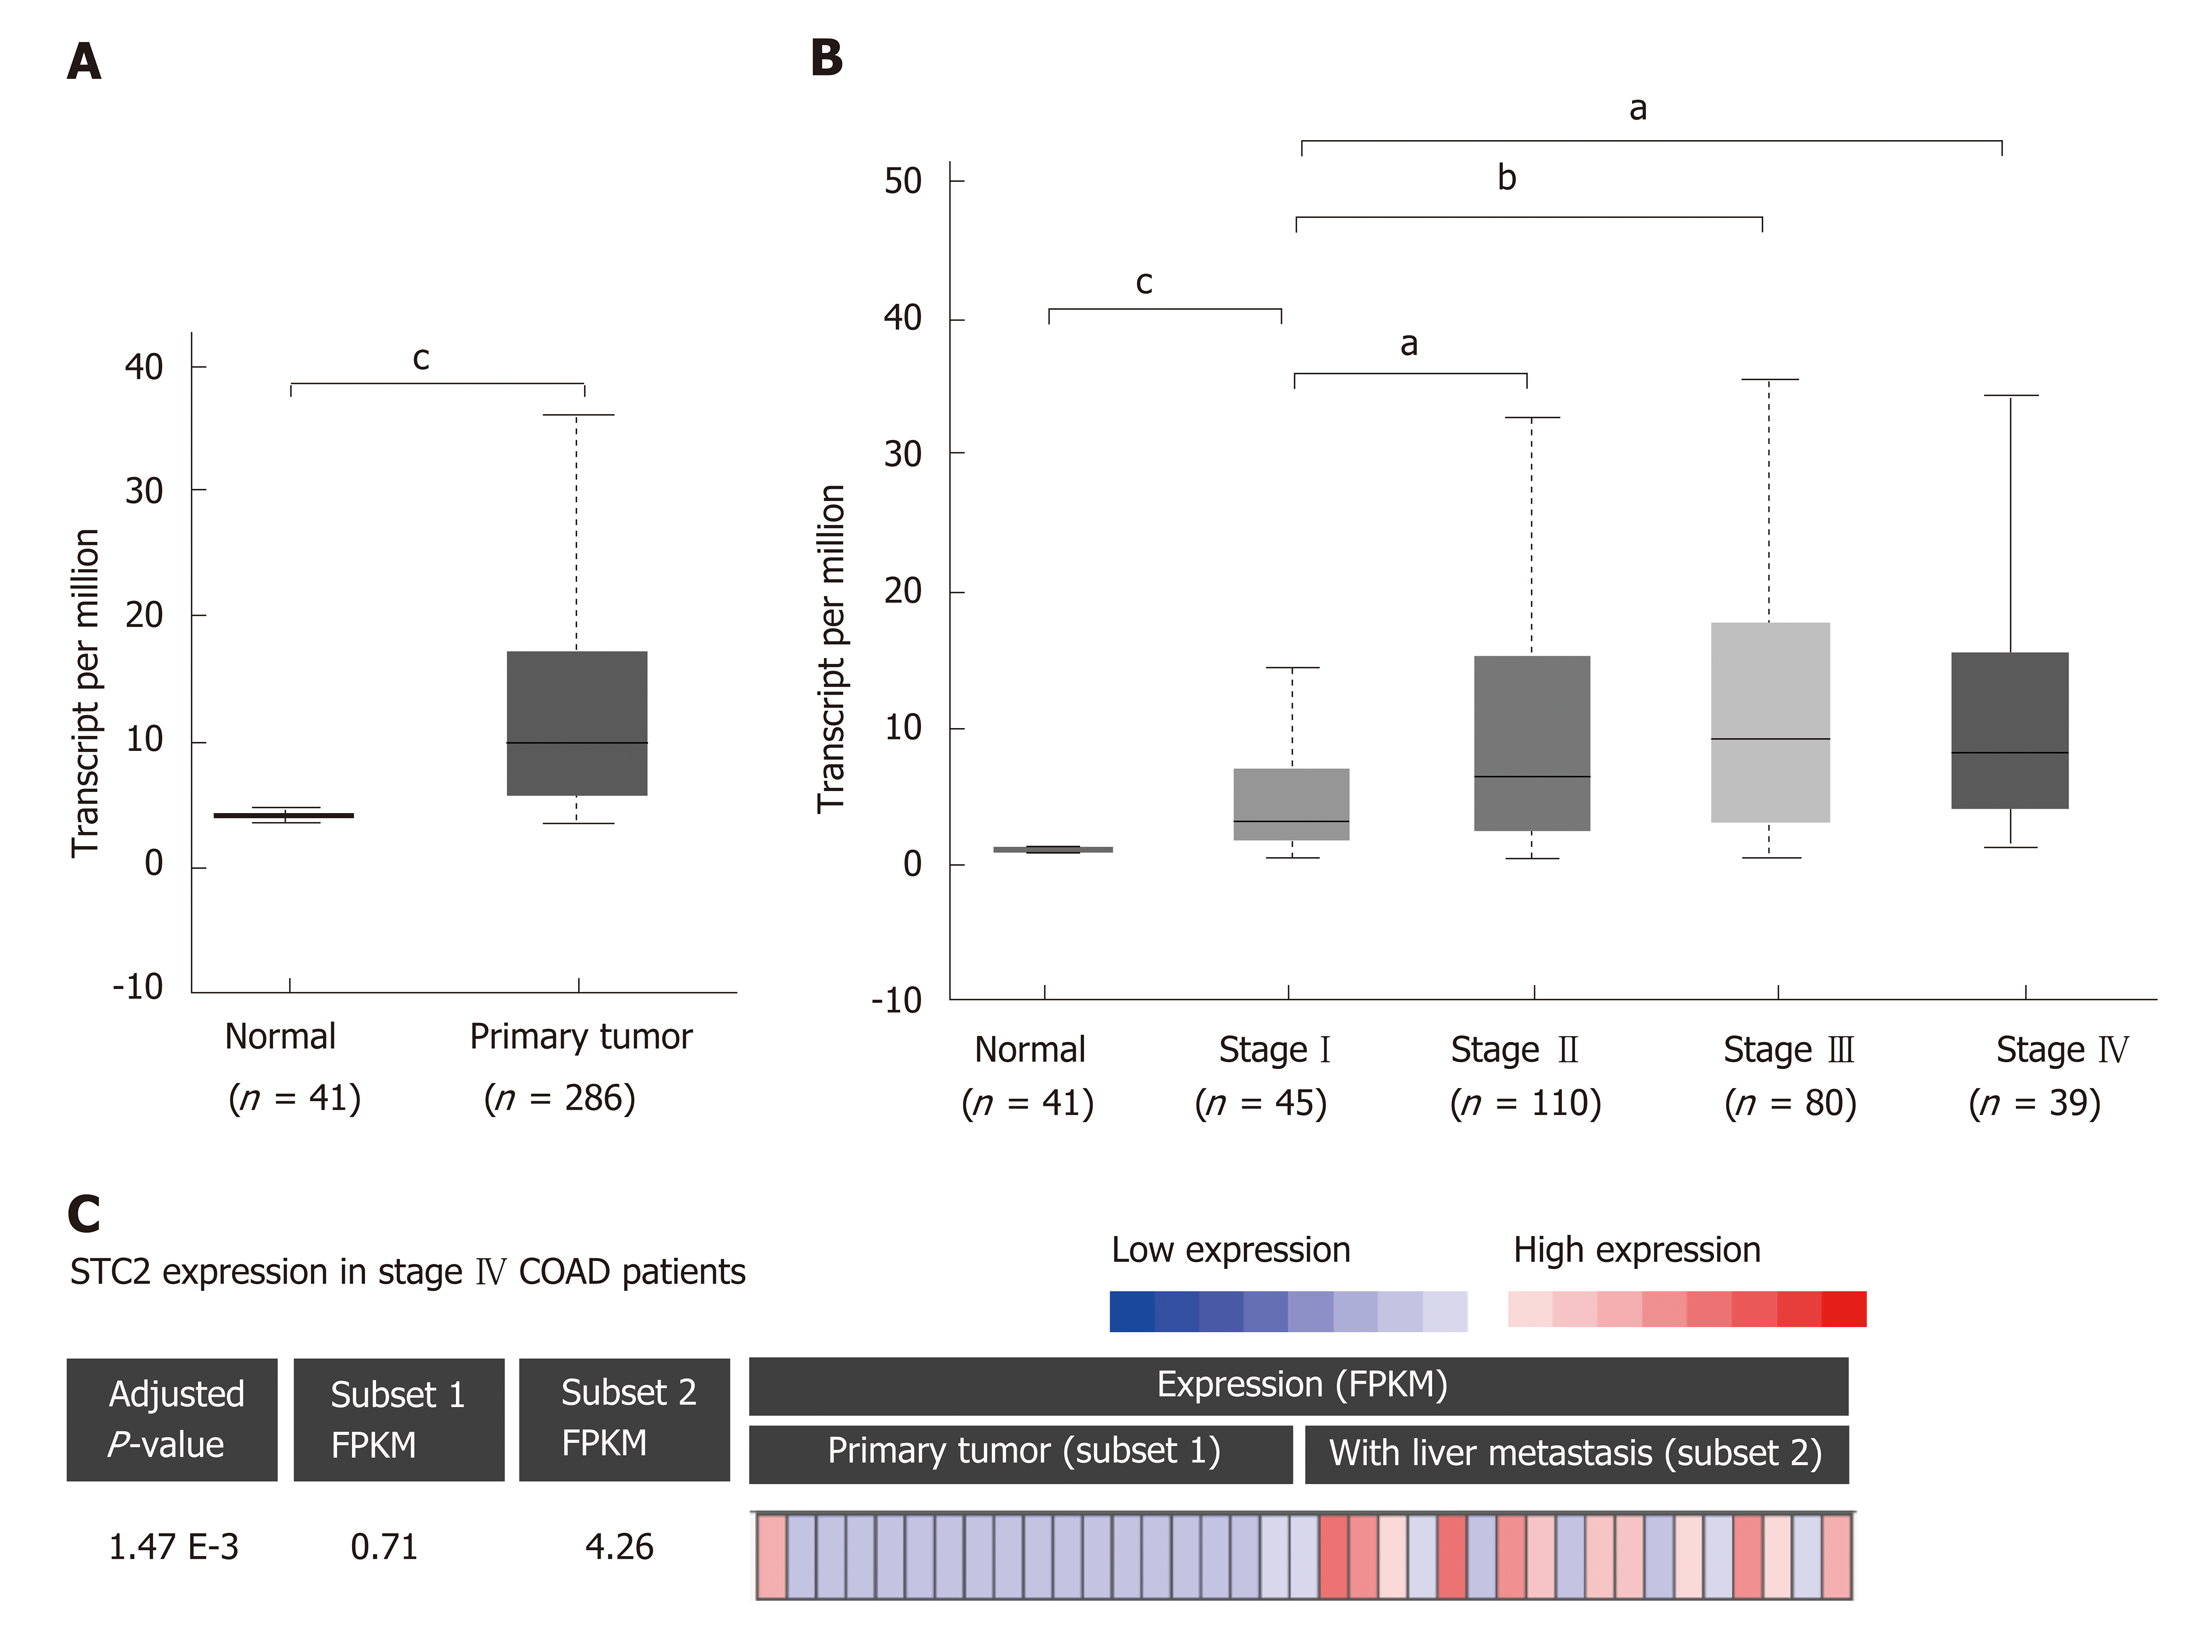
Figure 1 STC2 was overexpressed in colon tumor tissues and contributed to cancer development.
A: The relative transcript expression of STC2 was conducted with normal (adjacent colorectal tissues, 41 cases) and colon tumor tissues (286 cases). b), cP < 0.001 vs normal; B: The relative transcript expression of STC2 was evaluated in 274 cases colon tumor tissues with different disease condition, aP < 0.05 vs normal group, cP < 0.001 vs normal group; C: With RNA-seq analysis of STC2 expression in primary colon cancer and liver metastatic colon cancer tissues of stage IV patients (GSE50760). Subset 1: Primary colon cancer; Subset 2: Colon cancer with liver metastasis. STC2: Stanniocalcin 2; FPKM: Fragments per kilobase million.
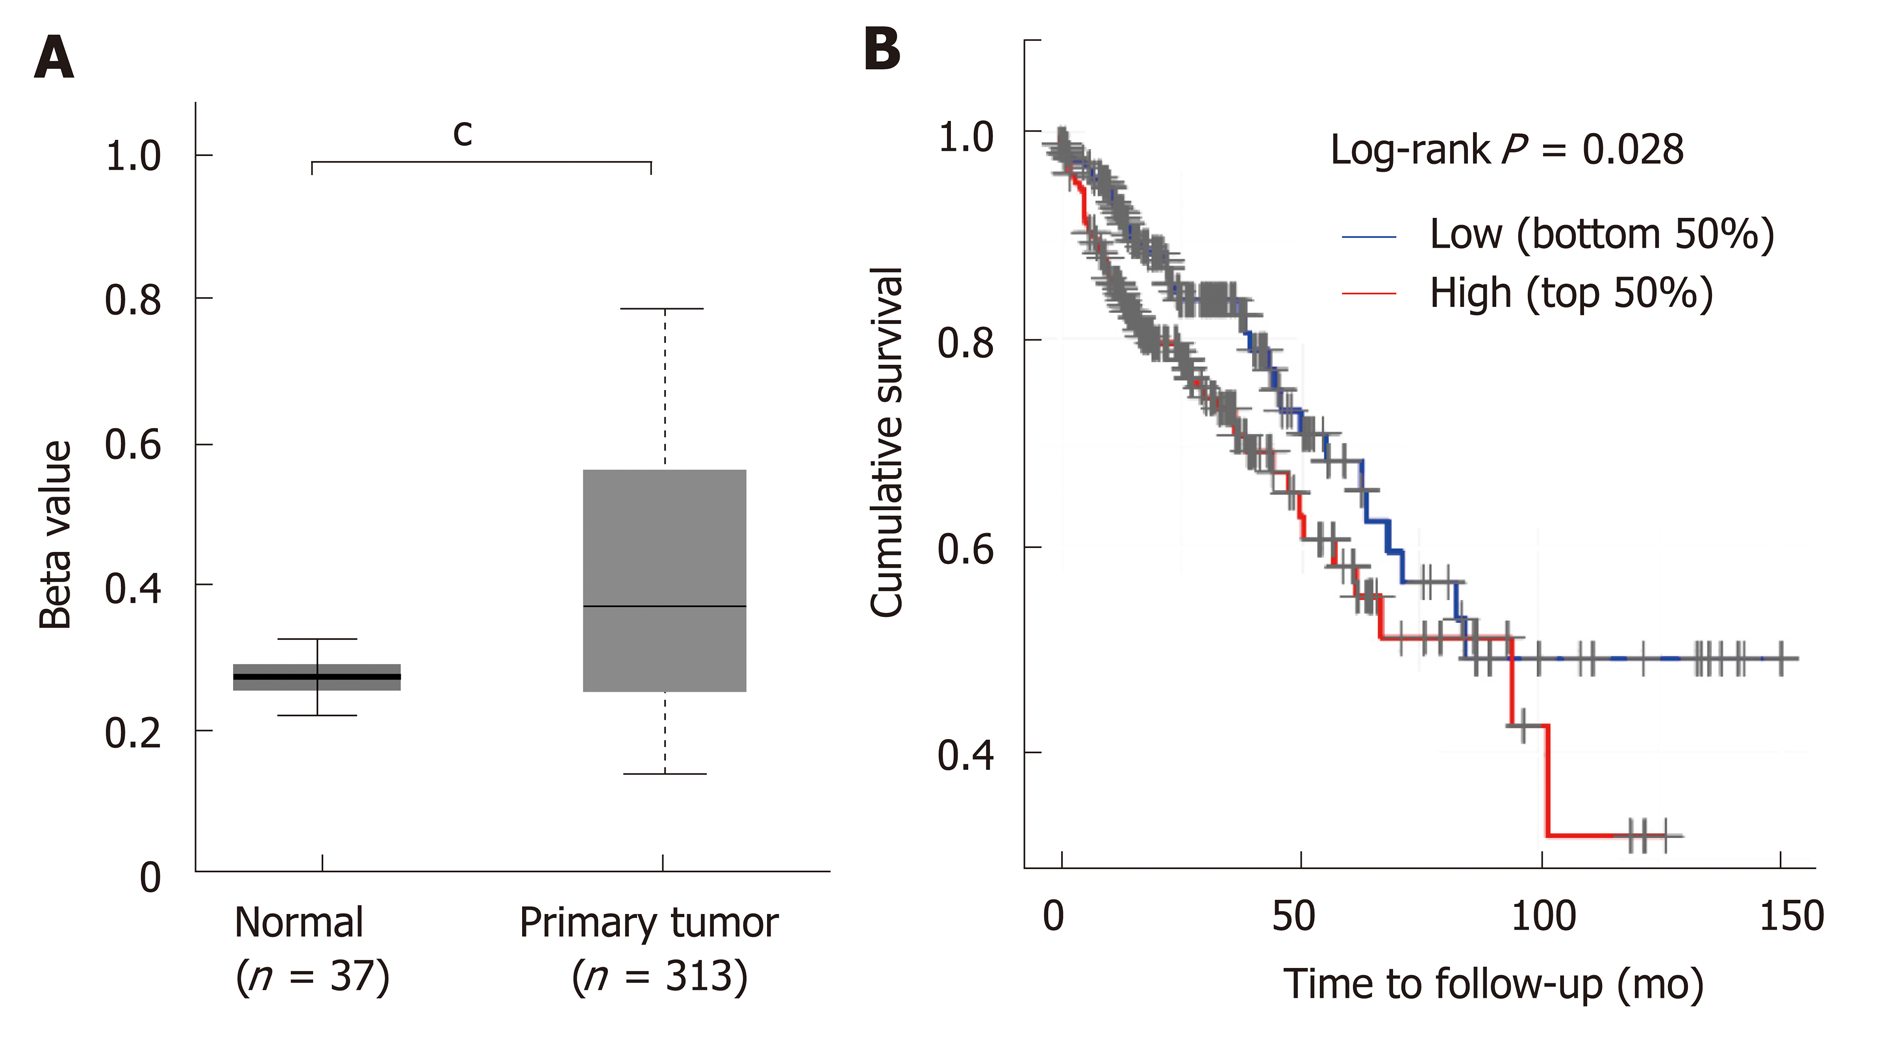
Figure 2 STC2 was hypermethylated in colon cancer tissues and the high expression of STC2 indicated poor prognosis.
A: Comparison of the promoter methylation level of STC2 in 37 cases normal colon and 313 cases tumor tissues; B: The cumulative survival rate was conducted between high and low expression of STC2. cP < 0.001 vs normal. STC2: Stanniocalcin 2.
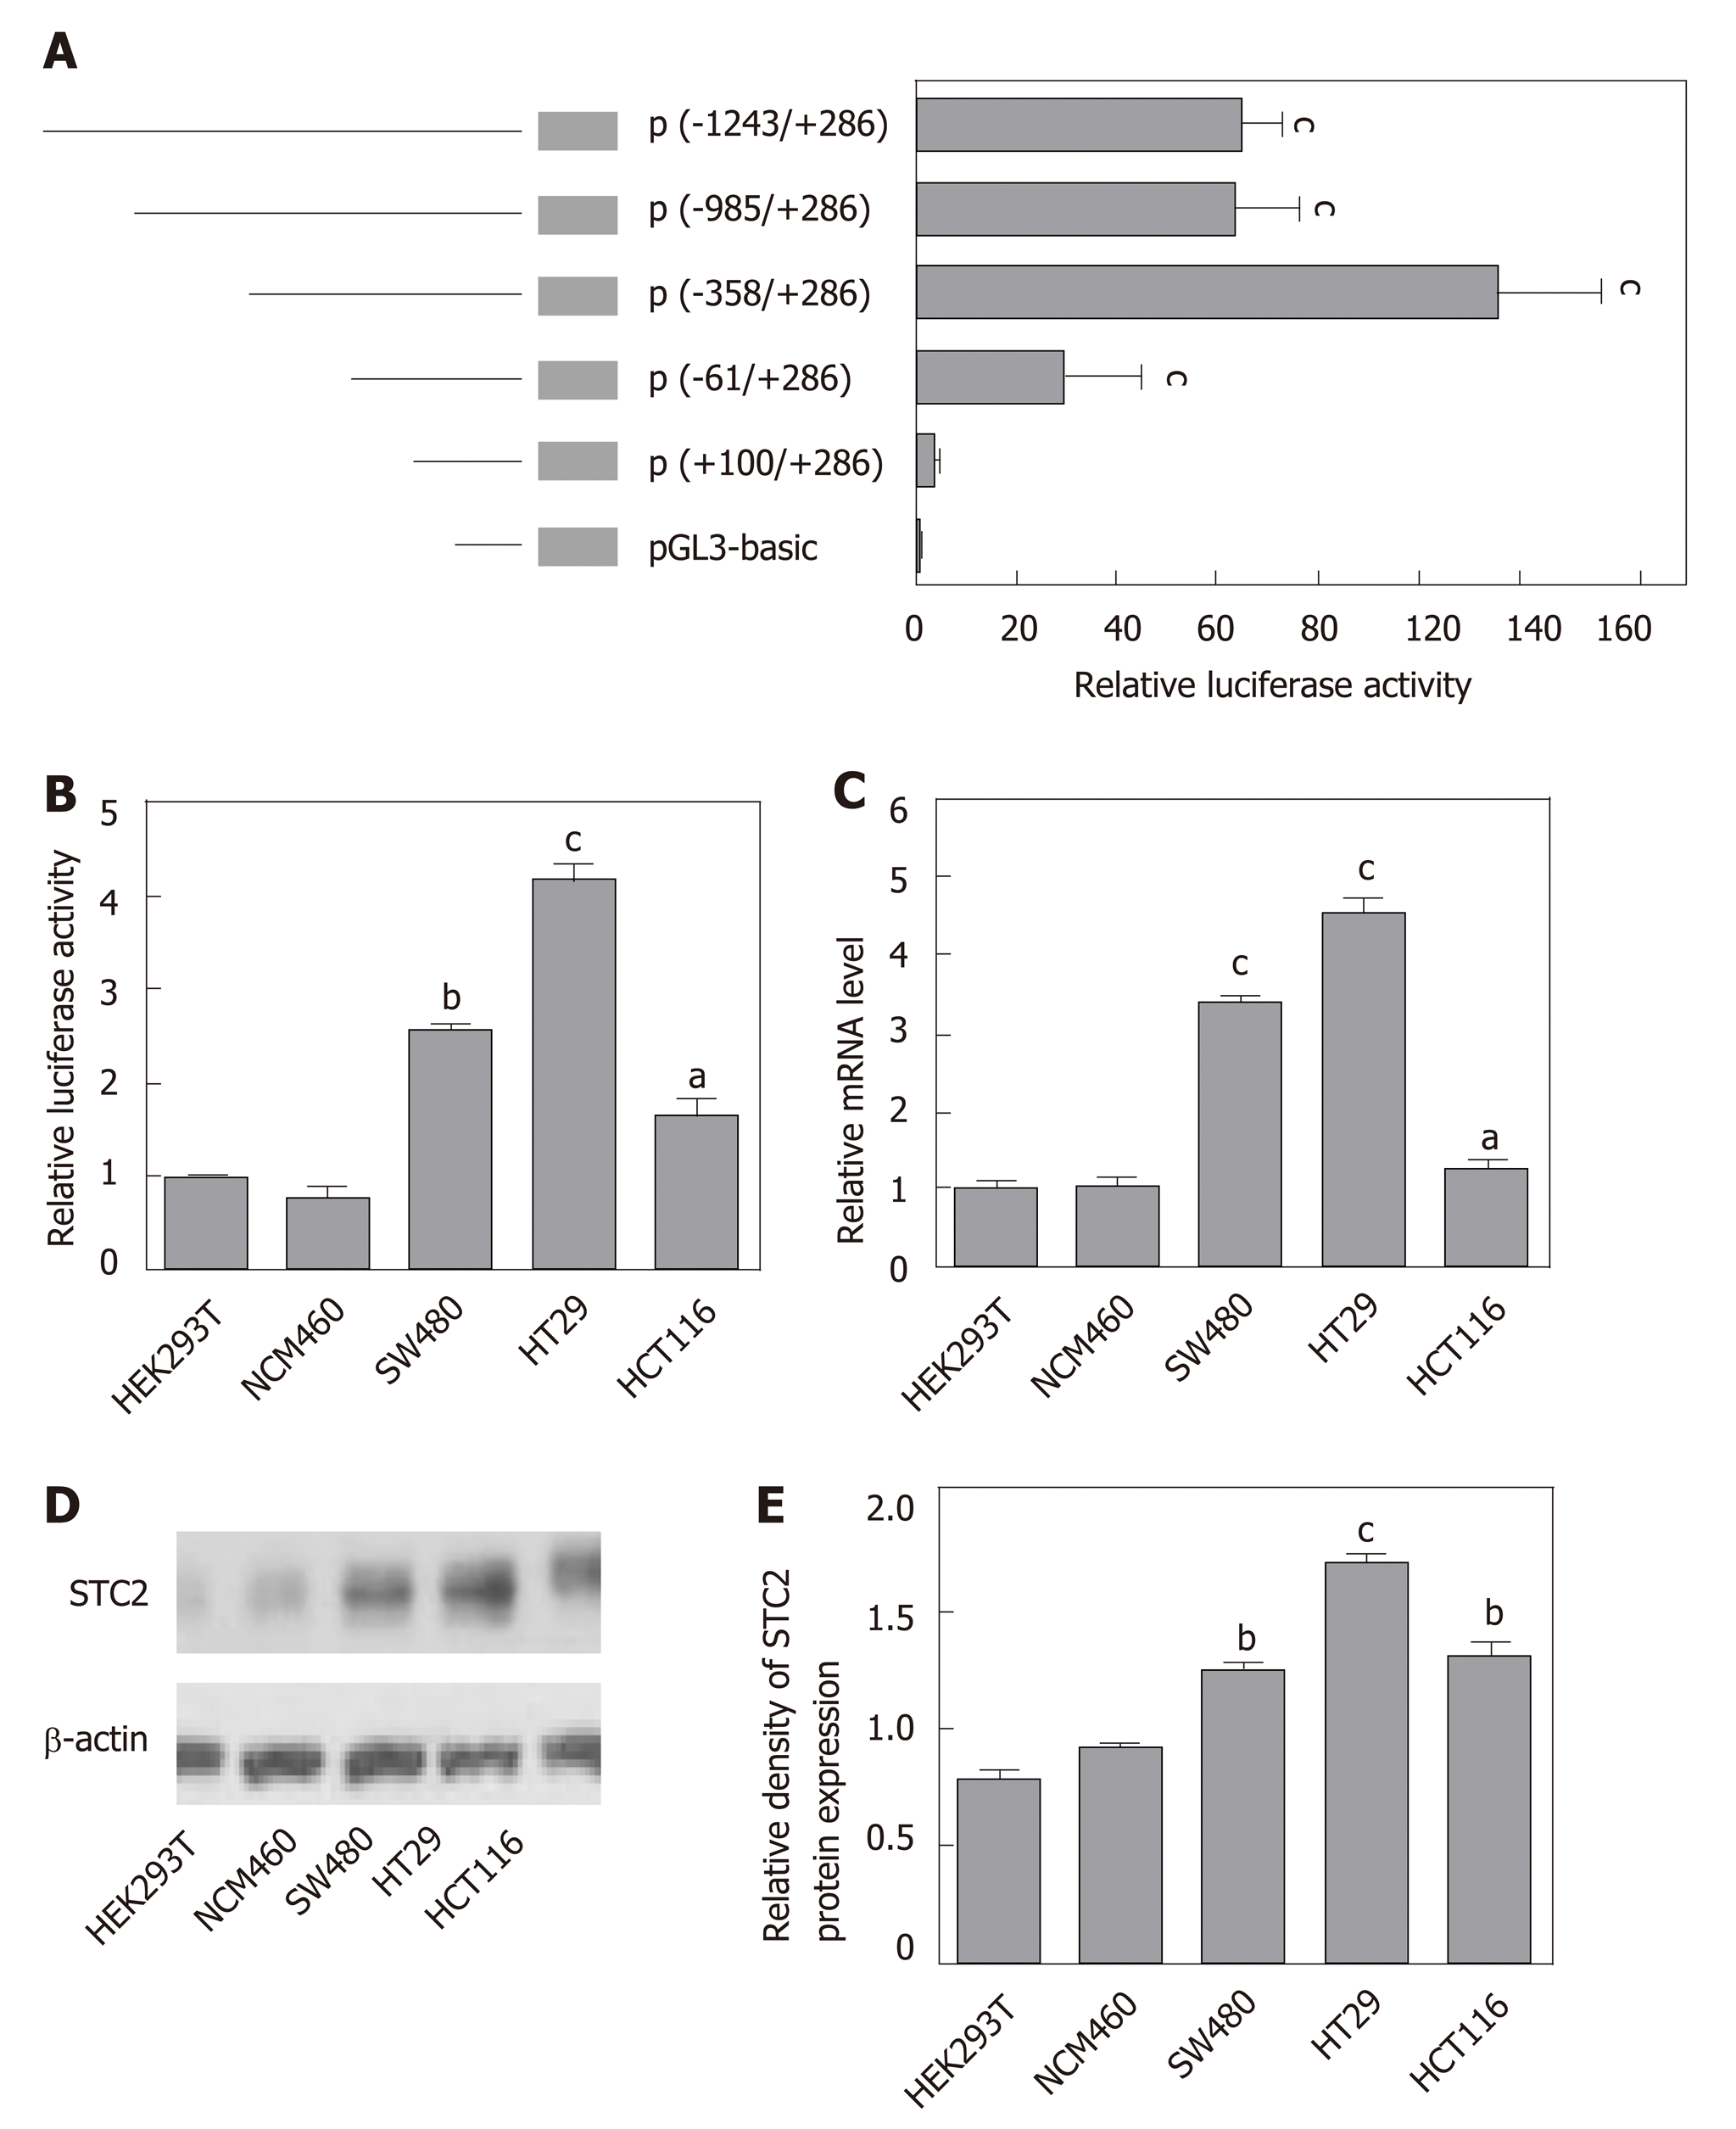
Figure 3 The core region of the STC2 promoter was -358/+286 nt and correlated with the protein levels.
A: The relative promoter activity of different regions of the STC2 promoter was evaluated by luciferase reporter assay in HT29 cells, cP < 0.001 vs pGL3-Basic; B: The relative promoter activity of core region -358/+286 nt and (C: mRNA expression levels were examined in different cell lines, aP < 0.05, bP < 0.01, cP < 0.001 vs HEK293T; D: Western blotting was performed to examine the protein expression of STC2 in different cell lines; E: The relative protein density of panel D was conducted by Quantity One software. bP < 0.01, cP < 0.001 vs HEK293T. STC2: Stanniocalcin 2.
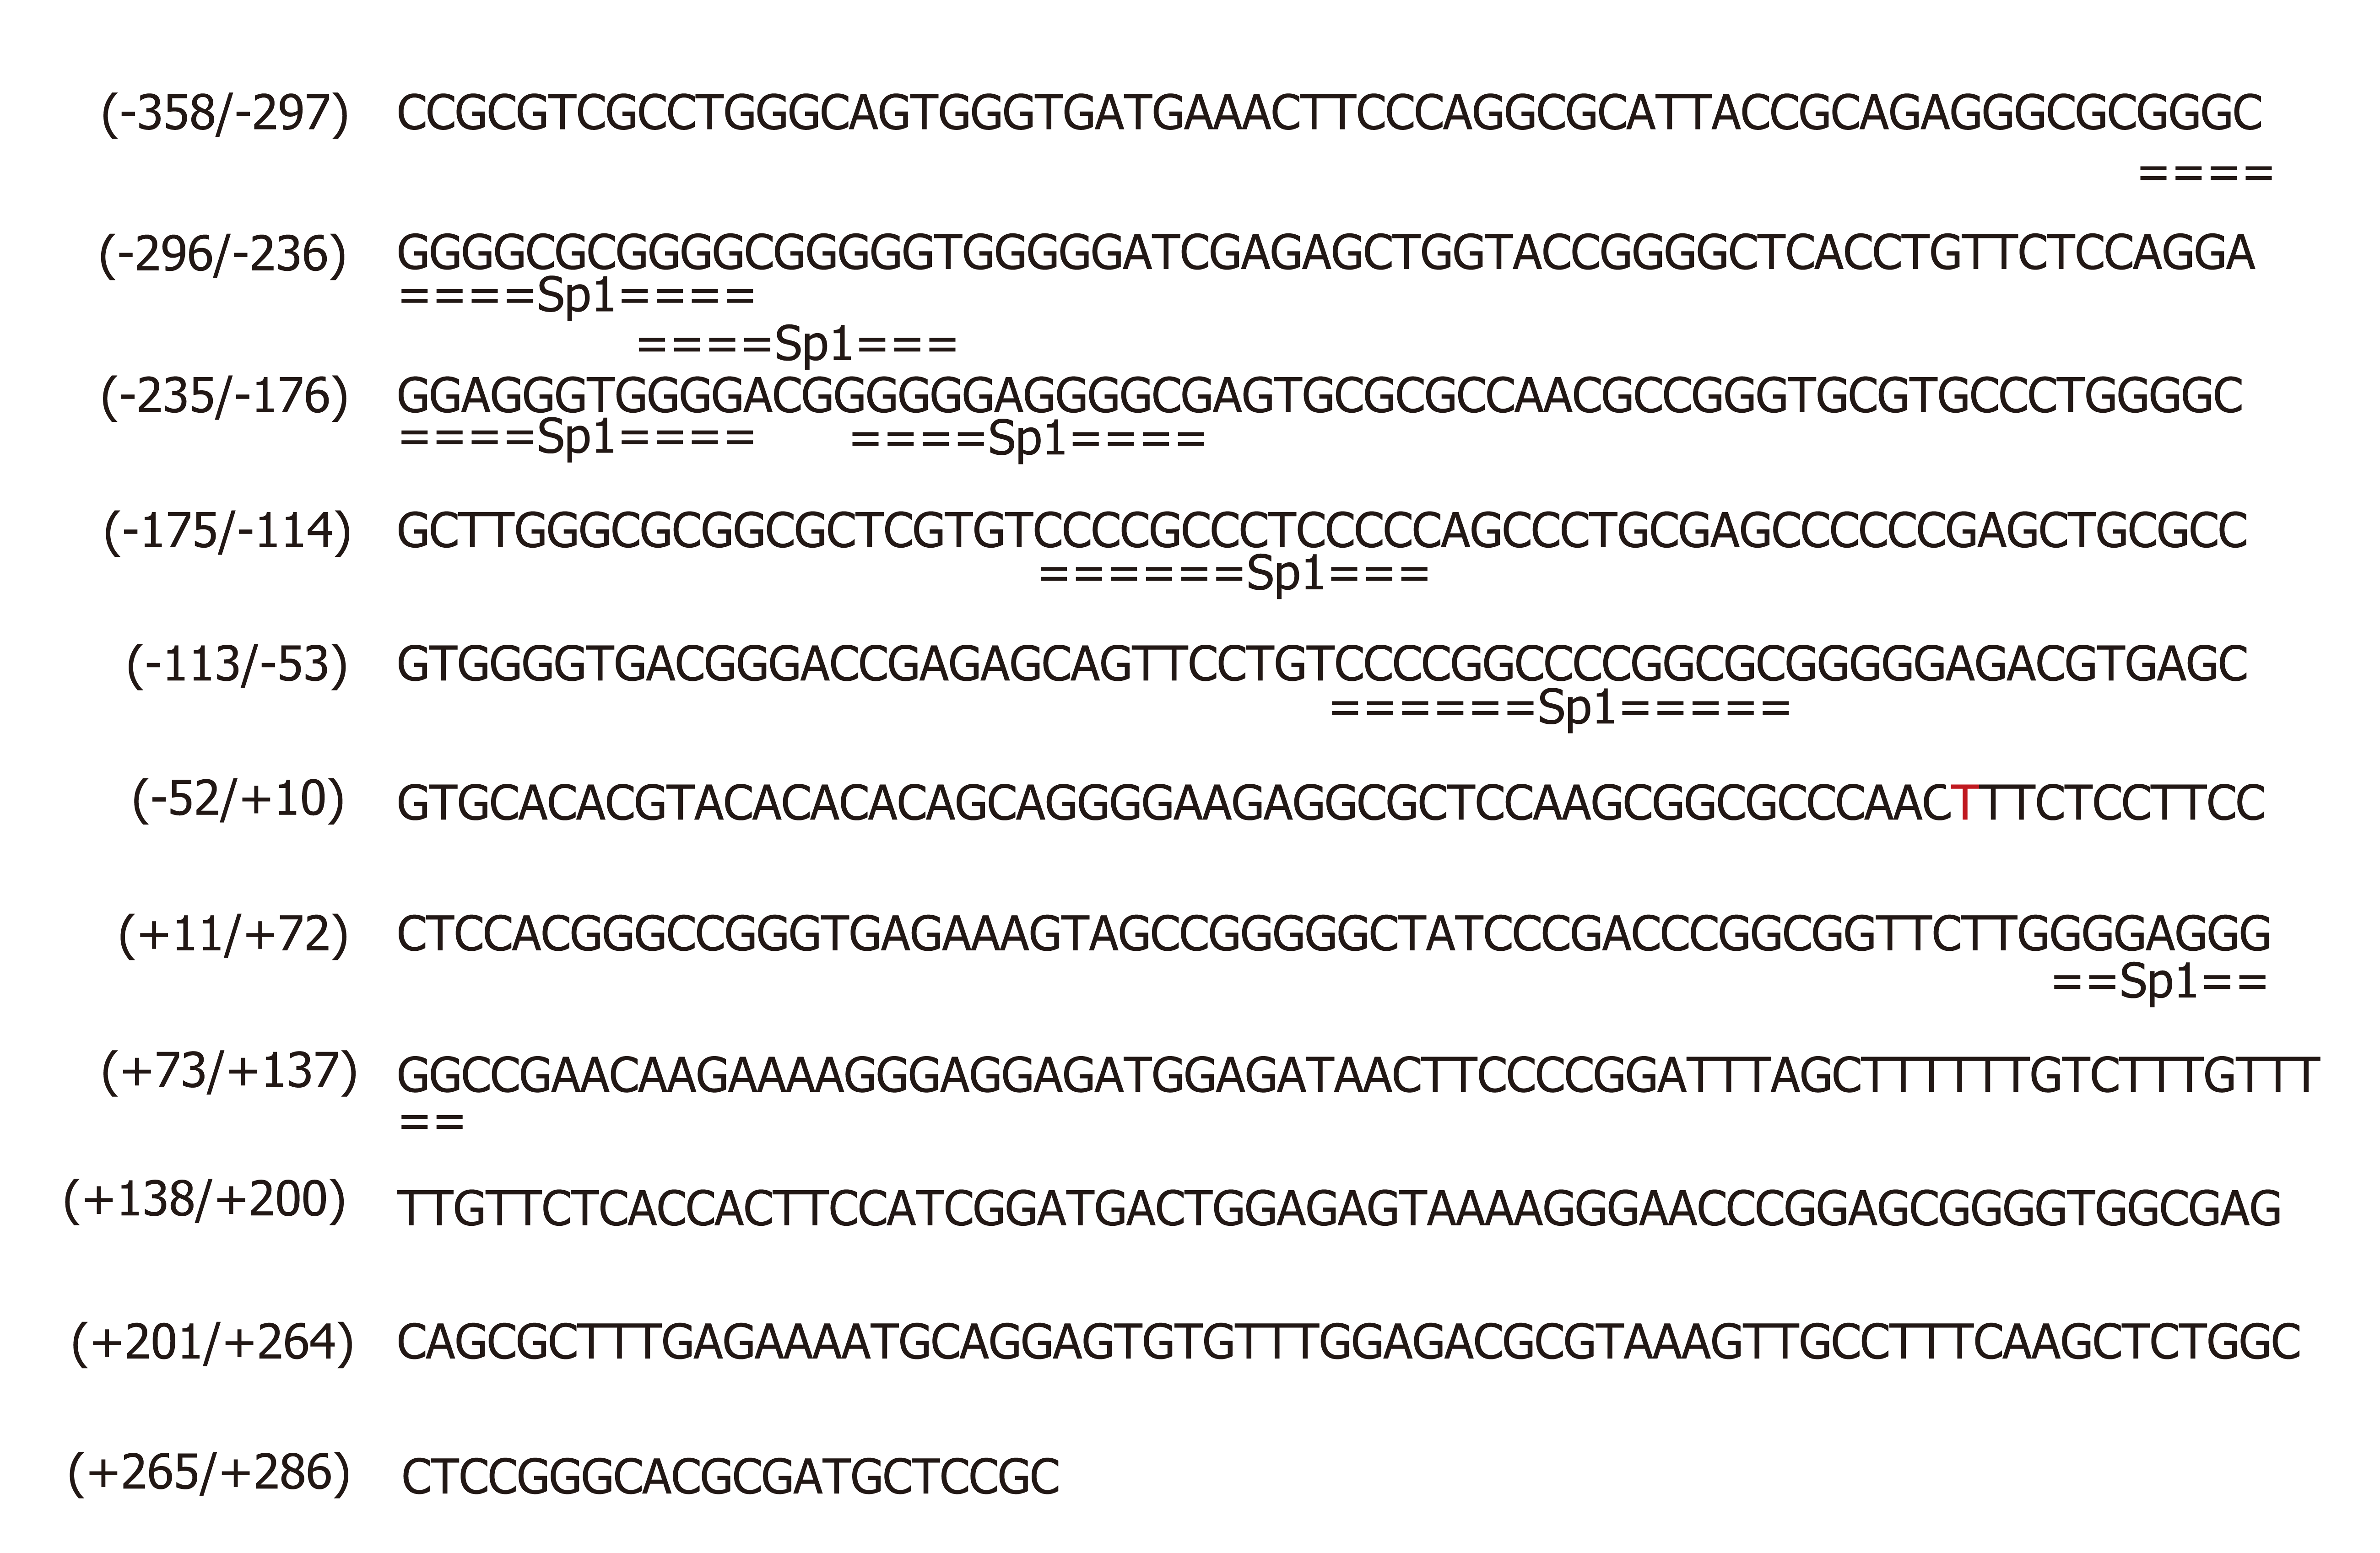
Figure 4 The potential transcription factor Sp1 binding site in core region of STC2 promoter.
The prediction of transcription factor binding sites by conducting matrices on the fly from TRANSFAC 4.0 and LASAGNA 2.0 sites. The Min mat conservation was set at 80% (high) and the Sim. of seq to mat. was set at 100% (matrix = seq). STC2: Stanniocalcin 2.
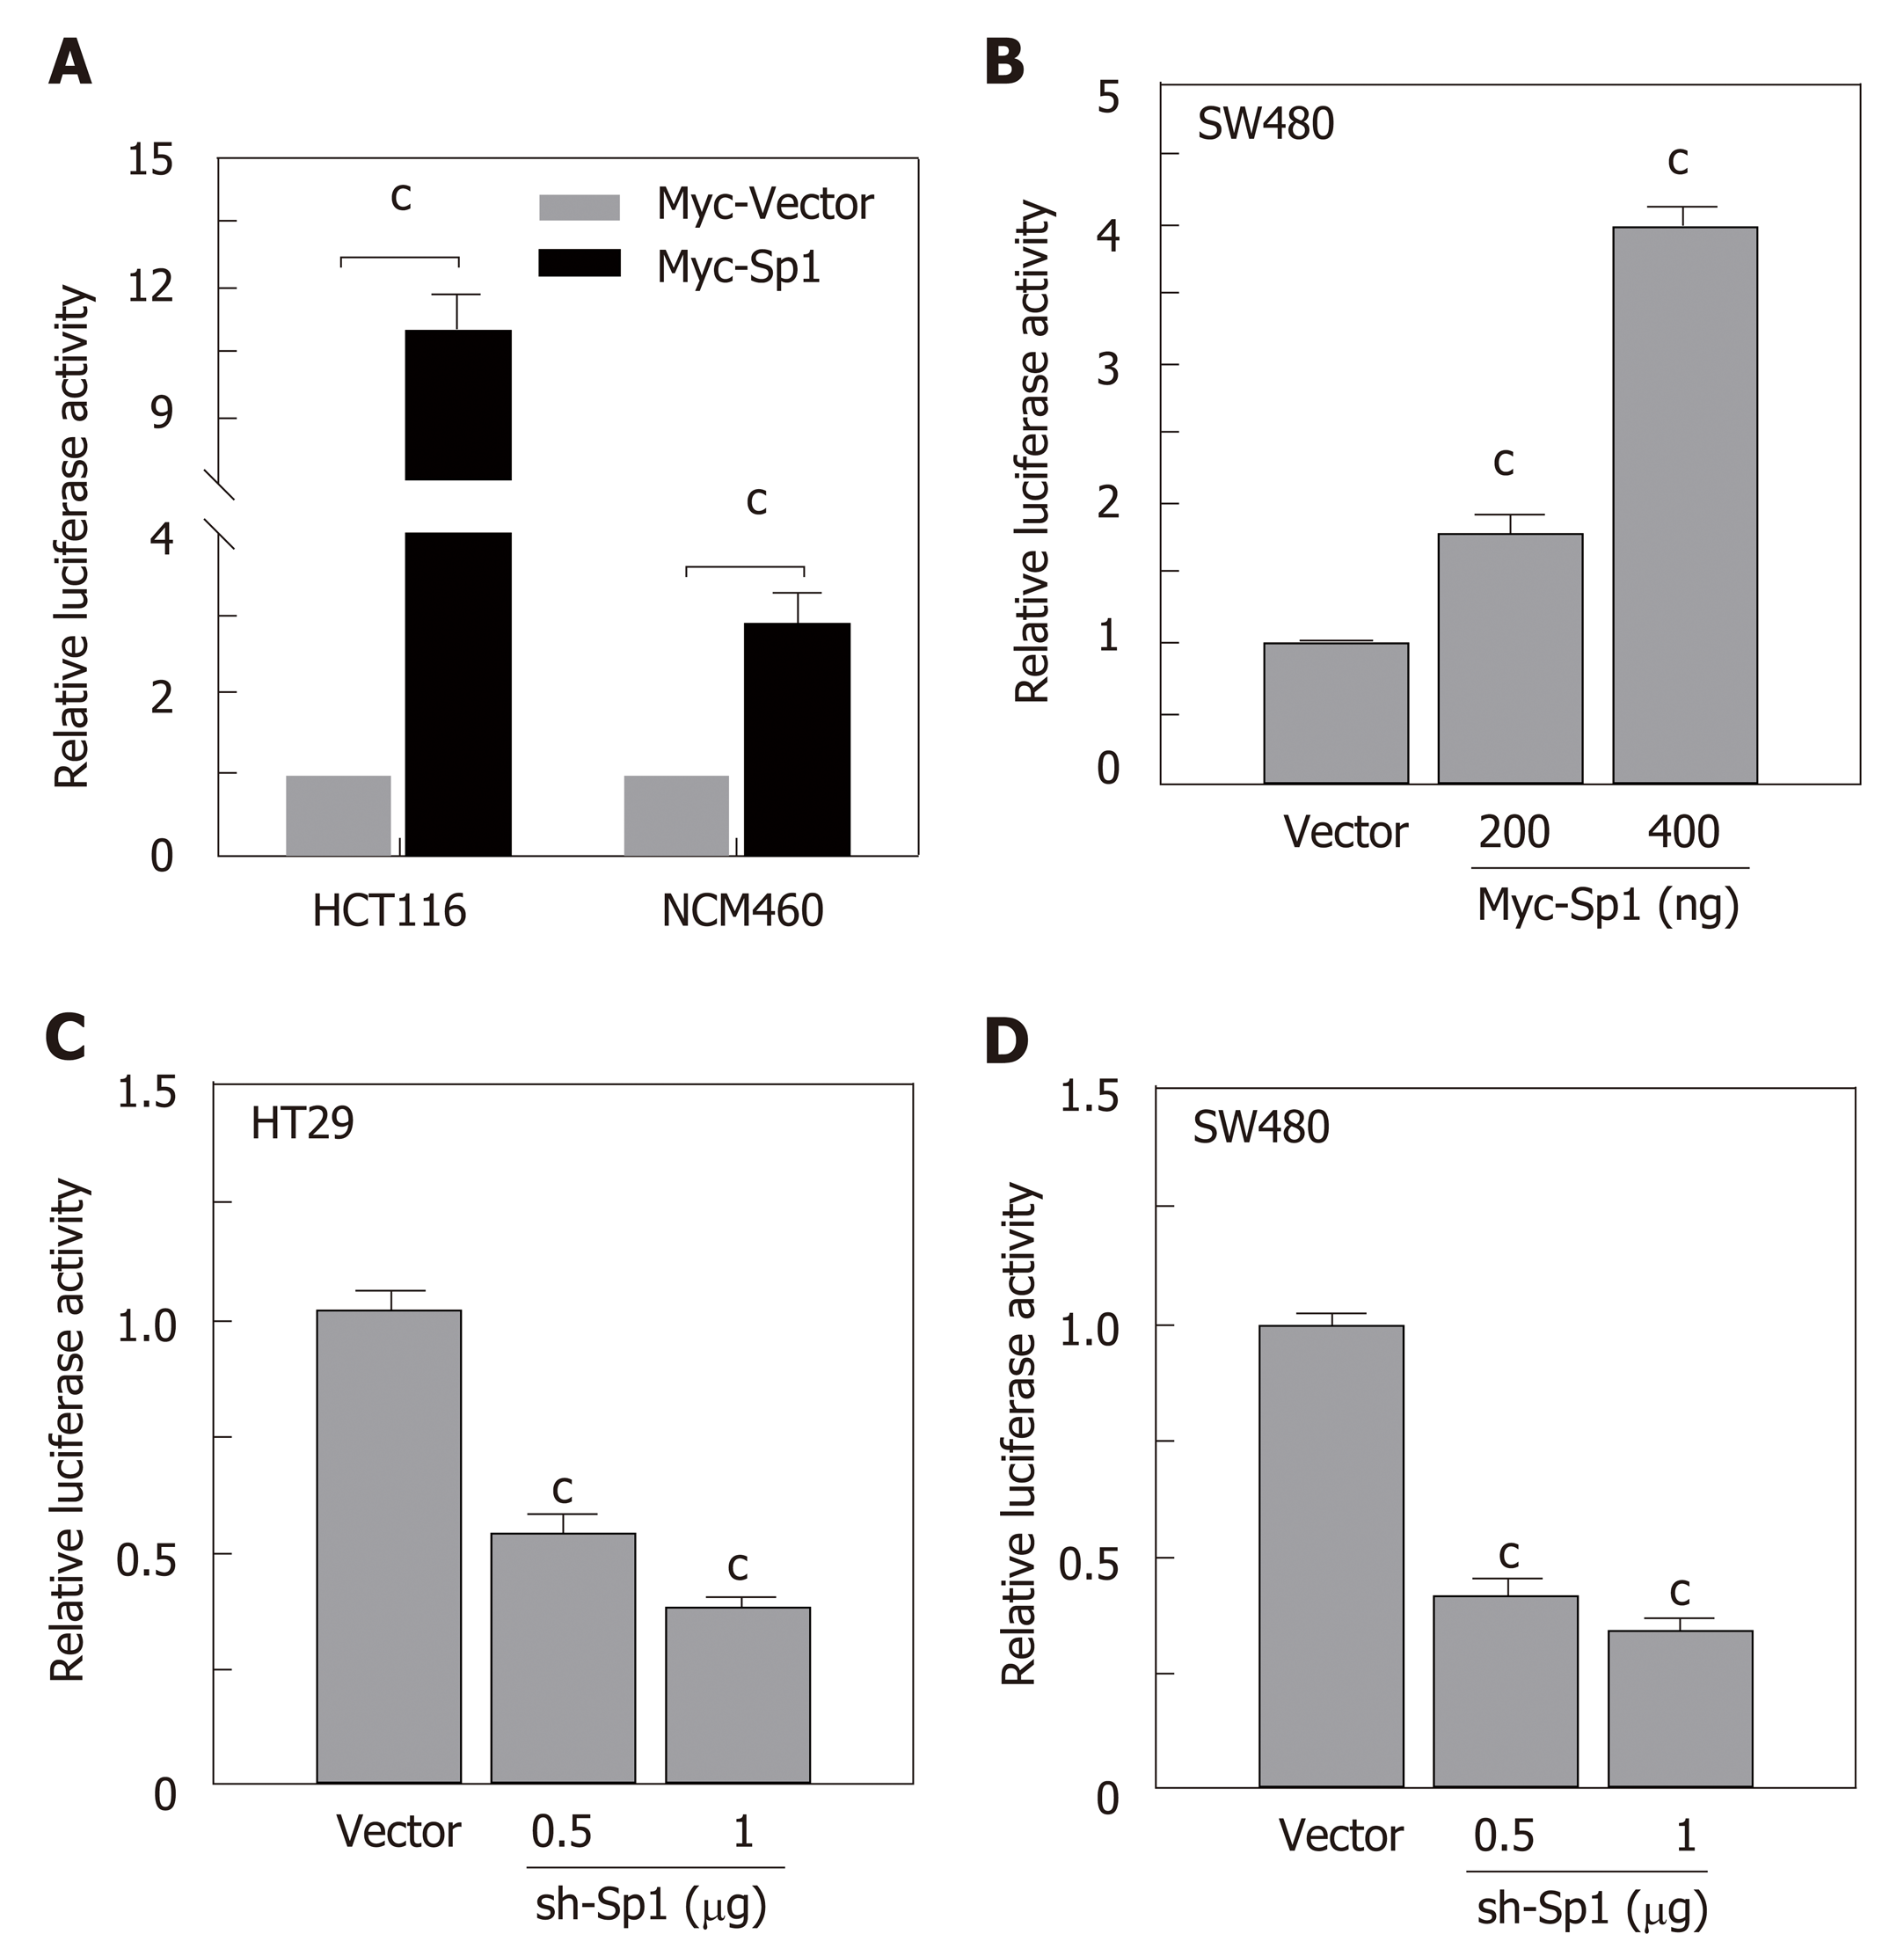
Figure 5 The transcription factor Sp1 was involved in the promoter activity of STC2.
A: Overexpression of Sp1 and control vector in HCT116 and NCM460 cells and the promoter activity were tested by luciferase reporter assay, cP < 0.001 vs Myc-Vector of individual cell group; B: Different Sp1 overexpression plasmids were transfected in SW480 cells, the promoter activity was examined 24 h after transfection, cP < 0.001 vs Myc-Vector group; C: Knockdown of expression of Sp1 in HT29 and D: SW480 cell lines with different dose, and reporter activity was conducted after 48 h transfection, cP < 0.001 vs sh-Vector. STC2: Stanniocalcin 2.
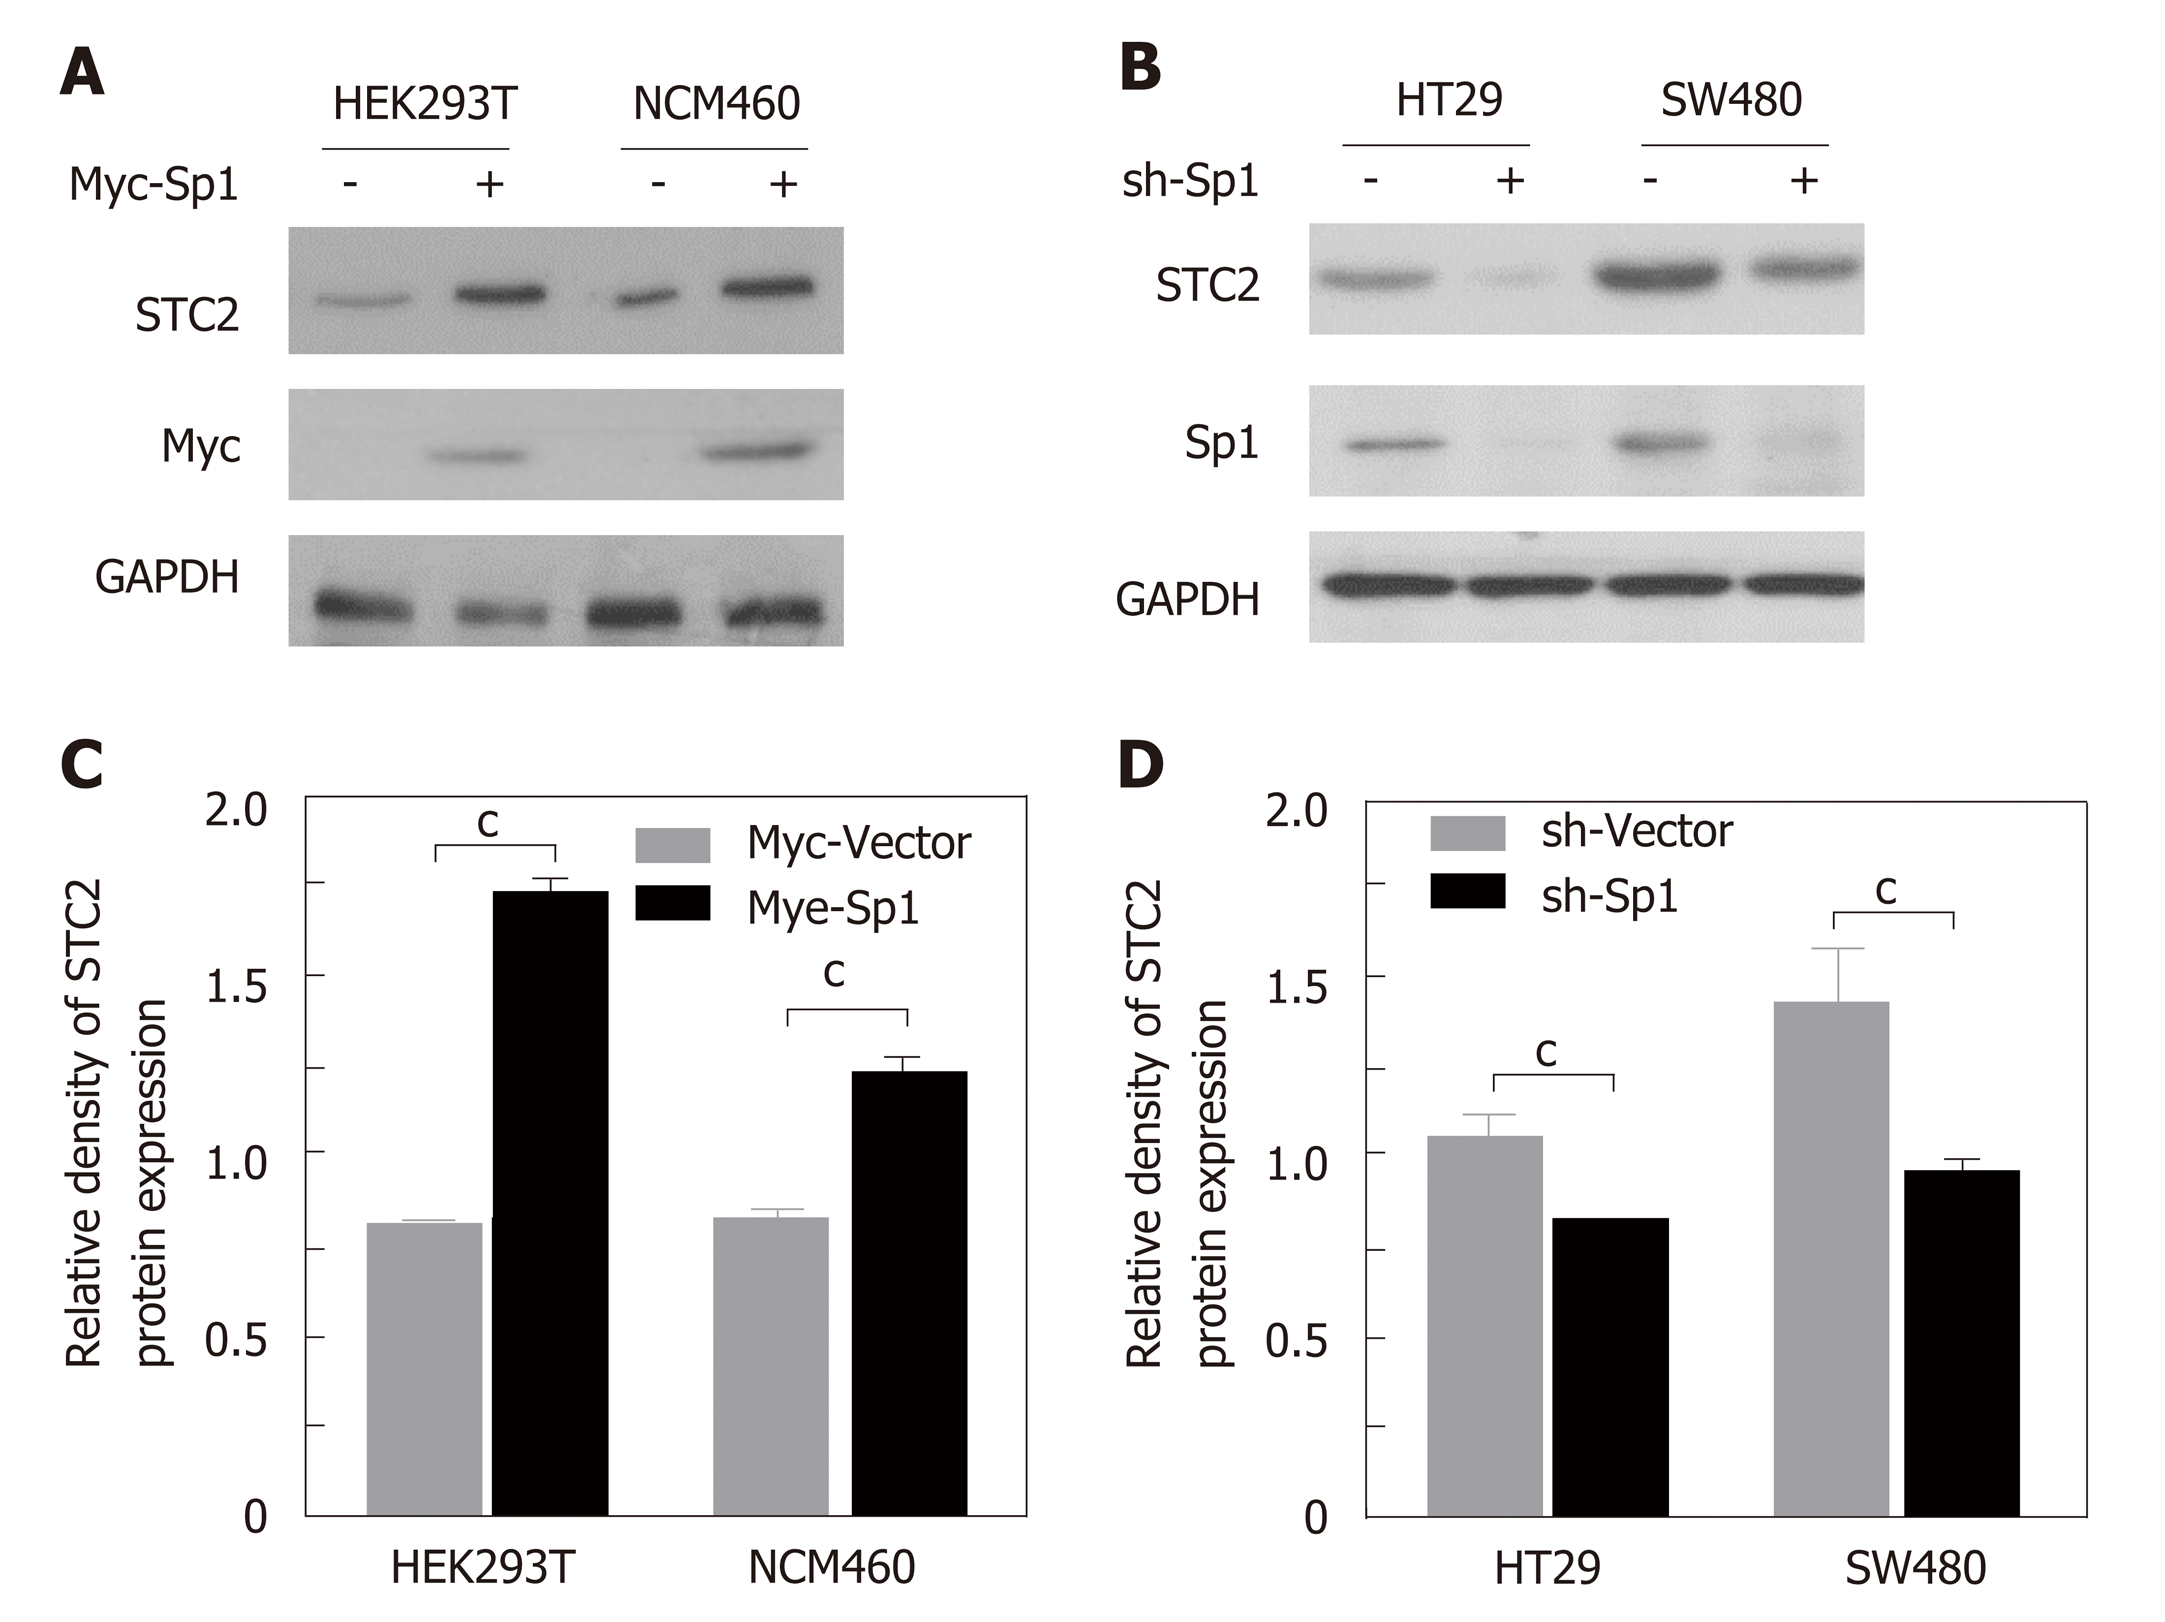
Figure 6 The transcription factor Sp1 contributed to the overexpression of STC2 in colon cancer cells.
A: Overexpression of Sp1 in HEK293T and NCM460 cells. Western blotting was used to evaluate the protein expression of STC2; B: The quantity of panel A protein density with Quantity One software, cP < 0.001 vs Myc-Vector of individual cell group; C: Knocking down the expression of Sp1 with pSuper knockdown system in HT29 and SW480 cell lines. The protein levels of STC2 were evaluated with western blotting assay; D: The quantity of panel C protein density with Quantity One software. cP < 0.001 vs sh-Vector of individual cell group. STC2: Stanniocalcin 2.
- Citation: Li JB, Liu ZX, Zhang R, Ma SP, Lin T, Li YX, Yang SH, Zhang WC, Wang YP. Sp1 contributes to overexpression of stanniocalcin 2 through regulation of promoter activity in colon adenocarcinoma. World J Gastroenterol 2019; 25(22): 2776-2787
- URL: https://www.wjgnet.com/1007-9327/full/v25/i22/2776.htm
- DOI: https://dx.doi.org/10.3748/wjg.v25.i22.2776


