Copyright
©The Author(s) 2019.
World J Gastroenterol. Apr 28, 2019; 25(16): 1986-1996
Published online Apr 28, 2019. doi: 10.3748/wjg.v25.i16.1986
Published online Apr 28, 2019. doi: 10.3748/wjg.v25.i16.1986
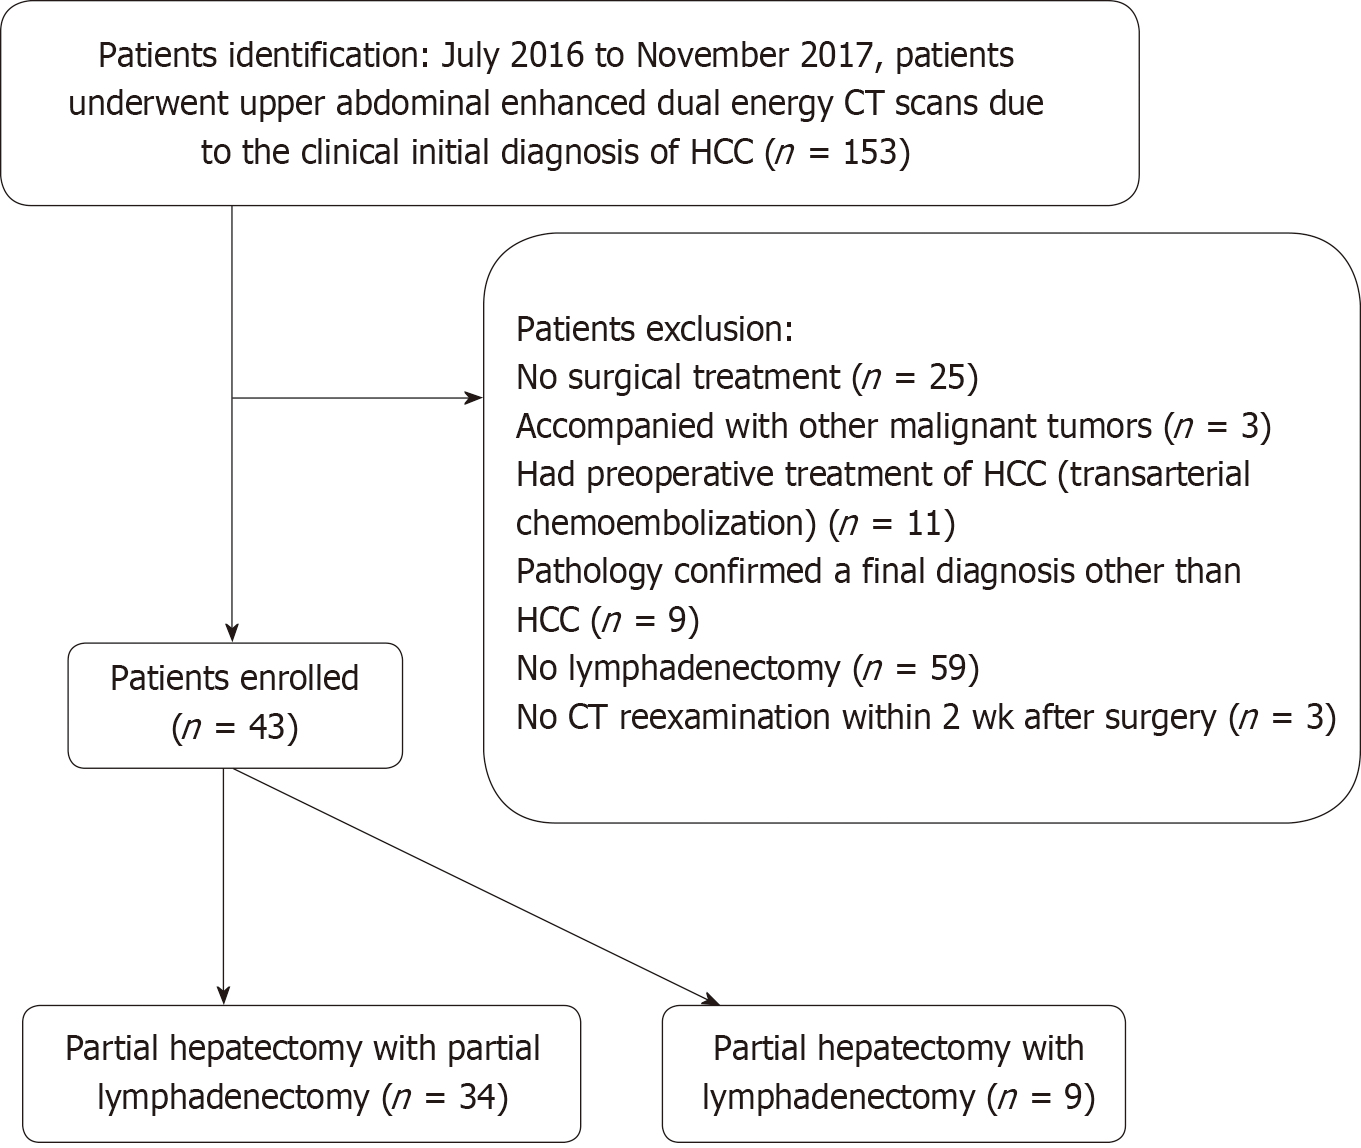
Figure 1 Patient identification and exclusion.
HCC: Hepatocellular carcinoma; CT: Computed tomography.
Figure 2 A 31-year-old male patient with hepatocellular carcinoma (black arrow head).
A and B: Preoperative computed tomography (CT) scans in the portal phase; C: Postoperative CT scan in the portal phase. Preoperative and postoperative CT scans were compared to determine the location of the removed lymph node (white arrow). Pathology of this lymph node was benign. CT: Computed tomography.
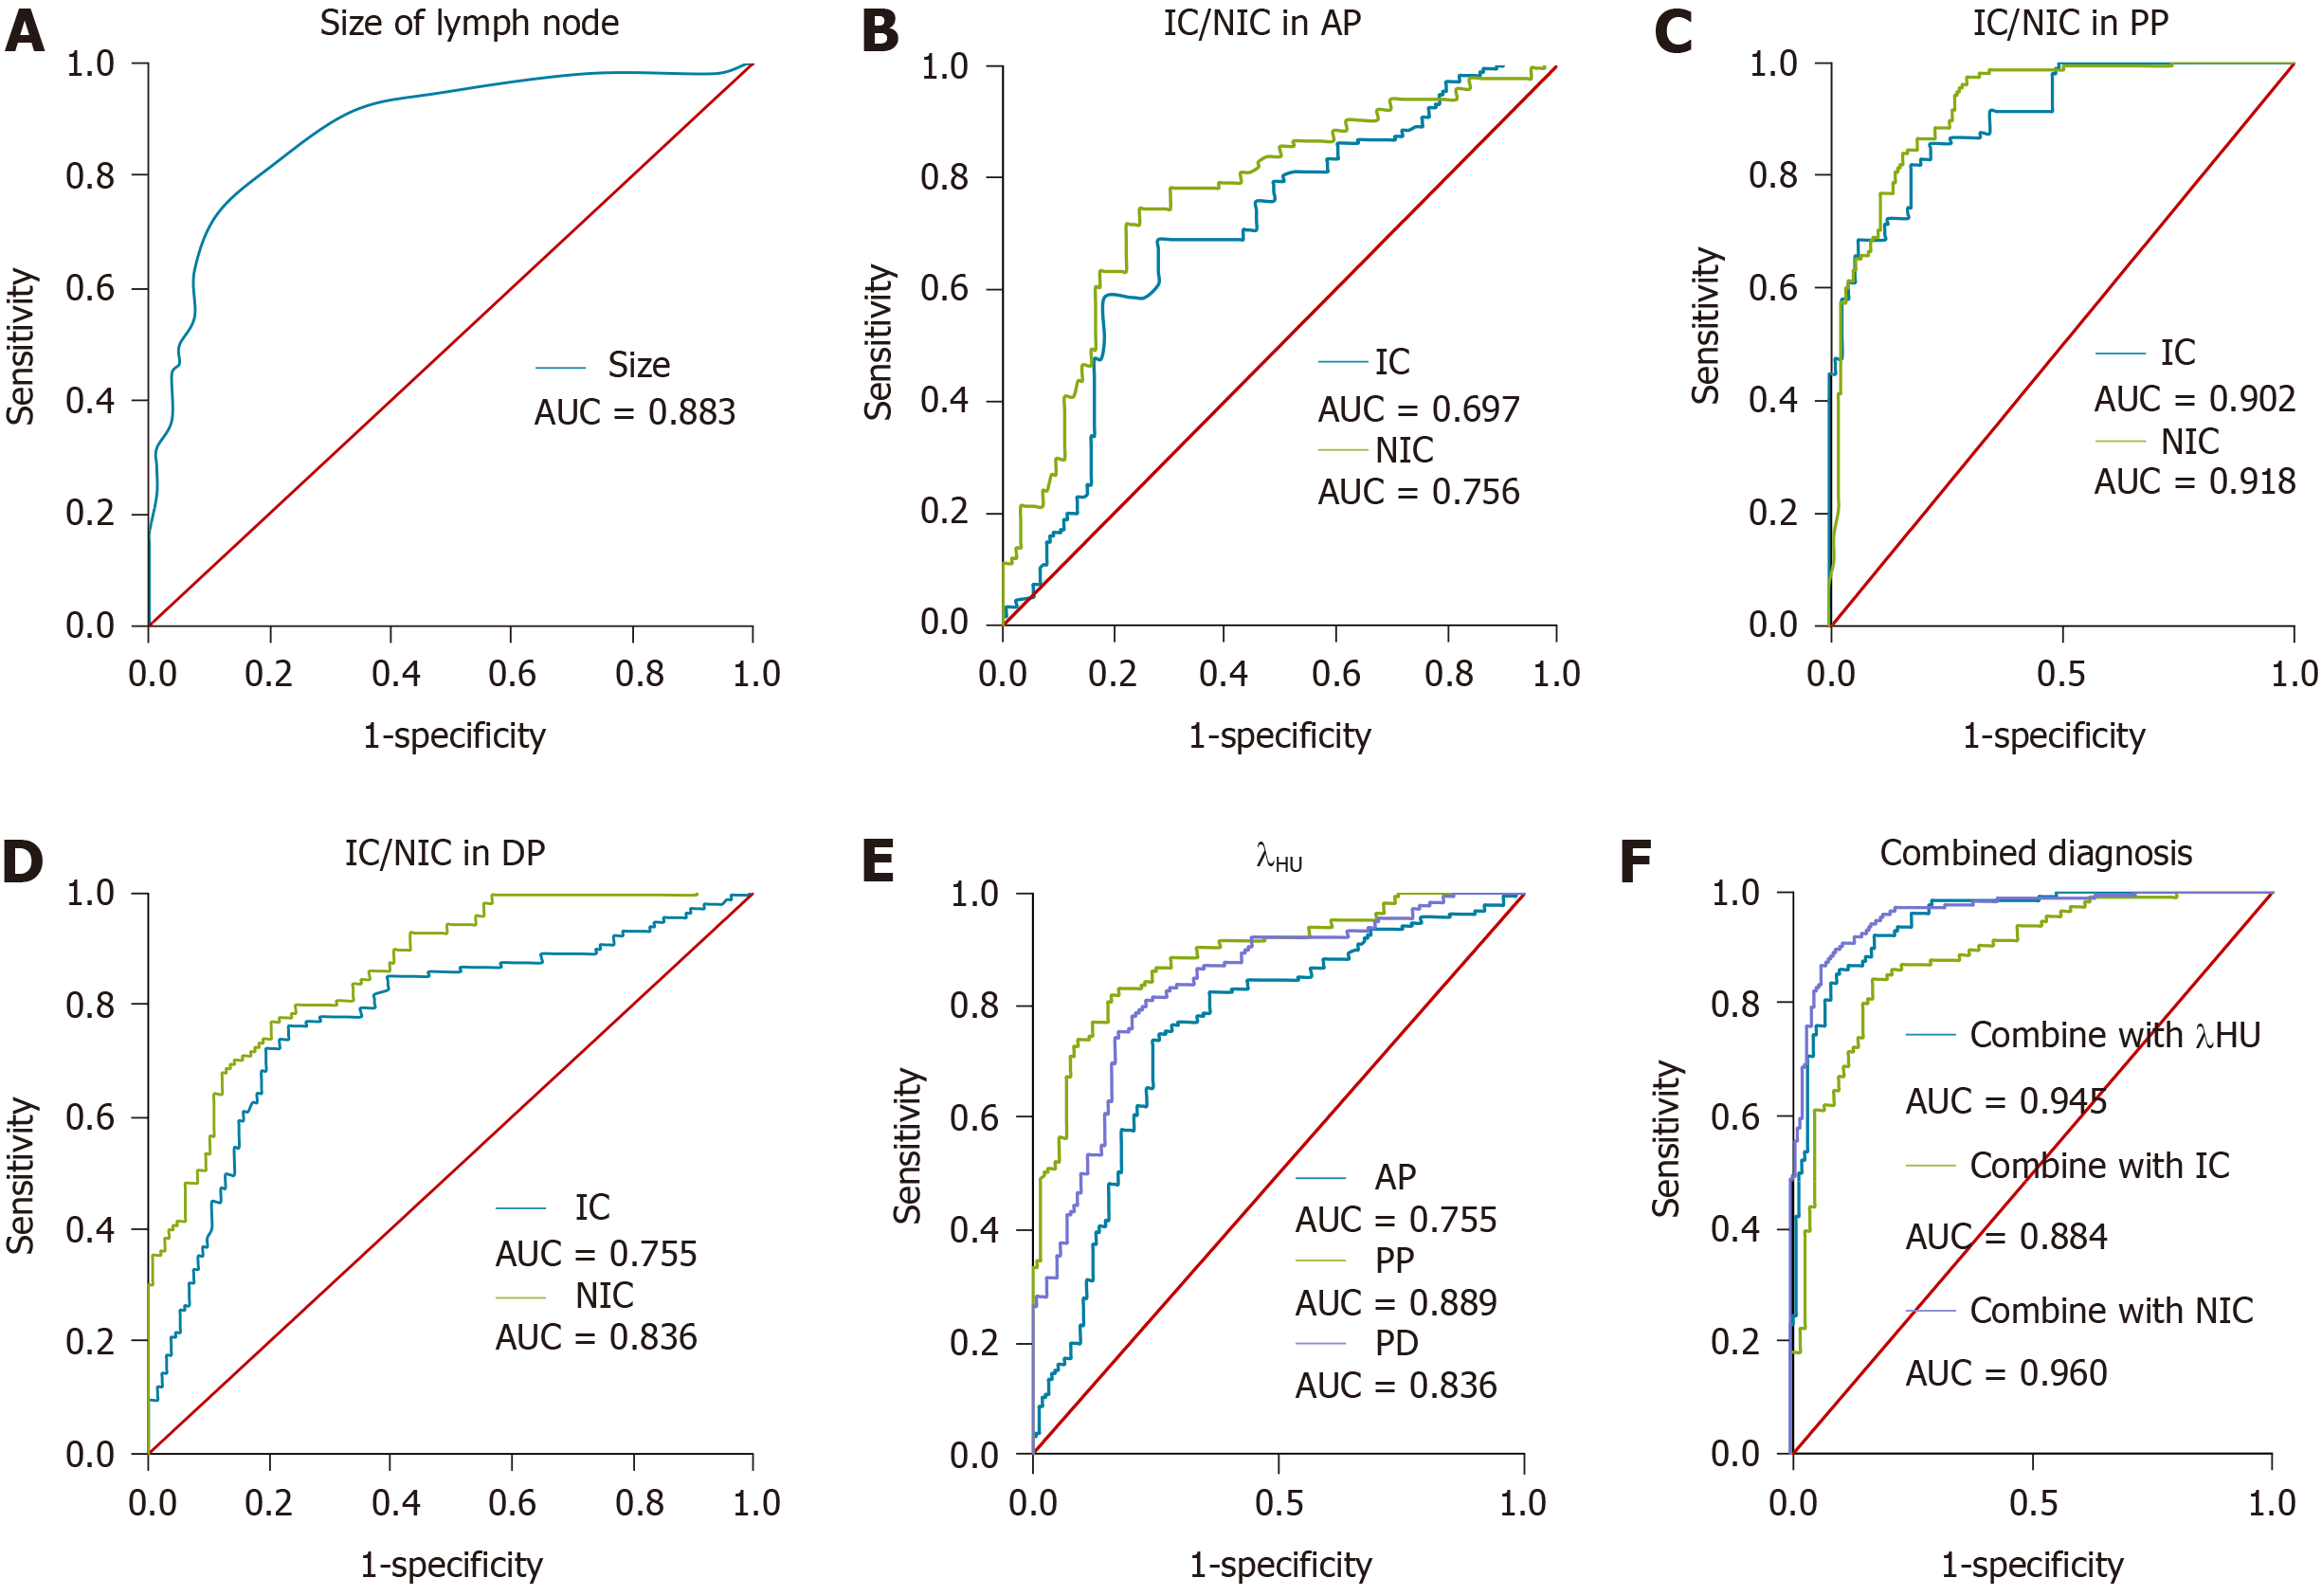
Figure 3 Receiver operating characteristic curve analysis of dual energy computed tomography quantitative parameters for metastatic and non-metastatic lymph nodes.
A: Maximal short axis diameter of lymph nodes; B: Iodine concentration (IC)/normalized IC (NIC) in the arterial phase; C: IC/NIC in the portal phase; D: IC/NIC in the delayed phase; E: Slope of the spectral curve (λHU) in three contrast-enhanced phases; F: Combination of maximal short axis diameter of lymph nodes with λHU, IC, or NIC in the portal phase. IC: Iodine concentration; NIC: Normalized iodine concentration; λHU: Slope of the spectral curve; AP: Arterial phase; PP: Portal phase; DP: Delayed phase.
Figure 4 A 44-year-old male with hepatocellular carcinoma and lymph node metastasis.
A and B: Region of interest was placed in the maximal axial section for lymph nodes (white arrow); C: The spectrum curve of the removed lymph nodes in the portal phase showed a descending curve with a slope of about 1.0-1.7. The iodine concentrations of the three lymph nodes were 20.01 mg/mL, 21.06 mg/mL, and 22.50 mg/mL, respectively. The normalized iodine concentrations were 0.41, 0.53, and 0.64, respectively.
Figure 5 A 31-year-old male with hepatocellular carcinoma and non-metastatic lymph nodes.
A: Region of interest was placed in the maximal axial section for lymph nodes (white arrow); B: Postoperative computed tomography showed that the lymph node was removed (white arrow); C: The spectrum curve of the removed lymph node in the portal phase showed a descending curve with a slope of about 0.8. The iodine concentration of the lymph node was 12.20 mg/mL. The normalized iodine concentration was 0.83.
- Citation: Zeng YR, Yang QH, Liu QY, Min J, Li HG, Liu ZF, Li JX. Dual energy computed tomography for detection of metastatic lymph nodes in patients with hepatocellular carcinoma. World J Gastroenterol 2019; 25(16): 1986-1996
- URL: https://www.wjgnet.com/1007-9327/full/v25/i16/1986.htm
- DOI: https://dx.doi.org/10.3748/wjg.v25.i16.1986


