©The Author(s) 2018.
World J Gastroenterol. Oct 28, 2018; 24(40): 4554-4564
Published online Oct 28, 2018. doi: 10.3748/wjg.v24.i40.4554
Published online Oct 28, 2018. doi: 10.3748/wjg.v24.i40.4554
Figure 1 Serum hepatitis C virus RNA levels and liver inflammation decrease rapidly with sofosbuvir and ledipasvir therapy.
A: Serum hepatitis C virus RNA levels of patients who all responded to therapy (n = 13). A response to sofosbuvir and ledipasvir therapy was defined as undetectable viremia at end of treatment (week 24); (B) Serum alanine aminotransferase. (C) Serum aspartate aminotransferase. HCV: Hepatitis C virus; Lloq: Lower limit of quantitation; Tnd: Target not detected; ALT: Alanine aminotransferase; AST: Aspartate aminotransferase.
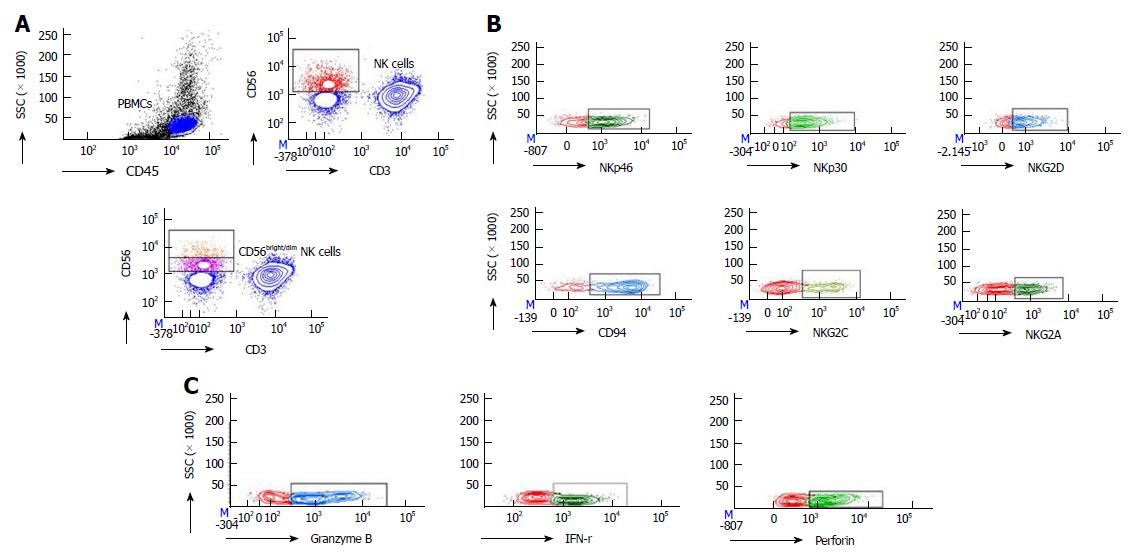
Figure 2 Flow cytometry results.
A: Isolation of human peripheral blood natural killer (NK) cells and subsets; B: The expression of NKp46, NKp30, NKG2D, CD94, NKG2C and NKG2A during and after the end of direct-acting antivirals (DAAs) treatment; C: The expression of Granzyme B, IFN-γ and perforin during and after the end of DAAs treatment. NK: Natural killer; IFN: Interferon; DAAs: Direct-acting antivirals.
Figure 3 Effect of sofosbuvir and ledipasvir therapy on the frequencies of natural killer cell subsets from chronic hepatitis C patients.
A: Frequencies of CD56+ natural killer (NK) cells in peripheral blood mononuclear cells (PBMCs); B: Frequencies of CD56bright NK cells in PBMCs; C: Frequencies of CD56dim NK cells in PBMCs. aP < 0.05 and bP ≤ 0.01 and cP ≤ 0.001, different time points of CHC patients vs healthy controls; dP < 0.05 and eP ≤ 0.01 and fP ≤ 0.001, different time points of CHC patients (2 wk, 4 wk, 8 wk, 12 wk, Pt-12 wk, Pt-24 wk vs 0 wk). NK: Natural killer; CHC: Chronic hepatitis C; Ctrl: Healthy controls; Pt: Post of treatment; PBMCs: Peripheral blood mononuclear cells.
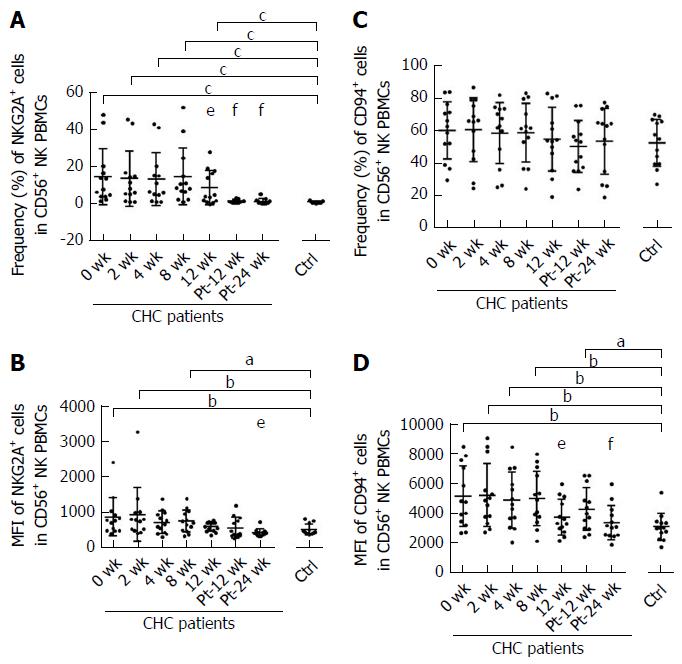
Figure 4 Sofosbuvir and ledipasvir therapy modulates the expression of NKG2A and CD94 on natural killer cells.
Flow cytometric analyses of inhibitory receptor NKG2A and CD94 on natural killer (NK) cells. The graphs display the frequencies and mean fluorescence intensity (MFI) of NKG2A (A-B) and CD94 (C-D) on NK cells from chronic hepatitis C (CHC) patients during and after direct-acting antivirals therapy and healthy controls (n = 13). aP < 0.05 and bP ≤ 0.01 and cP ≤ 0.001, different time points of CHC patients vs healthy controls; dP < 0.05 and eP ≤ 0.01 and fP ≤ 0.001, different time points of CHC patients (2 wk, 4 wk, 8 wk, 12 wk, Pt-12 wk, Pt-24 wk vs 0 wk). NK: Natural killer; PBMCs: Peripheral blood mononuclear cells; CHC: Chronic hepatitis C; Ctrl: Healthy controls; Pt: Post of treatment; MFI: Mean fluorescence intensity.
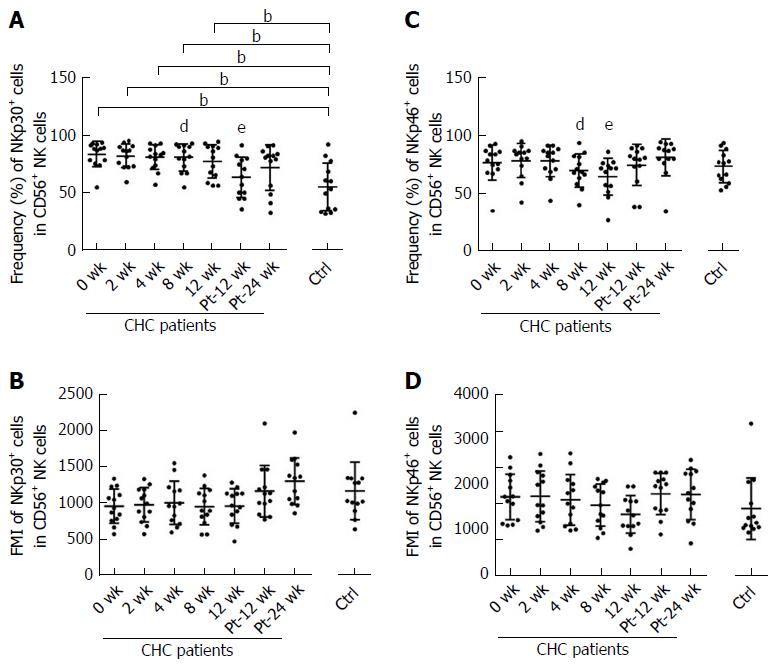
Figure 5 Sofosbuvir and ledipasvir therapy modulates the expression of NKp30 and NKp46 on natural killer cells.
Flow cytometric analyses of activating receptors NKp30 and NKp46 on natural killer (NK) cells. The graphs display the frequencies and mean fluorescence intensity (MFI) of NKp30 (A-B) and NKp46 (C-D) on NK cells from chronic hepatitis C (CHC) patients during and after Direct-acting antivirals therapy and healthy controls (n = 13). aP < 0.05 and bP ≤ 0.01 and cP ≤ 0.001, different time points of CHC patients vs healthy controls; dP < 0.05 and eP ≤ 0.01 and fP ≤ 0.001, different time points of CHC patients (2 wk, 4 wk, 8 wk, 12 wk, Pt-12 wk, Pt-24 wk vs 0 wk). NK: Natural killer; PBMCs: Peripheral blood mononuclear cells; CHC: Chronic hepatitis C; Ctrl: Healthy controls; Pt: Post of treatment; MFI: Mean fluorescence intensity.
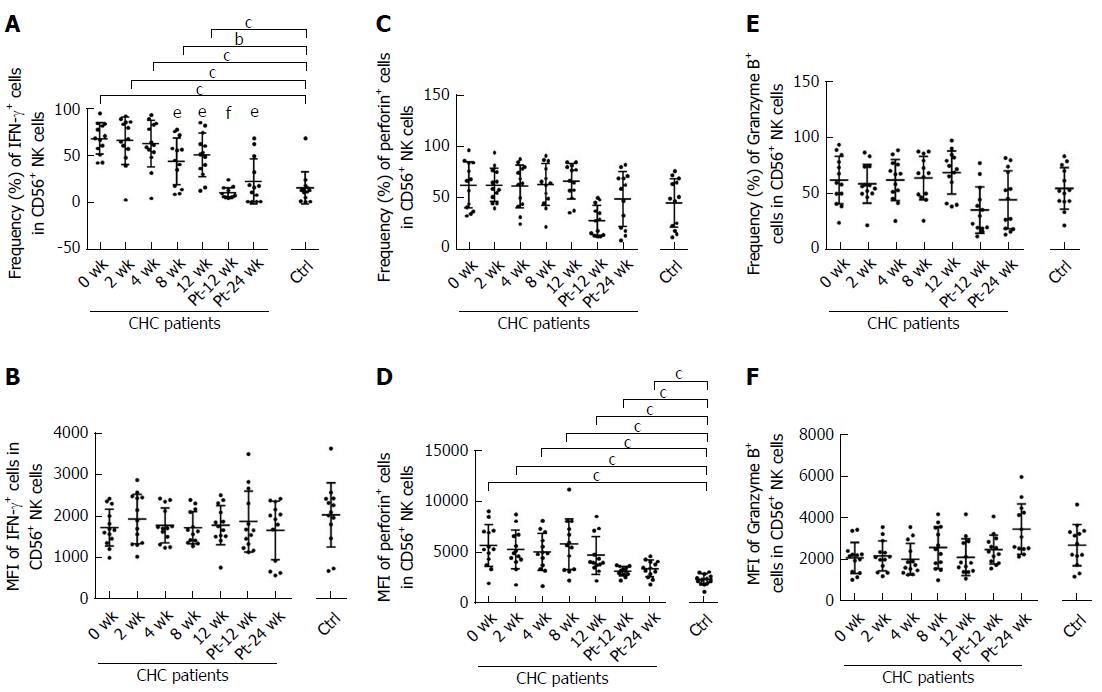
Figure 6 Sofosbuvir and ledipasvir therapy modulates the expression of natural killer cell-related cytokine interferon-γ, perforin and Granzyme B.
Flow cytometric analyses of interferon (IFN)-γ, perforin and Granzyme B expression in natural killer (NK) cells. The graphs display the frequencies and mean fluorescence intensity (MFI) of IFN-γ (A-B), perforin (C-D) and Granzyme B (E-F) in NK cells from CHC patients during and after direct-acting antivirals therapy and healthy controls (n = 13). aP < 0.05 and bP ≤ 0.01 and cP ≤ 0.001, different time points of CHC patients vs healthy controls; dP < 0.05 and eP ≤ 0.01 and fP ≤ 0.001, different time points of CHC patients (2 wk, 4 wk, 8 wk, 12 wk, Pt-12 wk, Pt-24 wk vs 0 wk). IFN: Interferon; NK: Natural killer; CHC: Chronic hepatitis C; Ctrl: Healthy controls; Pt: Post of treatment; MFI: Mean fluorescence intensity.
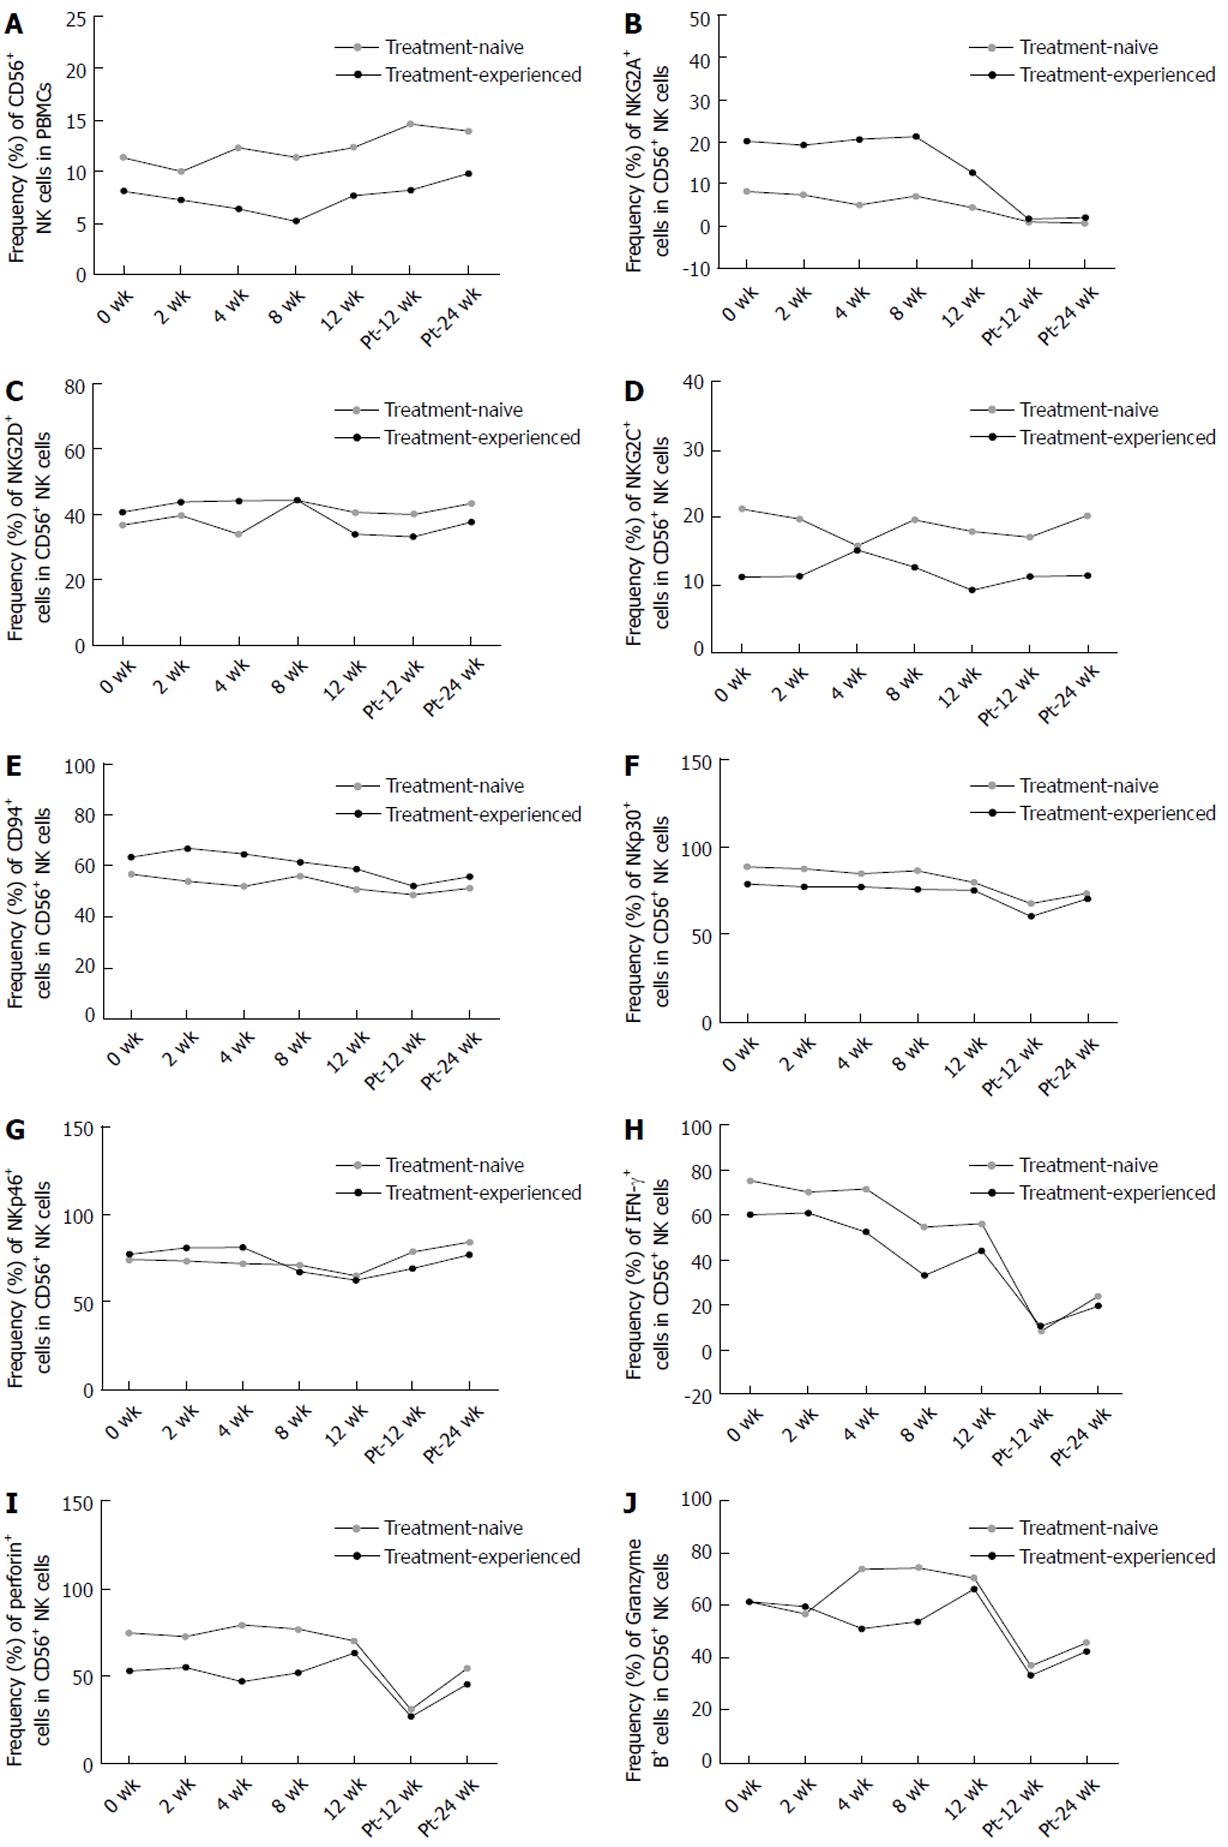
Figure 7 Frequency of CD56+ natural killer cells, phenotypes and cytokine expression of natural killer cells between treatment-naïve and treatment-experienced chronic hepatitis C patients.
Flow cytometric analyses of the frequency of CD56+ natural killer (NK) cells (A), the expression of NKG2A (B), NKG2D (C), NKG2C (D), CD94 (E), NKp30 (F), NKp46 (G), IFN-γ (H), perforin (I) and Granzyme B (J) expression of NK cells and the changing trend between treatment-naïve (n = 7) and treatment-experienced (n = 6) chronic hepatitis C patients during and after direct-acting antivirals therapy. Pt: Post of treatment; IFN: Interferon; NK: Natural killer; PBMCs: Peripheral blood mononuclear cells; CHC: Chronic hepatitis C.
- Citation: Wang XX, Luo BF, Jiang HJ, Cong X, Jin Q, Ma DL, Wei L, Feng B. Recovery of natural killer cells is mainly in post-treatment period in chronic hepatitis C patients treated with sofosbuvir plus ledipasvir. World J Gastroenterol 2018; 24(40): 4554-4564
- URL: https://www.wjgnet.com/1007-9327/full/v24/i40/4554.htm
- DOI: https://dx.doi.org/10.3748/wjg.v24.i40.4554


