Copyright
©The Author(s) 2018.
World J Gastroenterol. Jan 28, 2018; 24(4): 484-493
Published online Jan 28, 2018. doi: 10.3748/wjg.v24.i4.484
Published online Jan 28, 2018. doi: 10.3748/wjg.v24.i4.484
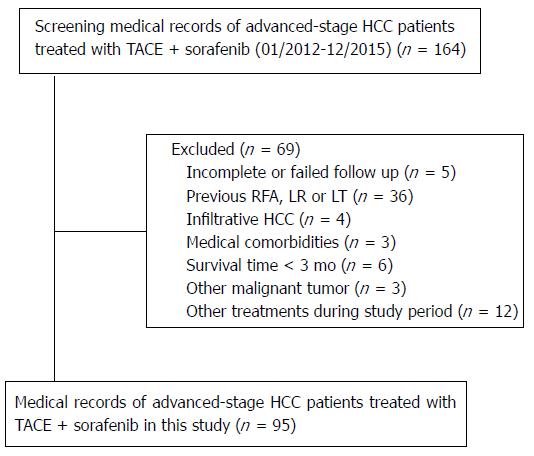
Figure 1 Flow diagram shows the selection of hepatocellular carcinoma patients.
HCC: Hepatocellular carcinoma; RFA: Radiofrequency ablation; LR: Liver resection; LT: Liver transplantation; TACE: Transarterial chemoembolization.
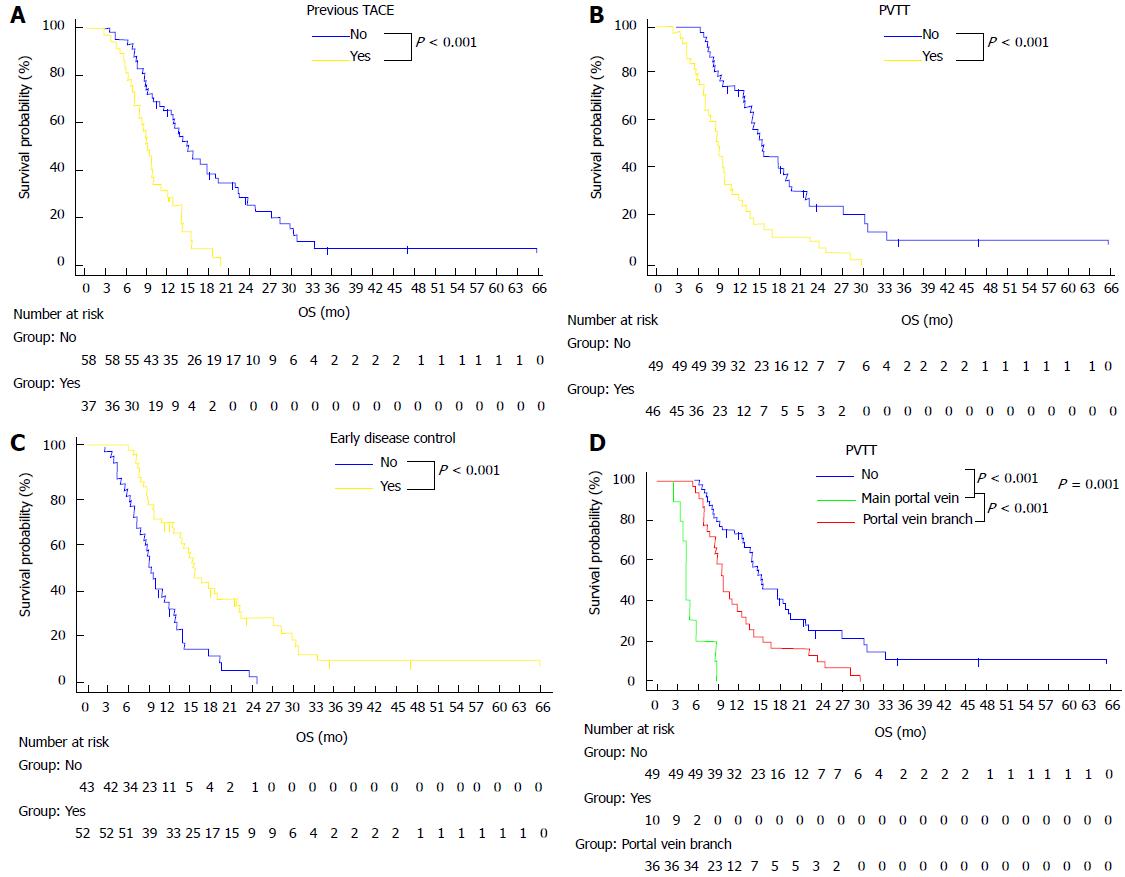
Figure 2 Kaplan-Meier curves of overall survival.
A: Comparison of the survival between patients who had previous TACE (Yes group) and patients who had no previous TACE (No group); B: Comparison of the survival between patients who had portal vein tumor thrombus (PVTT) (Yes group) and patients who had no PVTT (No group); C: Comparison of the survival between patients who had early disease control (Yes group) and patients who had no early disease control (No group); D: Comparison of the survival among patients with different types of PVTT: the absence of PVTT (No group), PVTT in the main portal vein (main portal vein group) and PVTT in the portal vein branch (portal vein branch group).
- Citation: Meng XC, Chen BH, Huang JJ, Huang WS, Cai MY, Zhou JW, Guo YJ, Zhu KS. Early prediction of survival in hepatocellular carcinoma patients treated with transarterial chemoembolization plus sorafenib. World J Gastroenterol 2018; 24(4): 484-493
- URL: https://www.wjgnet.com/1007-9327/full/v24/i4/484.htm
- DOI: https://dx.doi.org/10.3748/wjg.v24.i4.484


