©The Author(s) 2018.
World J Gastroenterol. Apr 14, 2018; 24(14): 1562-1578
Published online Apr 14, 2018. doi: 10.3748/wjg.v24.i14.1562
Published online Apr 14, 2018. doi: 10.3748/wjg.v24.i14.1562
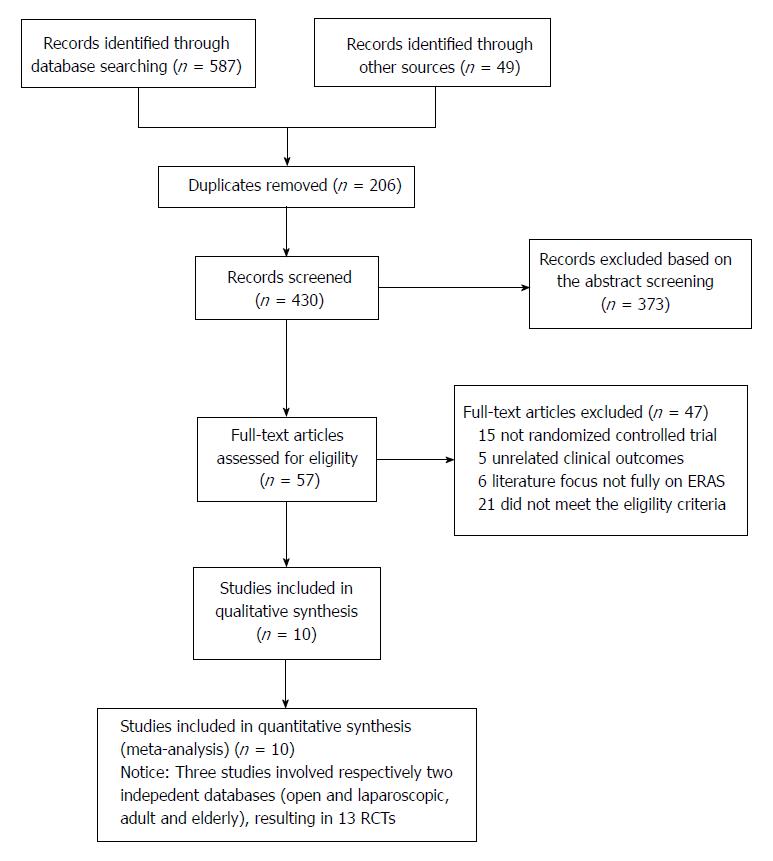
Figure 1 Study flow diagram: Enhanced recovery after surgery in gastric cancer.
ERAS: Enhanced recovery after surgery; RCTs: Randomized controlled trials.
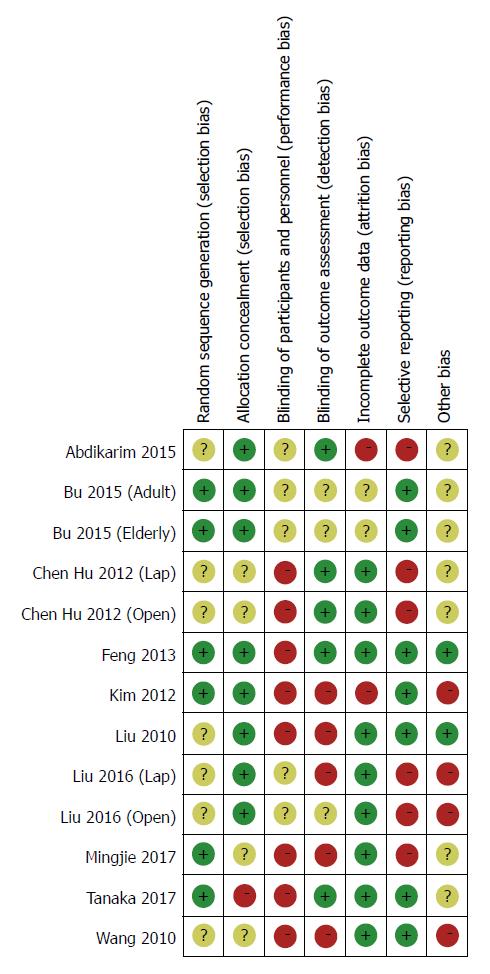
Figure 2 Risk of bias summary: Review of authors' judgments concerning each risk-of-bias item for each included study.
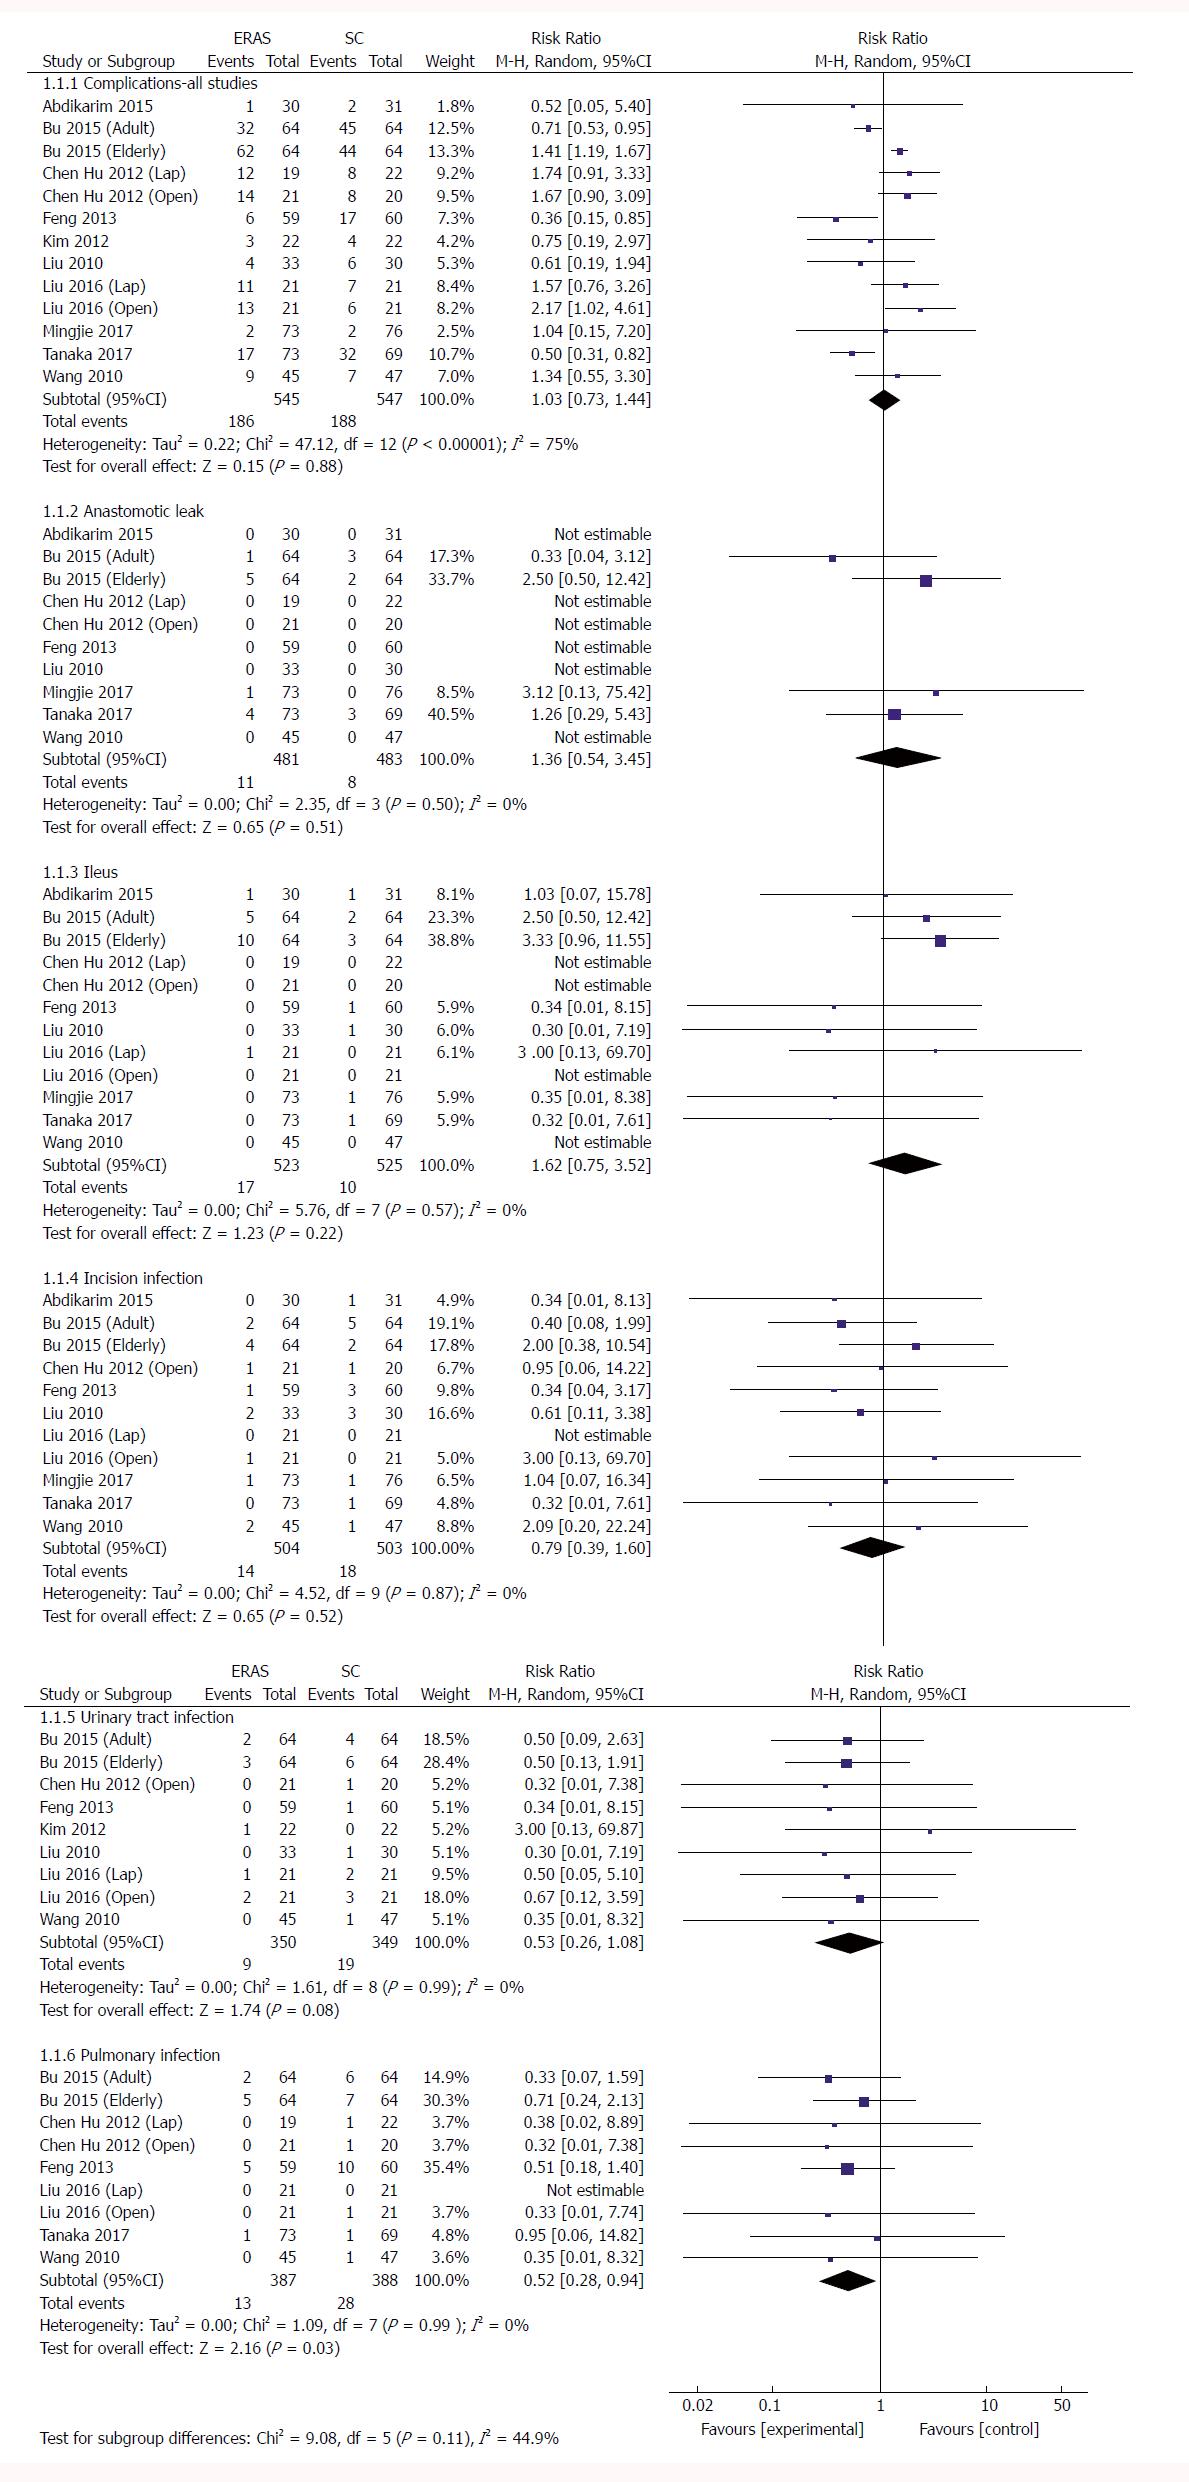
Figure 3 Forest plot evaluating the relative risk of surgical complications: Enhanced recovery after surgery vs standard care.
ERAS: Enhanced recovery after surgery; SC: Standard care.
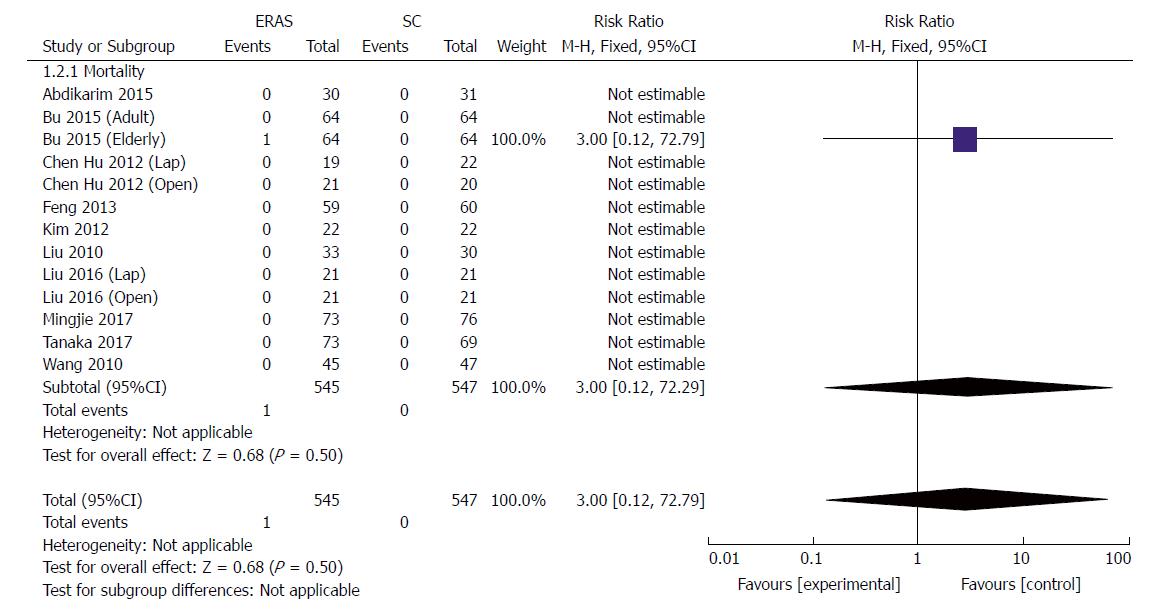
Figure 4 Forest plot evaluating the relative risk of short-term mortality: Enhanced recovery after surgery vs standard care.
ERAS: Enhanced recovery after surgery; SC: Standard care.
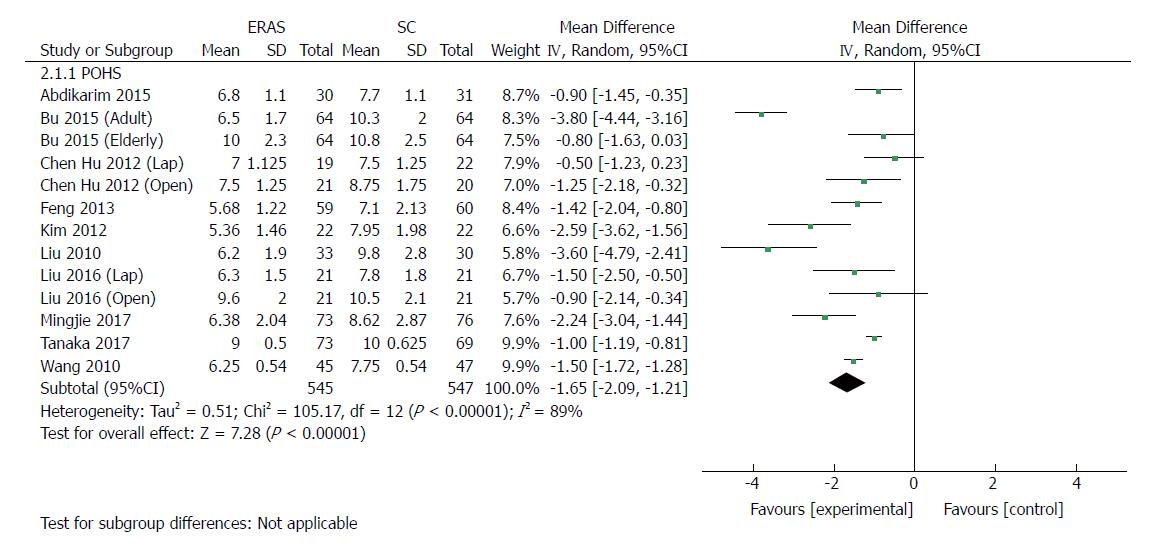
Figure 5 Forest plot evaluating the length of postoperative hospital stay: Enhanced recovery after surgery vs standard care.
ERAS: Enhanced recovery after surgery; SC: Standard care.
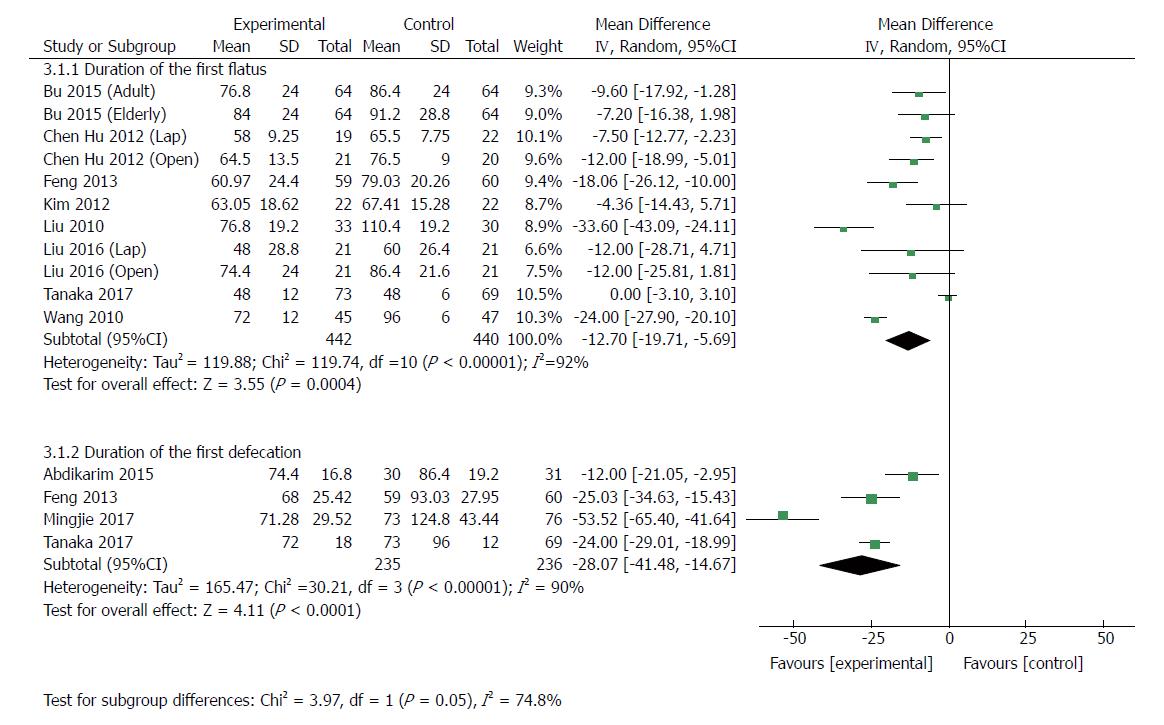
Figure 6 Forest plot evaluating the duration of intestinal function recovery: Enhanced recovery after surgery vs standard care.
ERAS: Enhanced recovery after surgery; SC: Standard care.
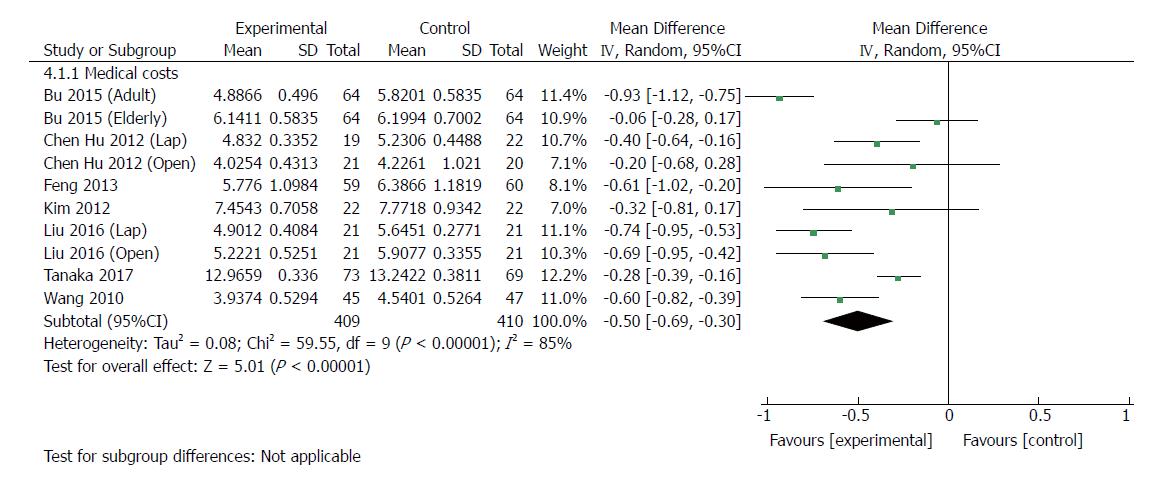
Figure 7 Forest plot evaluating the difference in total medical costs: Enhanced recovery after surgery vs standard care.
ERAS: Enhanced recovery after surgery; SC: Standard care.
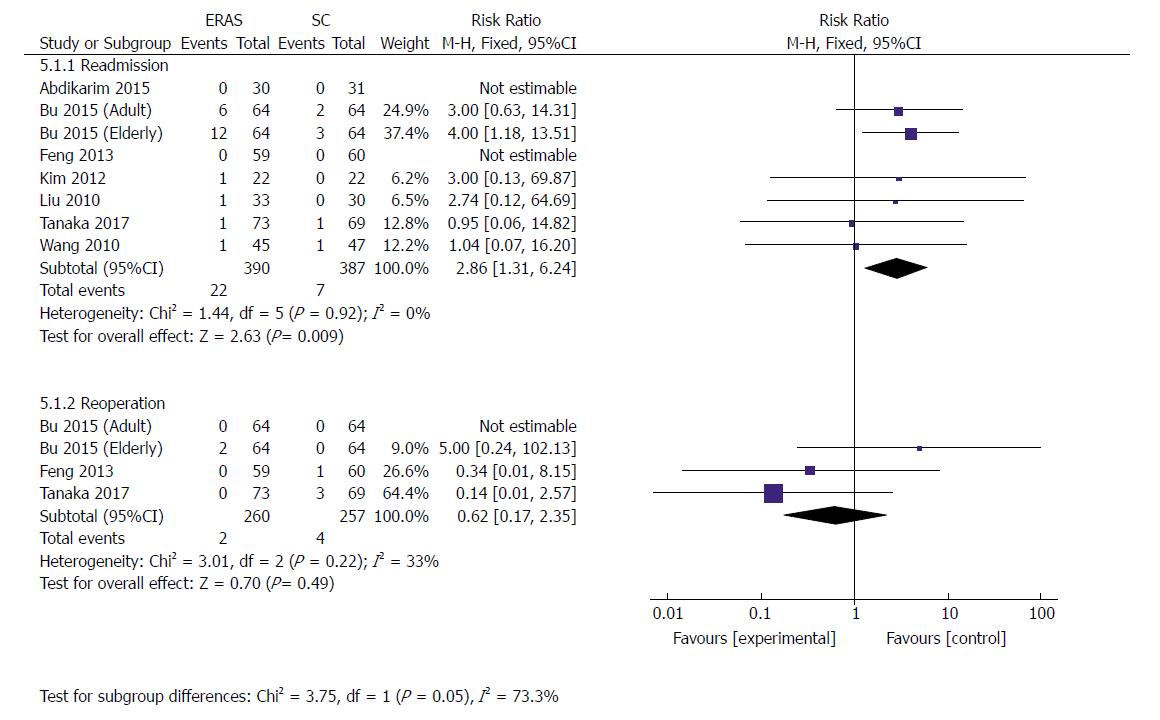
Figure 8 Forest plot evaluating the incidence of readmission and reoperation within 30 d: Enhanced recovery after surgery vs standard care.
ERAS: Enhanced recovery after surgery; SC: Standard care.
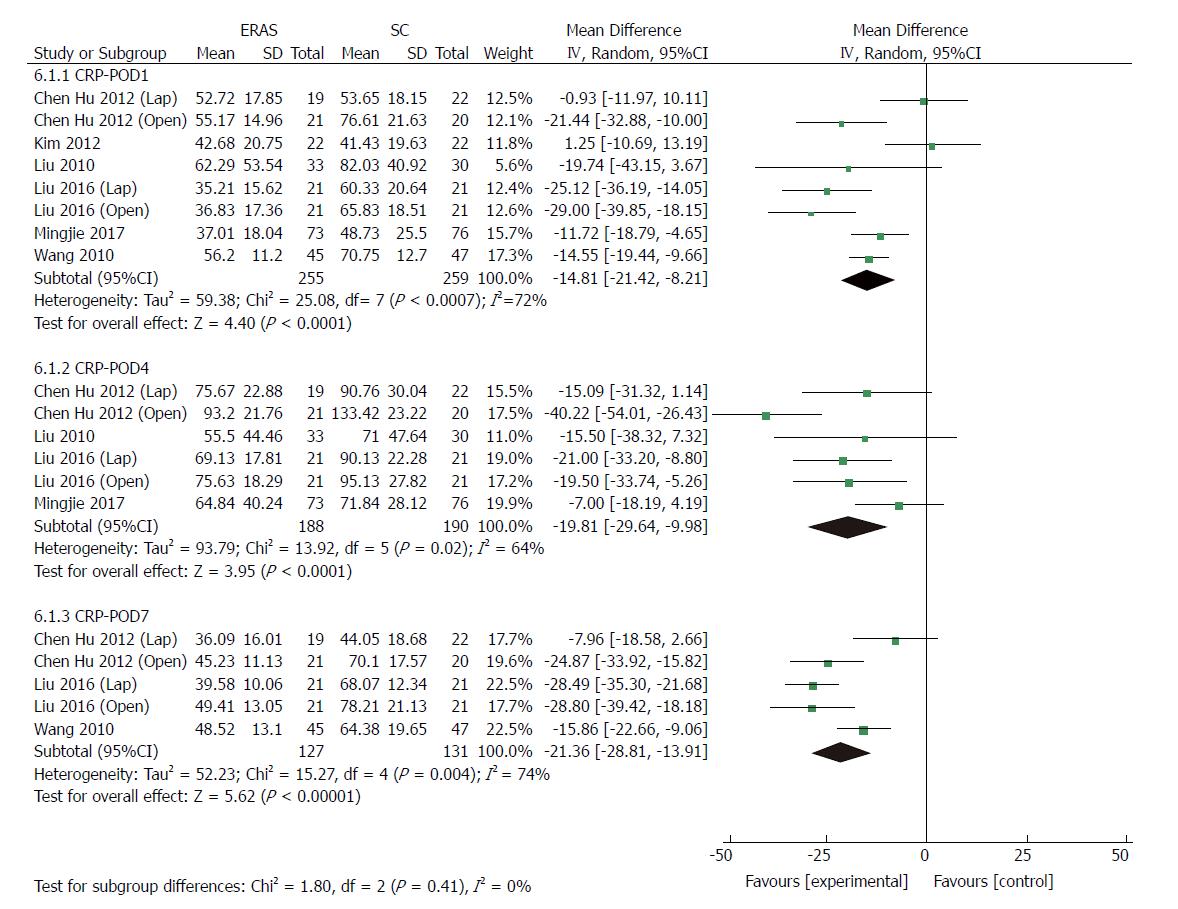
Figure 9 Forest plot evaluating the postoperative level of C-reactive protein: Enhanced recovery after surgery vs standard care.
CRP: C-reactive protein; ERAS: Enhanced recovery after surgery; SC: Standard care.
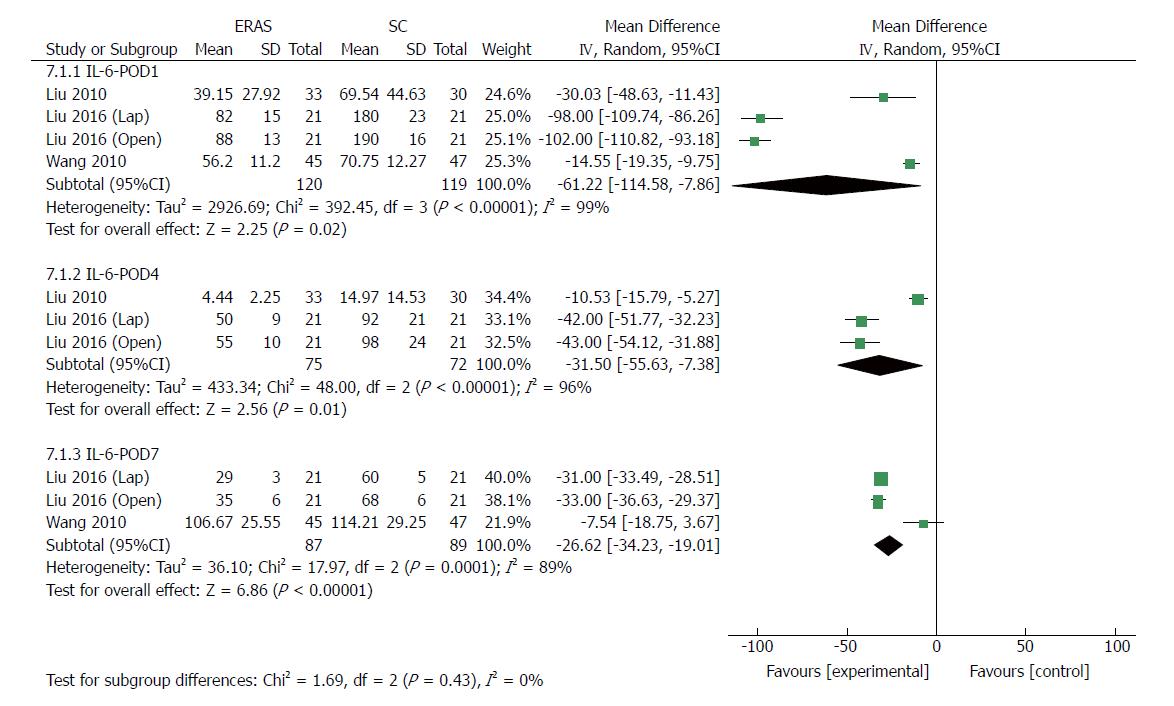
Figure 10 Forest plot evaluating the postoperative level of IL-6: Enhanced recovery after surgery vs standard care.
ERAS: Enhanced recovery after surgery; IL: Interleukin; SC: Standard care.
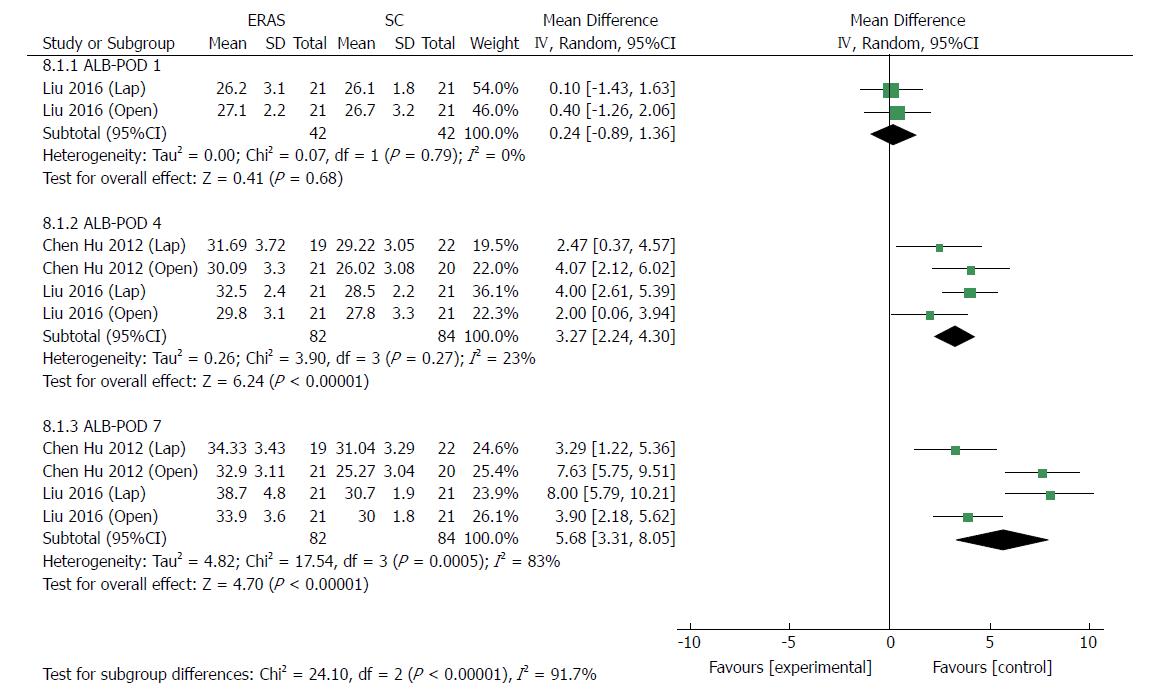
Figure 11 Forest plot evaluating the postoperative level of serum albumin: Enhanced recovery after surgery vs standard care.
ALB: Albumin; ERAS: Enhanced recovery after surgery; SC: Standard care.
Figure 12 Forest plot evaluating health-related quality of life: Enhanced recovery after surgery vs standard care.
ERAS: Enhanced recovery after surgery; SC: Standard care.
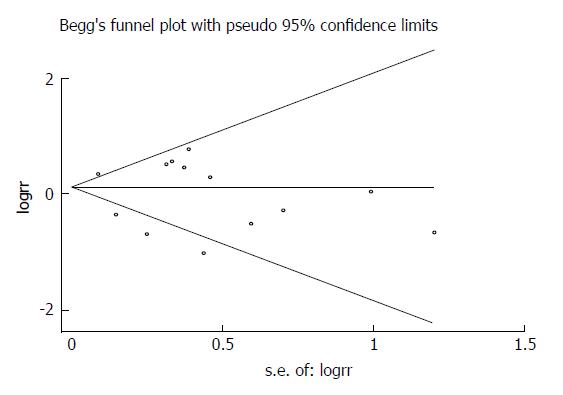
Figure 13 Begg’s funnel plot to explore publication bias of all the included studies.
- Citation: Wang LH, Zhu RF, Gao C, Wang SL, Shen LZ. Application of enhanced recovery after gastric cancer surgery: An updated meta-analysis. World J Gastroenterol 2018; 24(14): 1562-1578
- URL: https://www.wjgnet.com/1007-9327/full/v24/i14/1562.htm
- DOI: https://dx.doi.org/10.3748/wjg.v24.i14.1562


