©The Author(s) 2017.
World J Gastroenterol. Mar 7, 2017; 23(9): 1666-1675
Published online Mar 7, 2017. doi: 10.3748/wjg.v23.i9.1666
Published online Mar 7, 2017. doi: 10.3748/wjg.v23.i9.1666
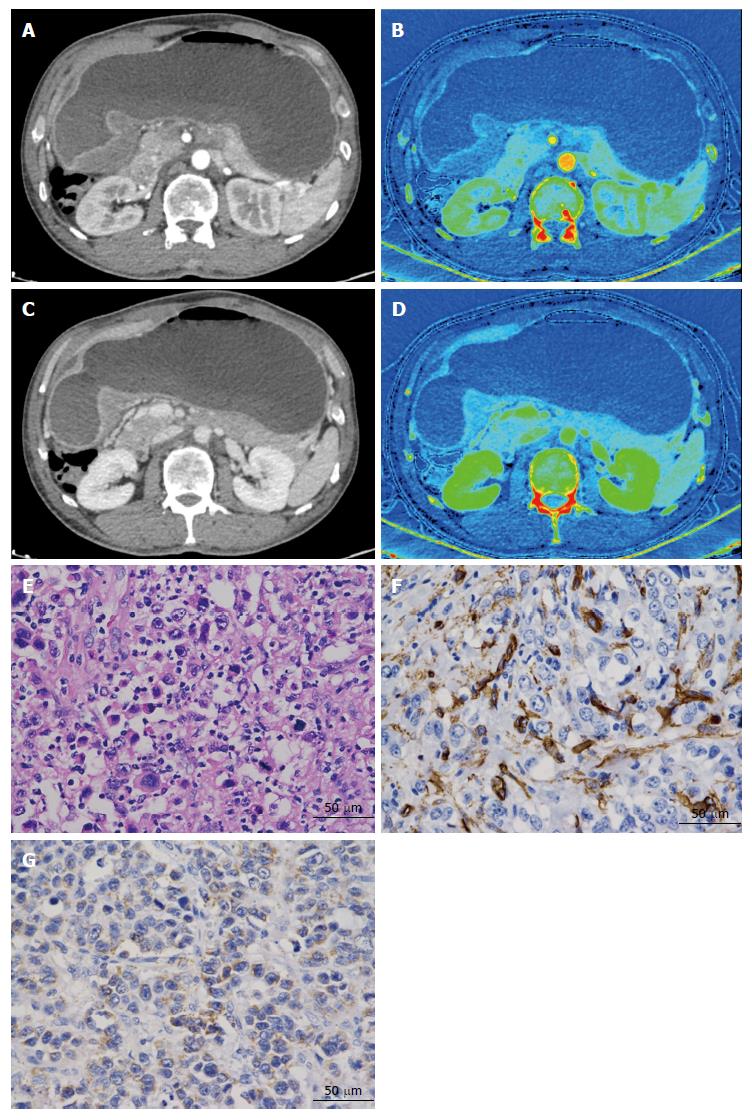
Figure 1 Detection of the iodine concentration value in a 51-year-old man with poorly differentiated adenocarcinoma, with staging IIIc (T4aN3M0).
A: The monochromatic image shows focal wall thickening in the gastric antrum; B: The iodine-water image with iodine concentration (IC) value 12.83 (100 µg/cm3), normalized IC (nIC) value 0.11 in the arterial phase. Monochromatic image (C) and iodine-water image (D) with IC value 23.91 (100 µg/cm3), nIC value 0.53 in the venous phase; E: Hematoxylin and eosin staining of a pathological section obtained from radical surgery shows poorly differentiated, diffused subtype in the Lauren classification (× 400); F: CD34-staining shows endothelial cells stained brown; micro-vessels form clusters or have tiny hollow lumens (micro-vessel density 45/magnification × 400). G: Weak vascular endothelial growth factor staining in the cytoplasm (× 400) with score 2.
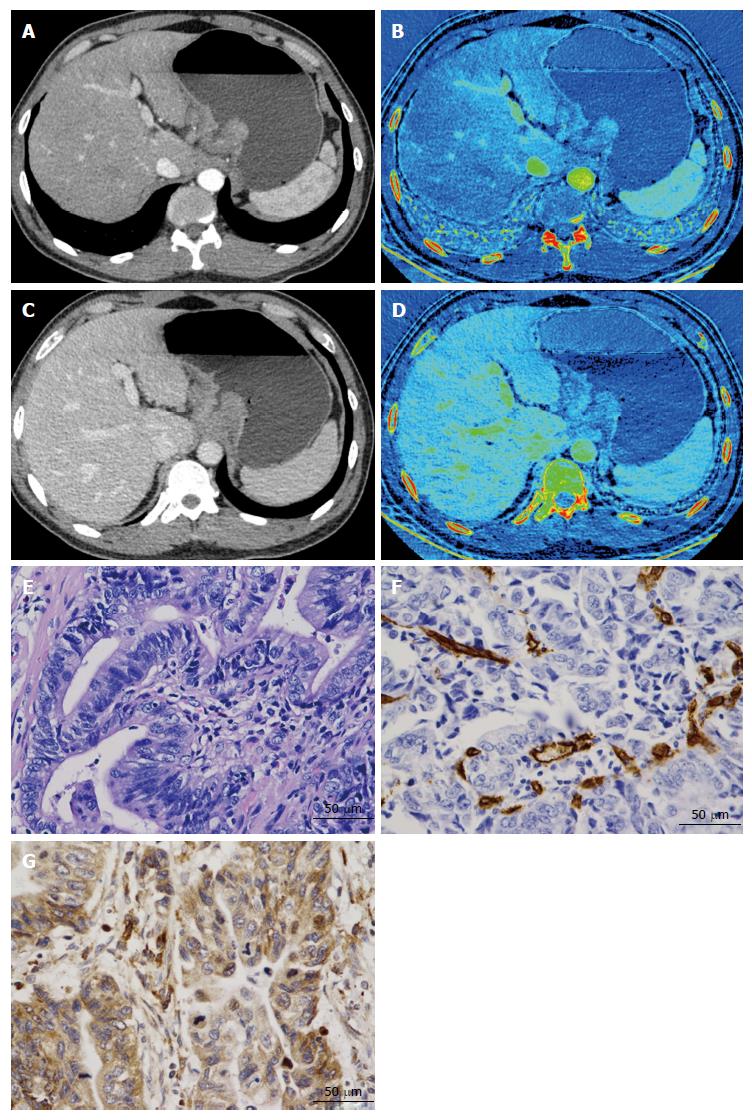
Figure 2 Detection of iodine concentration value in a 50-year-old man with moderate differentiated adenocarcinoma, of staging IIIa (T4aN1M0).
A: Monochromatic image shows focal wall thickening in the gastric cardia and lesser curvature; B: The iodine-water image with iodine concentration (IC) value 11.78 (100 µg/cm3), normalized IC (nIC) value 0.09 in the arterial phase; Monochromatic image (C) and (D) iodine-water image with IC value 18.63 (100 µg/cm3), nIC value 0.34 in the venous phase; E: Hematoxylin and eosin staining shows a moderately differentiated, intestinal Lauren subtype (× 400); F: Immunohistochemical staining shows CD34 positive micro-vessel (micro-vessel density count: 27/magnification × 400); G: Strongly positive vascular endothelial growth factor staining (× 400) with score 5.
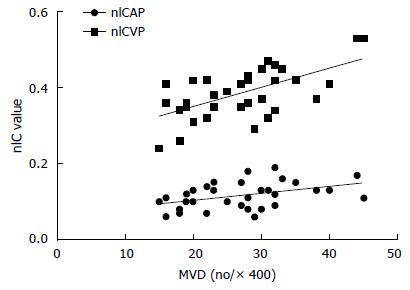
Figure 3 Scatter plots of normalized iodine concentration in arterial phase, normalized iodine concentration in venous phase, and microvessel density counts in tumor lesions (r = 0.
423 for normalized iodine concentration in arterial phase, r = 0.606 for normalized iodine concentration in venous phase). VEGF: Vascular endothelial growth factor; nIC: Normalized iodine concentration; nIC-AP: nIC-arterial phase; nIC-VP: nIC-venous phase; MVD: Microvessel density.
Figure 4 Comparison of normalized iodine concentration in arterial phase; and normalized iodine concentration in venous phase between the normal gastric wall and tumor site (A); comparison of normalized iodine concentration in arterial phase and normalized iodine concentration in venous phase between the vascular endothelial growth factor-positive and -negative group (B).
aP < 0.05, bP < 0.001. VEGF: Vascular endothelial growth factor; nIC: Normalized iodine concentration; AP: Arterial phase; VP: Venous phase.
- Citation: Chen XH, Ren K, Liang P, Chai YR, Chen KS, Gao JB. Spectral computed tomography in advanced gastric cancer: Can iodine concentration non-invasively assess angiogenesis? World J Gastroenterol 2017; 23(9): 1666-1675
- URL: https://www.wjgnet.com/1007-9327/full/v23/i9/1666.htm
- DOI: https://dx.doi.org/10.3748/wjg.v23.i9.1666


