Copyright
©The Author(s) 2017.
World J Gastroenterol. Dec 21, 2017; 23(47): 8321-8333
Published online Dec 21, 2017. doi: 10.3748/wjg.v23.i47.8321
Published online Dec 21, 2017. doi: 10.3748/wjg.v23.i47.8321
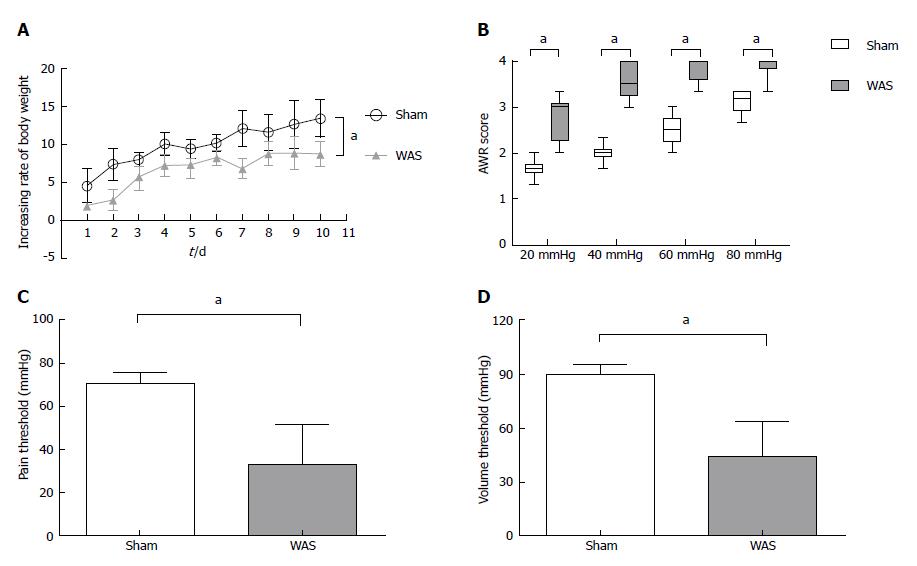
Figure 1 Effect of water avoidance stress on rate of weight gain and visceral sensitivity.
A: Rate of weight gain (g) was lower in the water avoidance stress (WAS) group (n = 13) compared to the sham-WAS (n = 14) group. Values represent mean weight gain ± SD, repeated analysis of variance (ANOVA); B: Abdominal withdrawal reflex (AWR) scores in response to colorectal distension were increased in the WAS group compared to the sham-WAS group. Lines within the box represent the median value, ends of the box represent 25th and 75th percentiles, and the error bars represent 5th and 95th percentiles. Wilcoxon two-sample test; C: Pain threshold was decreased in the WAS group compared to the sham-WAS group. Values represent mean ± SD, Student’s t-test; D: Volume threshold was decreased in the WAS group compared to the sham-WAS group. Values represent means values ± SD, Student’s t-test. aP < 0.05, Sham vs WAS.
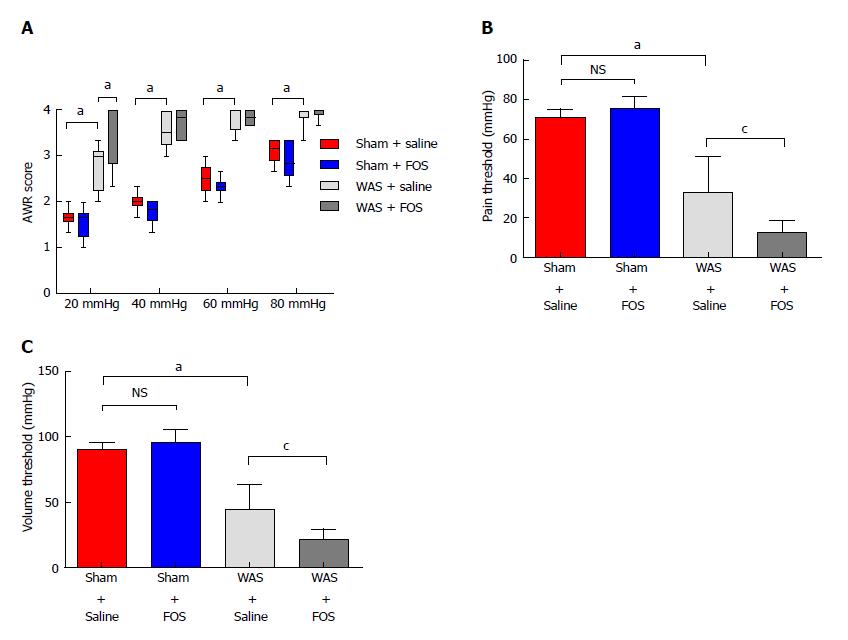
Figure 2 Effect of oral gavage of fructo-oligosaccharide on visceral sensitivity.
A: Fructo-oligosaccharide (FOS) increased abdominal withdrawal reflex (AWR) scores in response to colorectal distension compared to saline administration following water avoidance stress (WAS). Values represent median, 25th, 75th, 5th, and 95th percentiles. Sham + saline (n = 7), sham + FOS (n = 7), WAS + saline (n = 6), WAS + FOS (n = 7). Kruskal-Wallis one-way ANOVA; B: Pain threshold decreased in FOS-administered compared to saline-administered mice following WAS. Values represent mean ± SD, one-way ANOVA; C: Volume threshold decreased in FOS compared to saline-administered mice following WAS. Values represent mean ± SD, one-way ANOVA. aP < 0.05, sham + saline vs WAS + saline; cP < 0.05, WAS + saline vs WAS + FOS.
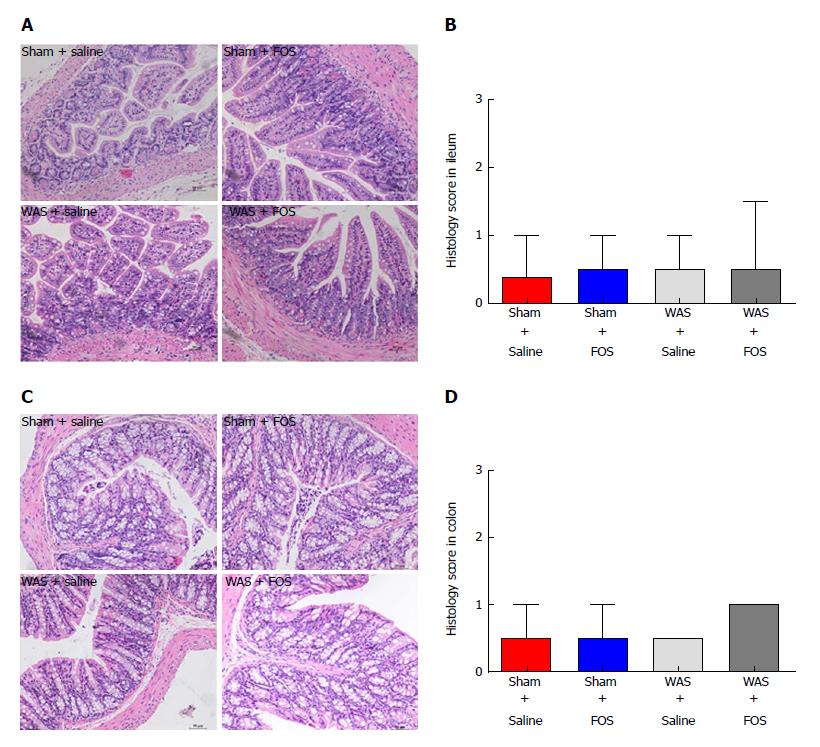
Figure 3 Effect of oral gavage of fructo-oligosaccharide on intestinal histological scores.
A: Ileal tissues stained with hematoxylin-eosin (HE) for evaluation of inflammation score (magnification, 200×); B: No difference in structural histology among the four groups; C: Colonic tissues stained with H&E for evaluation of inflammation score (magnification, 200×); D: No difference in structural histology among the four groups. Values represent median with 5th and 95th percentiles; sham + saline (n = 7), sham + FOS (n = 7), WAS + saline (n = 6), WAS + FOS (n = 7); Kruskal-Wallis one-way ANOVA. FOS: Fructo-oligosaccharide; WAS: Water avoidance stress.
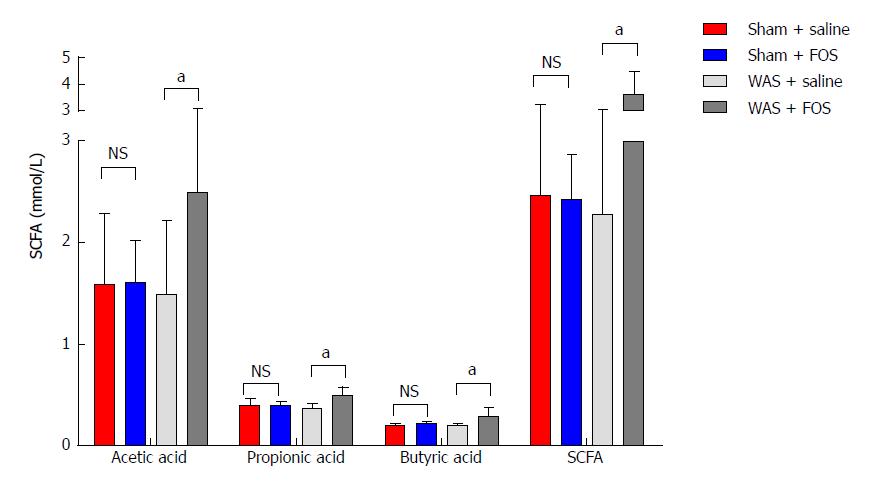
Figure 4 Effect of oral gavage of fructo-oligosaccharide on short chain fatty acid concentrations.
The average concentrations of total SCFA, acetic, propionic, and butyric acids increased in FOS-administered mice compared to saline-administered mice following WAS intervention. No difference was observed in total SCFA, acetic, propionic, and butyric acid levels with FOS or saline administration in mice following sham-WAS. Values represent mean ± SD; sham + saline (n = 7), sham + FOS (n = 7), WAS + saline (n = 6), WAS + FOS (n = 7); one-way ANOVA. aP < 0.05, WAS + saline vs WAS + FOS. SCFA: Short chain fatty acids; FOS: Fructo-oligosaccharide; WAS: Water avoidance stress.
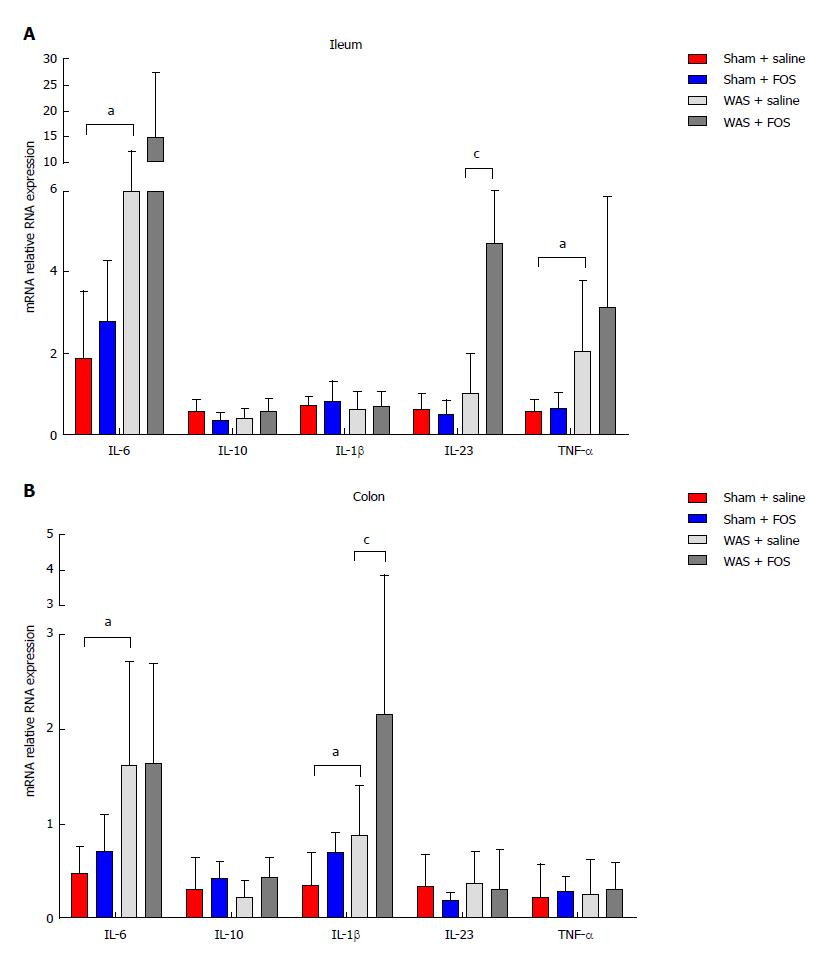
Figure 5 Effect of oral gavage of fructo-oligosaccharide on intestinal cytokine expression.
A: Among saline-administered mice, IL-6 and TNF-α expressions increased in the ileum in the WAS group compared to the sham-WAS group. IL-23 expression increased in FOS compared to saline-administered mice following WAS; B: In saline-administered mice, colonic IL-6 and IL-1β expression increased in the WAS group compared to the sham-WAS group. IL-1β expression increased in FOS compared to saline-administered mice in the WAS group. Values represent mean ± SD; sham + saline (n = 7), sham + FOS (n = 7), WAS + saline (n = 6), WAS + FOS (n = 7); one-way ANOVA. aP < 0.05, sham + saline vs WAS + saline; cP < 0.05, WAS + saline vs WAS + FOS. FOS: Fructo-oligosaccharide; WAS: Water avoidance stress; IL: Interleukin; TNF: Tumor necrosis factor.
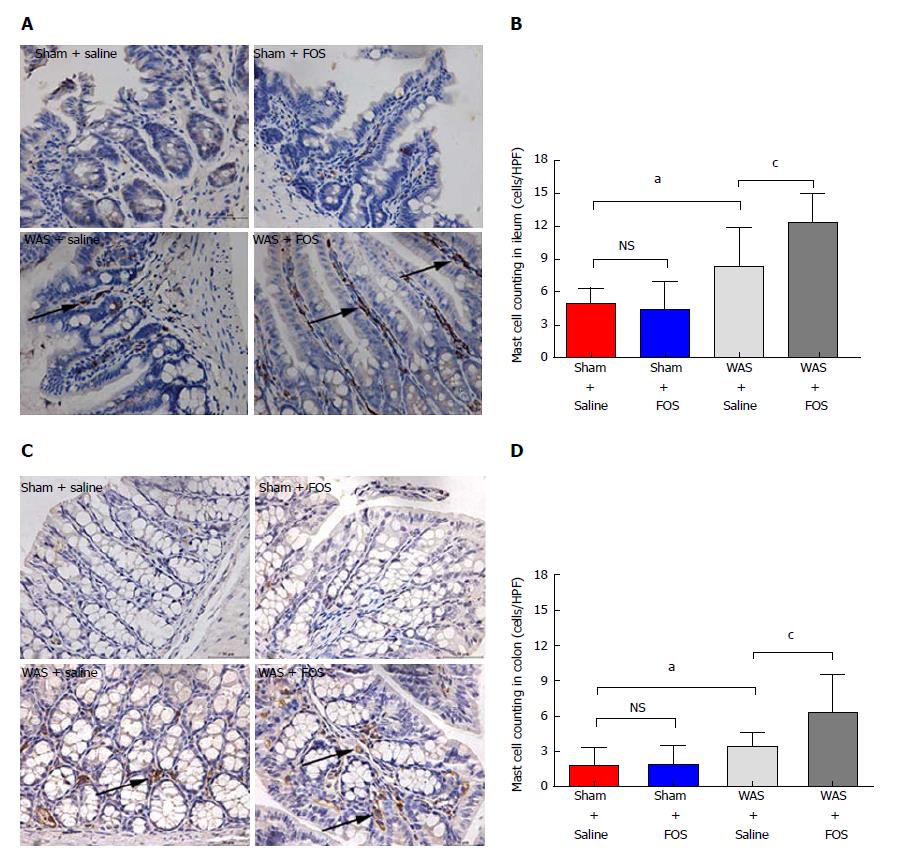
Figure 6 Effect of oral gavage of fructo-oligosaccharide on the number of mucosal mast cells (arrows).
A: Ileal tissues stained with mast cell tryptase (magnification, 400 ×); B: In saline administered mice, mast cell counts increased in WAS compared to the sham-WAS group. Mast cell counts increased in FOS compared to saline administered mice following WAS; C: Colon stained with mast cell tryptase (magnification, 400 ×); D: In saline-administered mice, mast cell count increased in the WAS group compared to the sham-WAS group. Mast cell count increased in FOS compared to saline-administered mice following WAS. Values represent mean ± SD; sham + saline (n = 7), sham + FOS (n = 7), WAS + saline (n = 6), WAS + FOS (n = 7); one-way ANOVA. aP < 0.05, sham + saline vs WAS + saline; cP < 0.05, WAS + saline vs WAS + FOS. FOS: Fructo-oligosaccharide; WAS: Water avoidance stress.
- Citation: Chen BR, Du LJ, He HQ, Kim JJ, Zhao Y, Zhang YW, Luo L, Dai N. Fructo-oligosaccharide intensifies visceral hypersensitivity and intestinal inflammation in a stress-induced irritable bowel syndrome mouse model. World J Gastroenterol 2017; 23(47): 8321-8333
- URL: https://www.wjgnet.com/1007-9327/full/v23/i47/8321.htm
- DOI: https://dx.doi.org/10.3748/wjg.v23.i47.8321


