Copyright
©The Author(s) 2017.
World J Gastroenterol. Aug 28, 2017; 23(32): 5994-6002
Published online Aug 28, 2017. doi: 10.3748/wjg.v23.i32.5994
Published online Aug 28, 2017. doi: 10.3748/wjg.v23.i32.5994
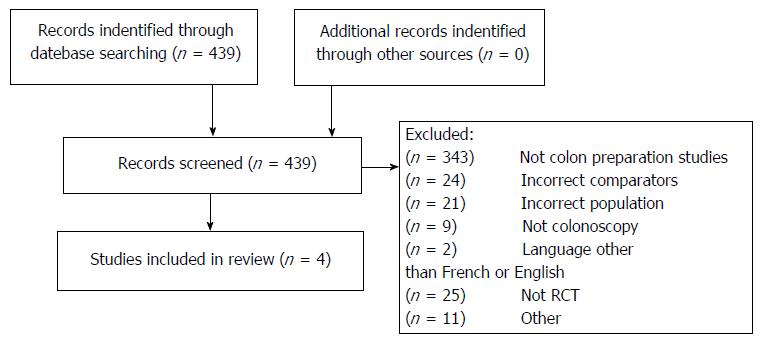
Figure 1 STROBE diagram.
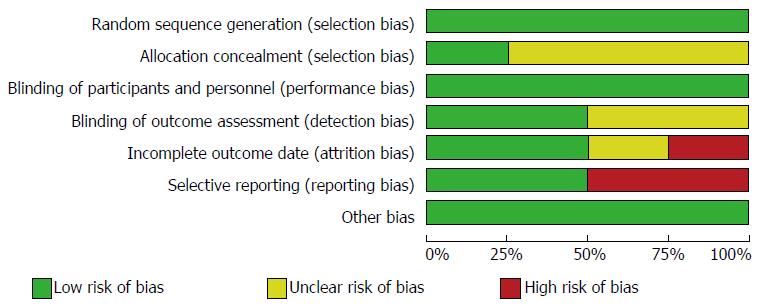
Figure 2 Cochrane risk bias tool.
Figure 3 Forest plot quality of preparation comparing polyethylene glycol high-dose vs polyethylene glycol low-dose with adjuvant.
- Citation: Restellini S, Kherad O, Bessissow T, Ménard C, Martel M, Taheri Tanjani M, Lakatos PL, Barkun AN. Systematic review and meta-analysis of colon cleansing preparations in patients with inflammatory bowel disease. World J Gastroenterol 2017; 23(32): 5994-6002
- URL: https://www.wjgnet.com/1007-9327/full/v23/i32/5994.htm
- DOI: https://dx.doi.org/10.3748/wjg.v23.i32.5994


