©The Author(s) 2017.
World J Gastroenterol. Jan 14, 2017; 23(2): 345-356
Published online Jan 14, 2017. doi: 10.3748/wjg.v23.i2.345
Published online Jan 14, 2017. doi: 10.3748/wjg.v23.i2.345
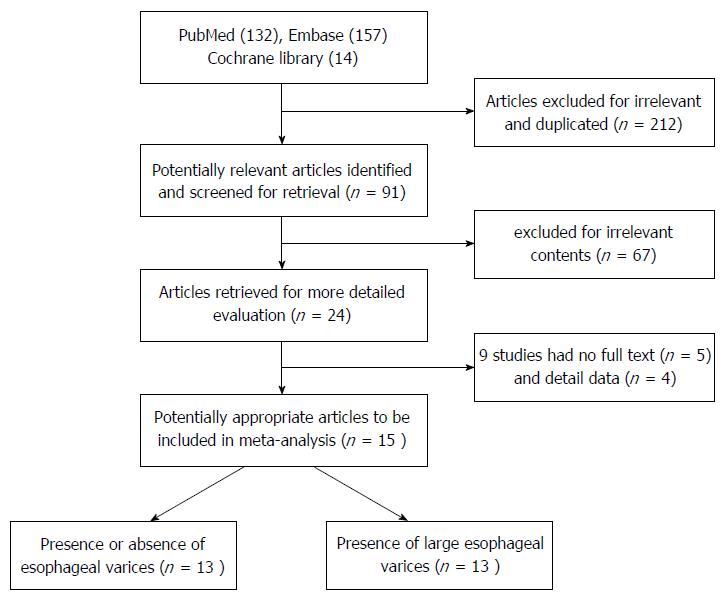
Figure 1 Flow chart of the details of the study.
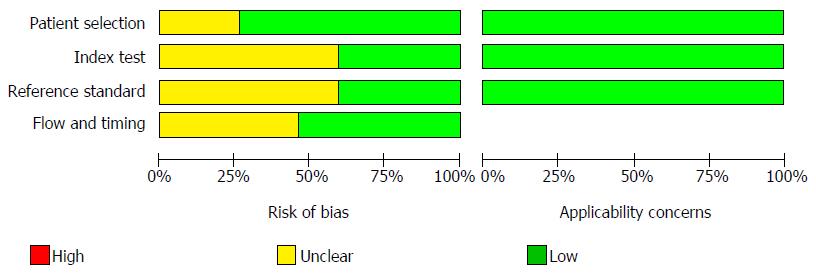
Figure 2 Methodological quality graph.
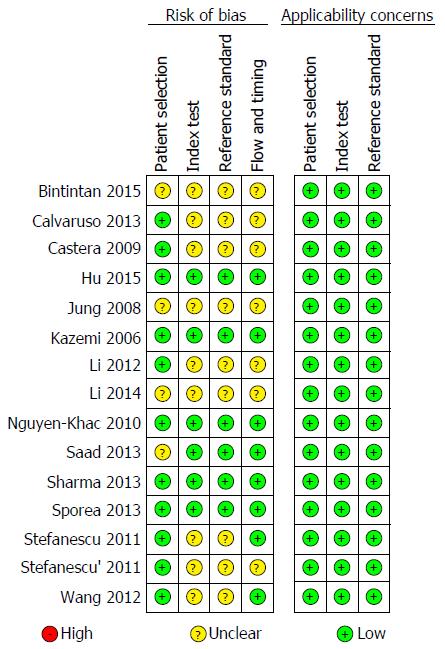
Figure 3 Summary of the methodological assessment of the included studies basing on the Cochrane handbook.
+: Low risk; -: High risk; ?: Unclear.
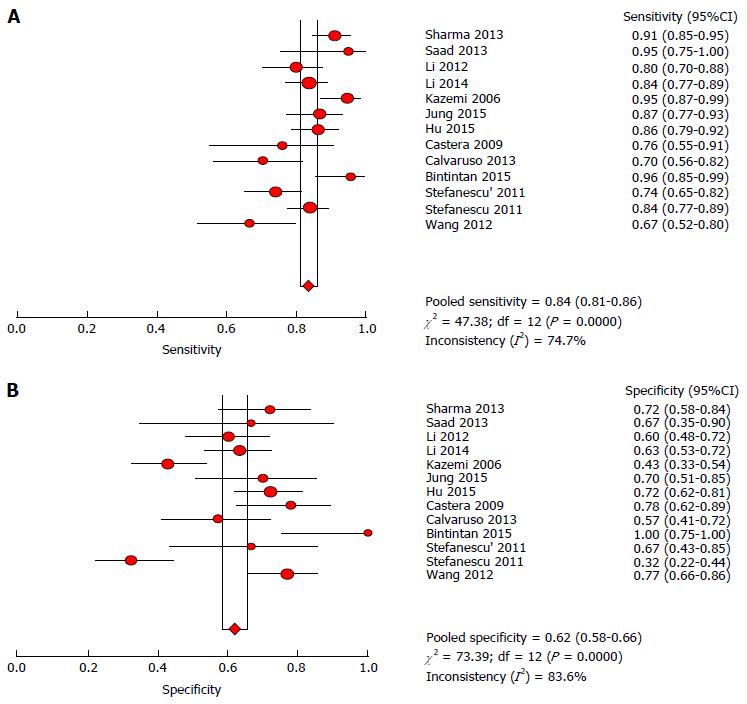
Figure 4 Forest plots and meta-analyses of studies showing the pooled sensitivity (A) and specificity (B) of FibroScan for diagnosing the presence of esophageal varices in cirrhotic patients.
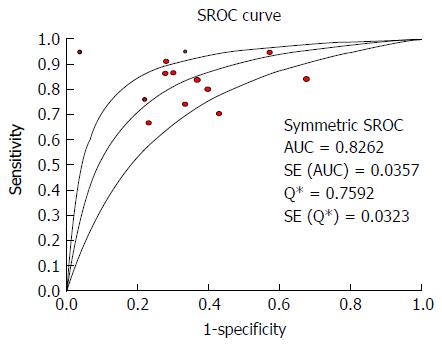
Figure 5 Summary receiver operating characteristic curve of FibroScan for the diagnosis of esophageal varices.
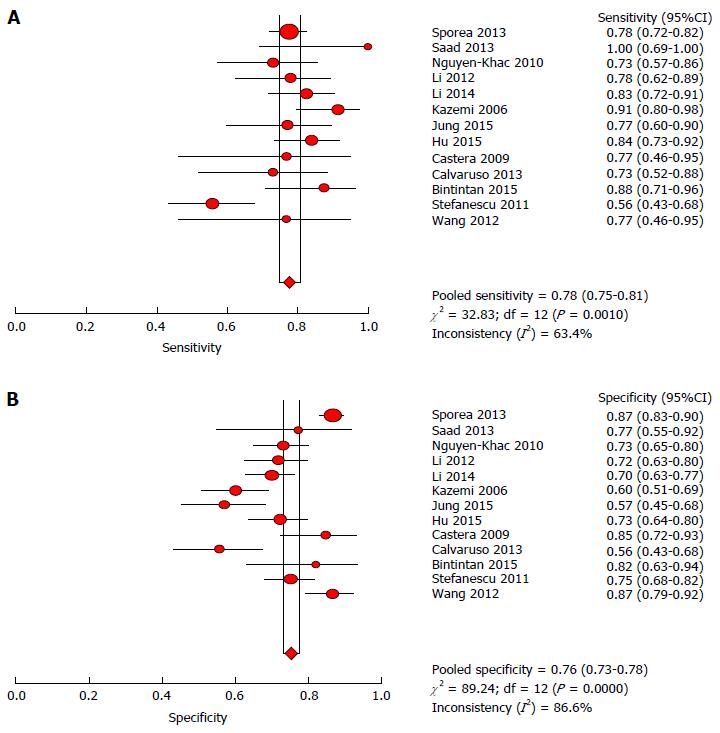
Figure 6 Forest plots and meta-analyses of studies showing the pooled sensitivity (A) and specificity (B) of FibroScan for diagnosing the presence of significant esophageal varices in cirrhotic patients.
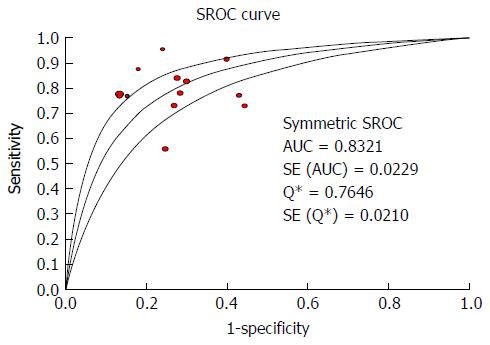
Figure 7 Summary receiver operating characteristic curve of FibroScan for the detection of significant esophageal varices.
- Citation: Pu K, Shi JH, Wang X, Tang Q, Wang XJ, Tang KL, Long ZQ, Hu XS. Diagnostic accuracy of transient elastography (FibroScan) in detection of esophageal varices in patients with cirrhosis: A meta-analysis. World J Gastroenterol 2017; 23(2): 345-356
- URL: https://www.wjgnet.com/1007-9327/full/v23/i2/345.htm
- DOI: https://dx.doi.org/10.3748/wjg.v23.i2.345


