©The Author(s) 2017.
World J Gastroenterol. May 14, 2017; 23(18): 3269-3278
Published online May 14, 2017. doi: 10.3748/wjg.v23.i18.3269
Published online May 14, 2017. doi: 10.3748/wjg.v23.i18.3269
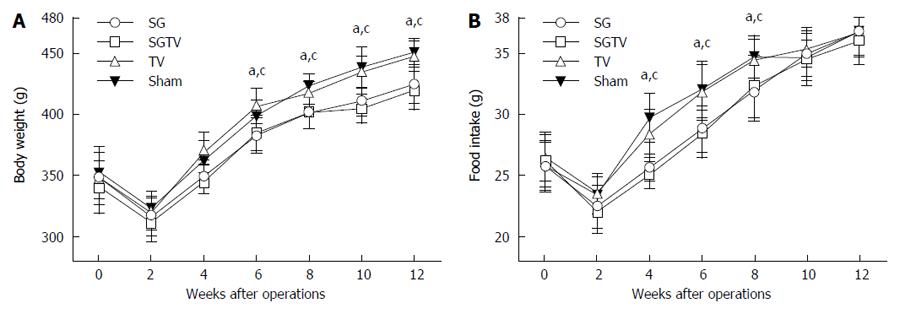
Figure 1 Body weight and energy intake.
Body weight (A) and food intake (B) of rats at baseline, and at 2, 4, 6, 8, 10 and 12 wk after operations. No significant differences were observed between the SG and SGTV group, or between the TV and Sham group preoperatively. aP < 0.05 vs TV group, cP < 0.05 vs Sham group. SG: Sleeve gastrectomy; TV: Trunk vagotomy; SGTV: Sleeve gastrectomy plus trunk vagotomy.
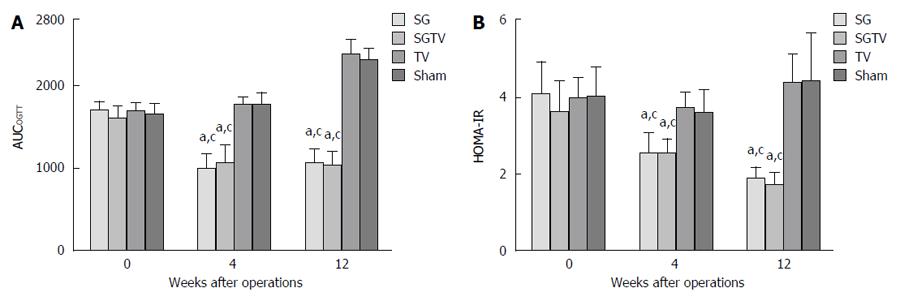
Figure 2 Areas under the curves for oral glucose tolerance test and homeostasis model assessment of insulin resistance.
AUCOGTT (A) and HOMA-IR (B) in rats at baseline, and at 4 and 12 wk after operations. aP < 0.05 vs TV group; cP < 0.05 vs Sham group. AUCOGTT: Areas under the curves for oral glucose tolerance test; HOMA-IR: Homeostasis model assessment of insulin resistance; SG: Sleeve gastrectomy; TV: Trunk vagotomy; SGTV: Sleeve gastrectomy plus trunk vagotomy.
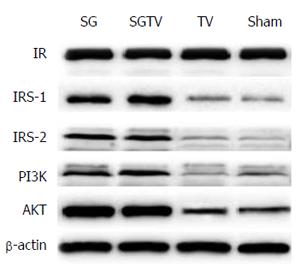
Figure 3 Expression of proteins in the insulin signaling pathway in the liver.
The expression of hepatic IR, IRS-1, IRS-2, PI3K and AKT 12 wk after operations. SG: Sleeve gastrectomy; TV: Trunk vagotomy; SGTV: Sleeve gastrectomy plus trunk vagotomy.
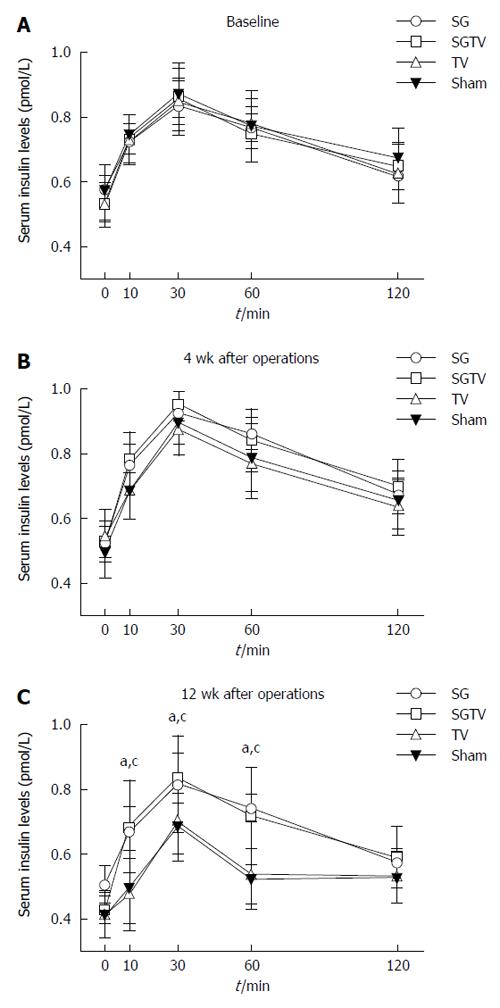
Figure 4 Serum insulin levels after oral glucose gavage.
Serum insulin levels after oral glucose gavage (1 g/kg) before operations (A) and at 4 (B) and 12 (C) wk after operations. aP < 0.05 vs TV group; cP < 0.05 vs Sham group. SG: Sleeve gastrectomy; TV: Trunk vagotomy; SGTV: Sleeve gastrectomy plus trunk vagotomy.
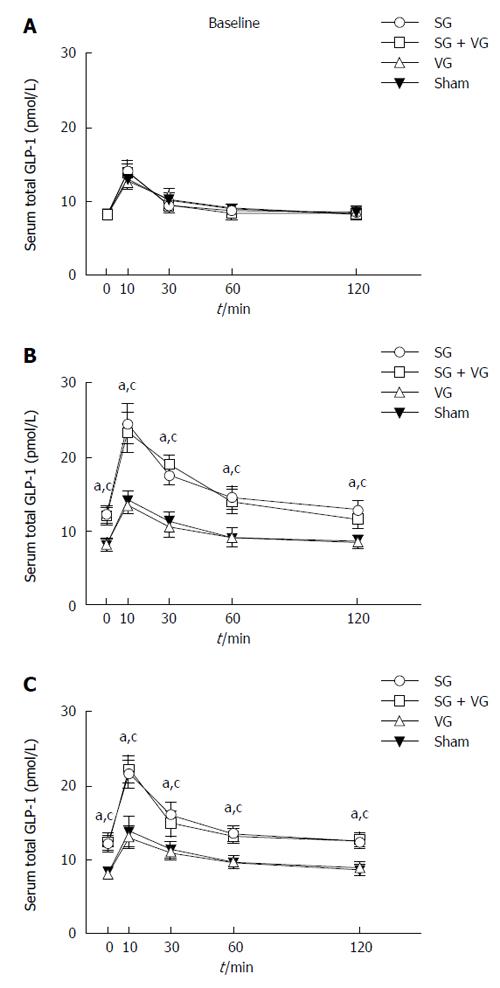
Figure 5 GLP-1 levels after oral glucose gavage.
GLP-1 concentration after oral glucose gavage (1 g/kg) before operations (A) and at 4 (B) and 12 (C) weeks after operations. aP < 0.05 vs TV group; cP < 0.05 vs Sham group. SG: Sleeve gastrectomy; TV: Trunk vagotomy; SGTV: Sleeve gastrectomy plus trunk vagotomy.
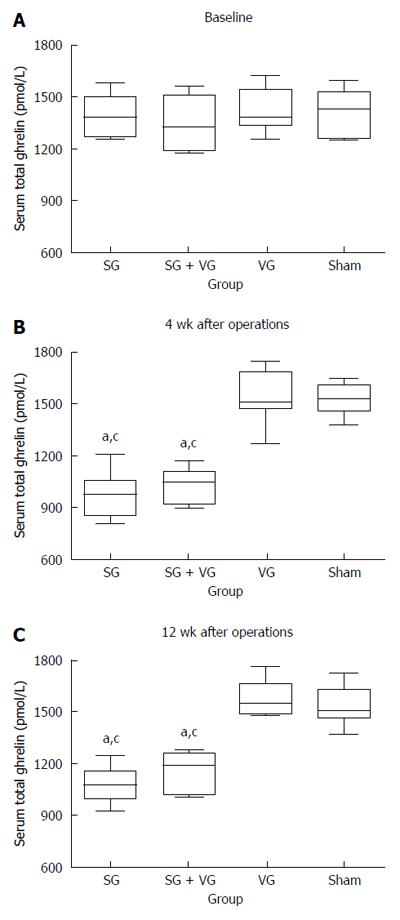
Figure 6 Fasting serum ghrelin.
Fasting serum ghrelin before operations (A) and at 4 (B) and 12 (C) wk after operations. aP < 0.05 vs TV group; cP < 0.05 vs Sham group.
- Citation: Liu T, Zhong MW, Liu Y, Huang X, Cheng YG, Wang KX, Liu SZ, Hu SY. Effects of sleeve gastrectomy plus trunk vagotomy compared with sleeve gastrectomy on glucose metabolism in diabetic rats. World J Gastroenterol 2017; 23(18): 3269-3278
- URL: https://www.wjgnet.com/1007-9327/full/v23/i18/3269.htm
- DOI: https://dx.doi.org/10.3748/wjg.v23.i18.3269


