Copyright
©The Author(s) 2016.
World J Gastroenterol. Nov 14, 2016; 22(42): 9356-9367
Published online Nov 14, 2016. doi: 10.3748/wjg.v22.i42.9356
Published online Nov 14, 2016. doi: 10.3748/wjg.v22.i42.9356
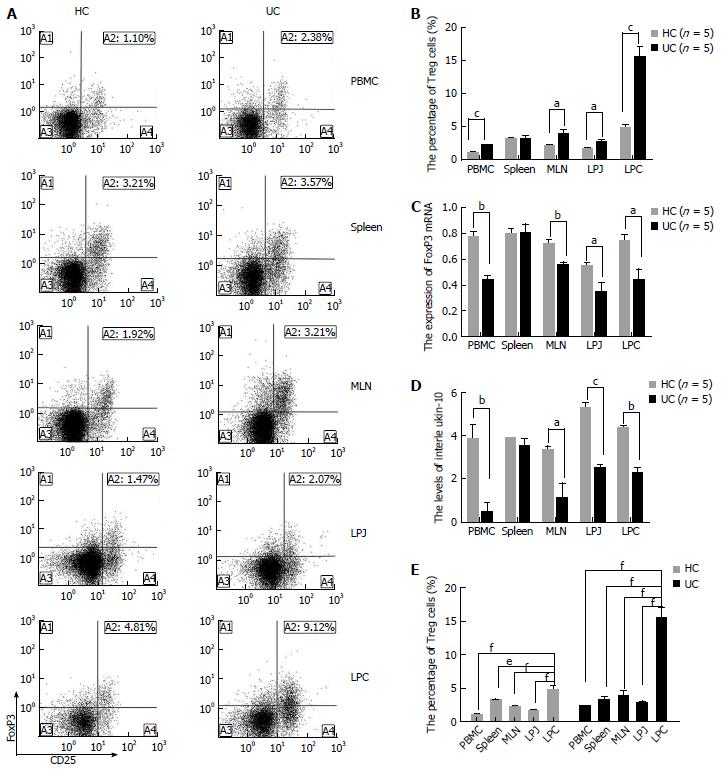
Figure 1 Treg cell features in multiple samples including peripheral blood monocytes, spleen, mesenteric lymph node, lamina propria of jejunum and colon.
A: Representative FACS analysis of Treg cells from HC and UC mice samples gated for CD4+ T cells; B: Treg cell percentages in HC and UC samples; C: Expression of FoxP3 mRNA extracted from Treg cells in HC and UC samples; D: Levels of IL-10 secreted from mononuclear cells from HC and UC peripheral blood monocytes (PBMC), spleen, mesenteric lymph node (MLN), LPJ, and LPC samples; E: Treg cell distribution in HC and UC samples. aP < 0.05 vs control, bP < 0.01 vs control, cP < 0.001 vs control, dP < 0.05 vs LPC, eP < 0.01 vs LPC, fP < 0.001 vs LPC. HC: Healthy control mice; UC: Ulcerative colitis mice; LPJ: Lamina propria of jejunum; LPC: Lamina propria of colon.
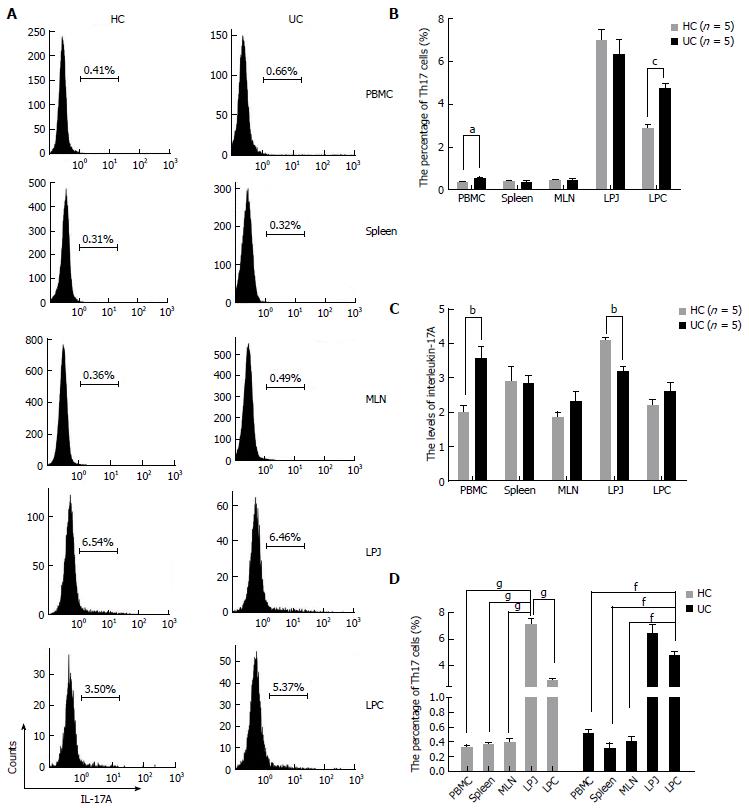
Figure 2 T helper 17 cell characteristics in healthy control mice and ulcerative colitis mice peripheral blood monocytes, spleen, mesenteric lymph node, lamina propria of jejunum and colon samples.
A: FACS analysis of Th17 cells in HC and UC samples gated for CD4+ T cells; B: Percentages of Th17 cells in different HC and UC samples; C: Levels of IL-17A secreted by mononuclear cells extracted from HC and UC peripheral blood monocytes (PBMC), mesenteric lymph node (MLN), LPJ, and LPC samples; D: Treg cell distribution in HC and UC samples. aP < 0.05 vs control, bP < 0.01 vs control, cP < 0.001 vs control, dP < 0.05 vs LPC, eP < 0.01 vs LPC, fP < 0.001 vs LPC, gP < 0.001 vs LPJ. HC: Healthy control mice; UC: Ulcerative colitis mice; LPJ: Lamina propria of jejunum; LPC: Lamina propria of colon.
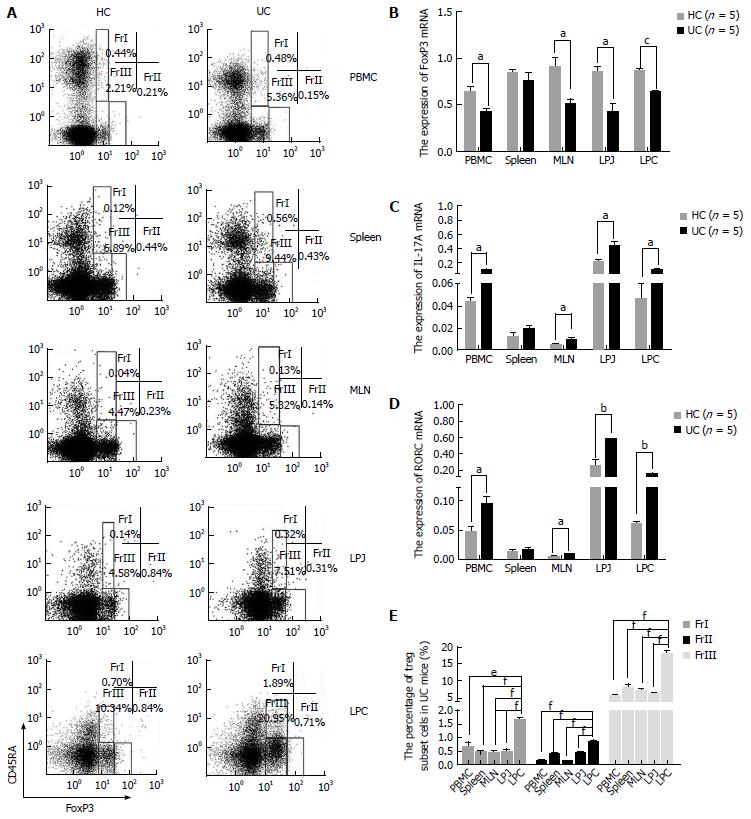
Figure 3 Treg cell subset characteristics in healthy control mice and ulcerative colitis mice peripheral blood monocytes, spleen, mesenteric lymph node, lamina propria of jejunum, and colon samples.
A: FACS analysis of Treg cell subsets in HC and UC samples gated for CD4+ T cells; B: FoxP3 mRNA expression by FrIII cells from different HC and UC samples; C: Expression levels of IL-17A mRNA by FrIII cells in HC and UC samples; D: RORC mRNA expression by FrIII cells from HC and UC samples; E: Treg cell subset distribution in UC samples. aP < 0.05 vs control, bP < 0.01 vs control, cP < 0.001 vs control, dP < 0.05 vs LPC, eP < 0.01 vs LPC, fP < 0.001 vs LPC. PBMC: Peripheral blood monocytes; MLN: Mesenteric lymph node; FrI cells: CD4+CD45RA+FoxP3low; FrII cells: CD4+CD45RA-FoxP3high; FrIII cells: CD4+CD45RA-FoxP3low; HC: Healthy control mice; UC: Ulcerative colitis mice; LPJ: Lamina propria of jejunum; LPC: Lamina propria of colon.
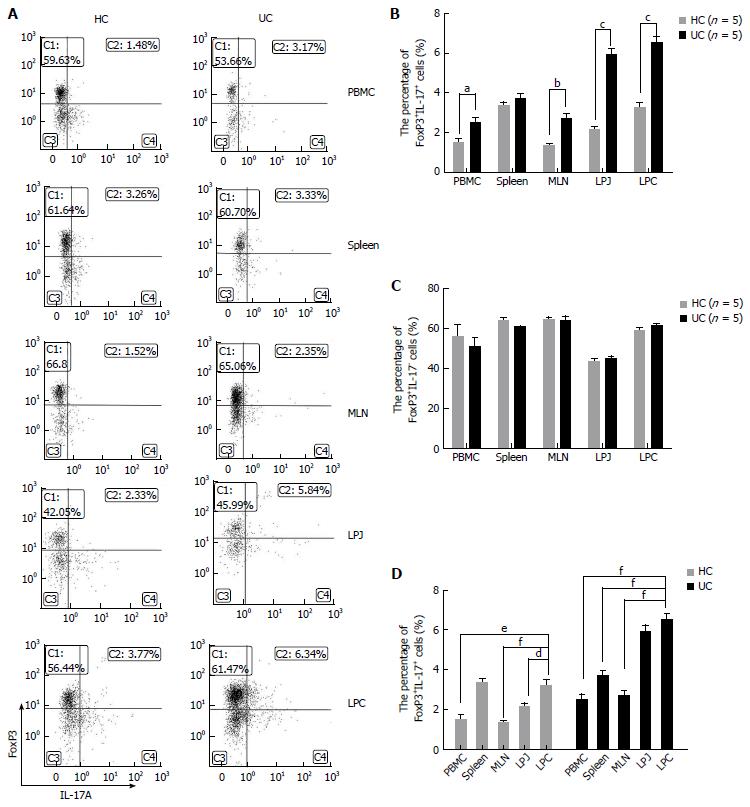
Figure 4 FoxP3+IL17A+ and FoxP3+IL17A- cell characteristics in healthy control mice and ulcerative colitis mice samples of peripheral blood monocytes, spleen, mesenteric lymph node, lamina propria of jejunum, and colon.
A: FACS analysis of FoxP3+IL17A+ and FoxP3+IL17A- cells in HC and UC samples gated for CD4+CD25+ T cells; B: Percentage of FoxP3+IL17A+ cells in HC and UC samples; C: Percentages of FoxP3+IL17A- cells in HC and UC samples; D: FoxP3+IL17A+ cell distribution in different HC and UC samples. aP < 0.05 vs control, bP < 0.01 vs control, cP < 0.001 vs control, dP < 0.05 vs LPC, eP < 0.01 vs LPC, fP < 0.001 vs LPC. PBMC: Peripheral blood monocytes; MLN: Mesenteric lymph node; FrI cells: CD4+CD45RA+FoxP3low; FrII cells: CD4+CD45RA-FoxP3high; FrIII cells: CD4+CD45RA-FoxP3low; HC: Healthy control mice; UC: Ulcerative colitis mice; LPJ: Lamina propria of jejunum; LPC: Lamina propria of colon.
- Citation: Ma YH, Zhang J, Chen X, Xie YF, Pang YH, Liu XJ. Increased CD4+CD45RA-FoxP3low cells alter the balance between Treg and Th17 cells in colitis mice. World J Gastroenterol 2016; 22(42): 9356-9367
- URL: https://www.wjgnet.com/1007-9327/full/v22/i42/9356.htm
- DOI: https://dx.doi.org/10.3748/wjg.v22.i42.9356


