Copyright
©The Author(s) 2016.
World J Gastroenterol. Nov 7, 2016; 22(41): 9141-9153
Published online Nov 7, 2016. doi: 10.3748/wjg.v22.i41.9141
Published online Nov 7, 2016. doi: 10.3748/wjg.v22.i41.9141
Figure 1 Representative immunohistochemical features of HER2, pJNK and pAKT in human gastric cancer specimens.
HER2-positive, pJNK-positive, pAKT-positive and negative control treated without primary antibodies. Original magnification, × 400. Bars: 100 μm.
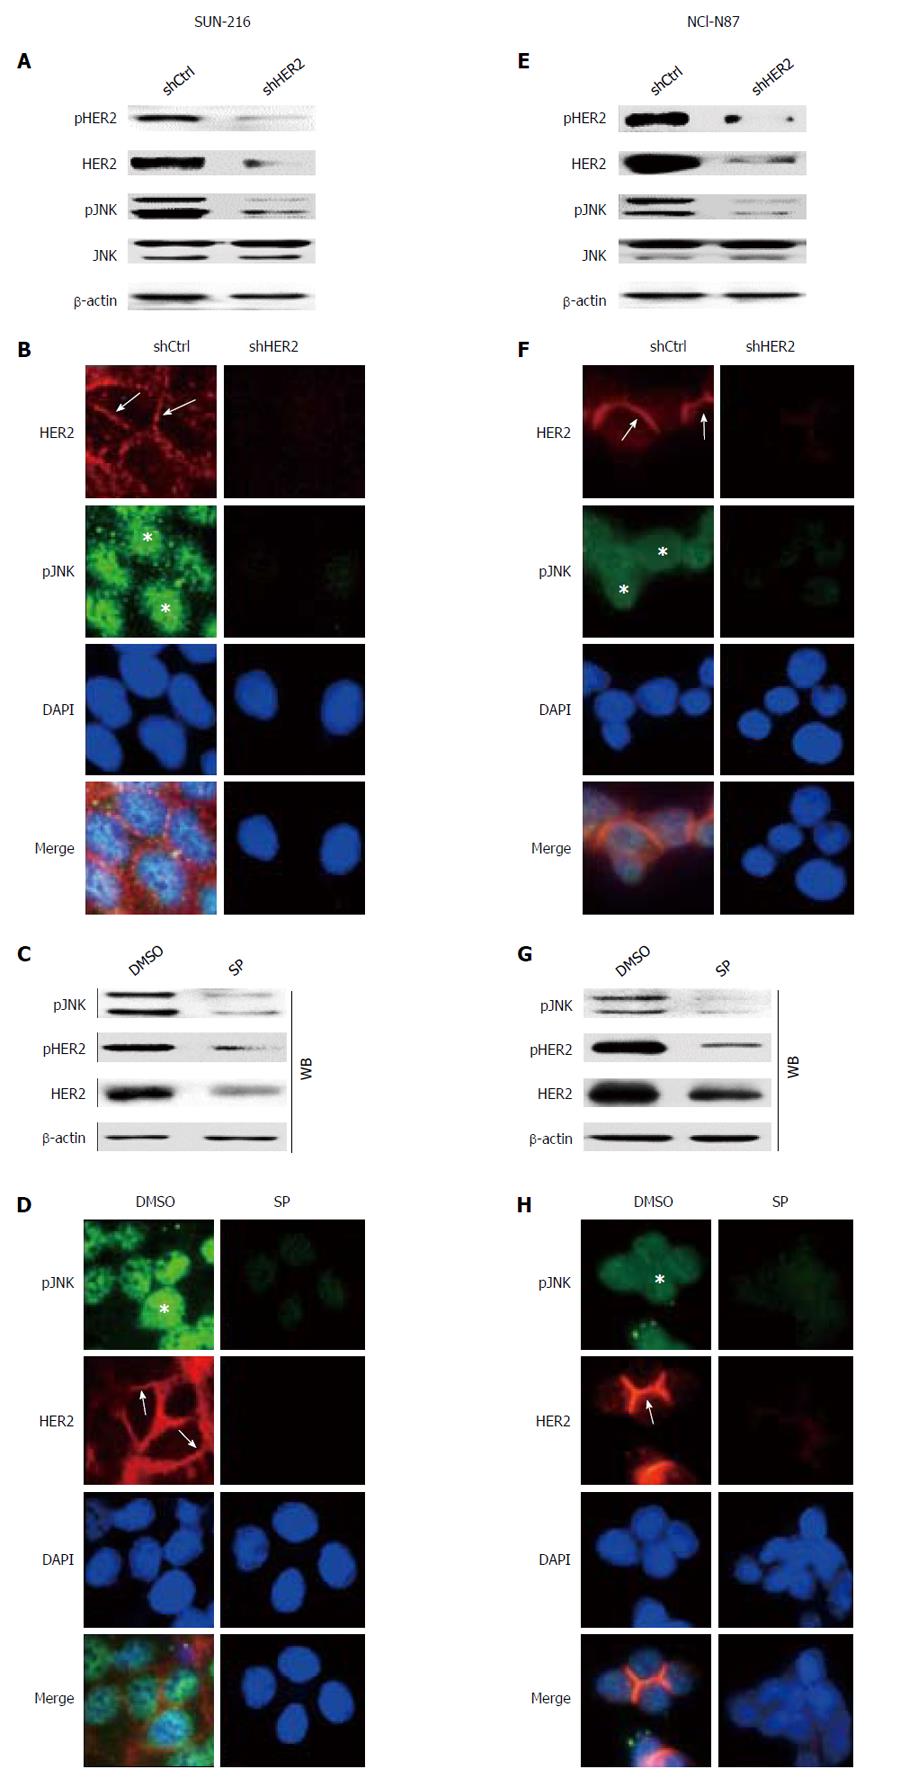
Figure 2 Relationship between HER2 and JNK in SNU-216 and NCI-N87 cells.
A, B, E and F: Cancer cells were infected with a lentivirus containing either control shRNA (shCtrl) or HER2 shRNA (shHER2); A, E: Protein expressions of pHER2, HER2, pJNK and JNK were determined by Western blot; B, F: Double immunofluorescence staining for HER2 (red, arrows) and pJNK (green, asterisks) was performed. Cell nuclei were visualized by DAPI staining (blue). Original magnification, × 400; C, D, G, H: Cells were treated with either DMSO (vehicle control) or SP600125 (SP); C, G: Protein expressions of pJNK, pHER2 and HER2 were determined by Western blot (WB) and HER2 mRNA expression was determined by semi-quantitative reverse transcription-polymerase chain reaction (RT-PCR); D, H: Double immunofluorescence staining for pJNK (green, asterisks) and HER2 (red, arrows) was performed. Cell nuclei were visualized by DAPI staining (blue). Original magnification, × 400.
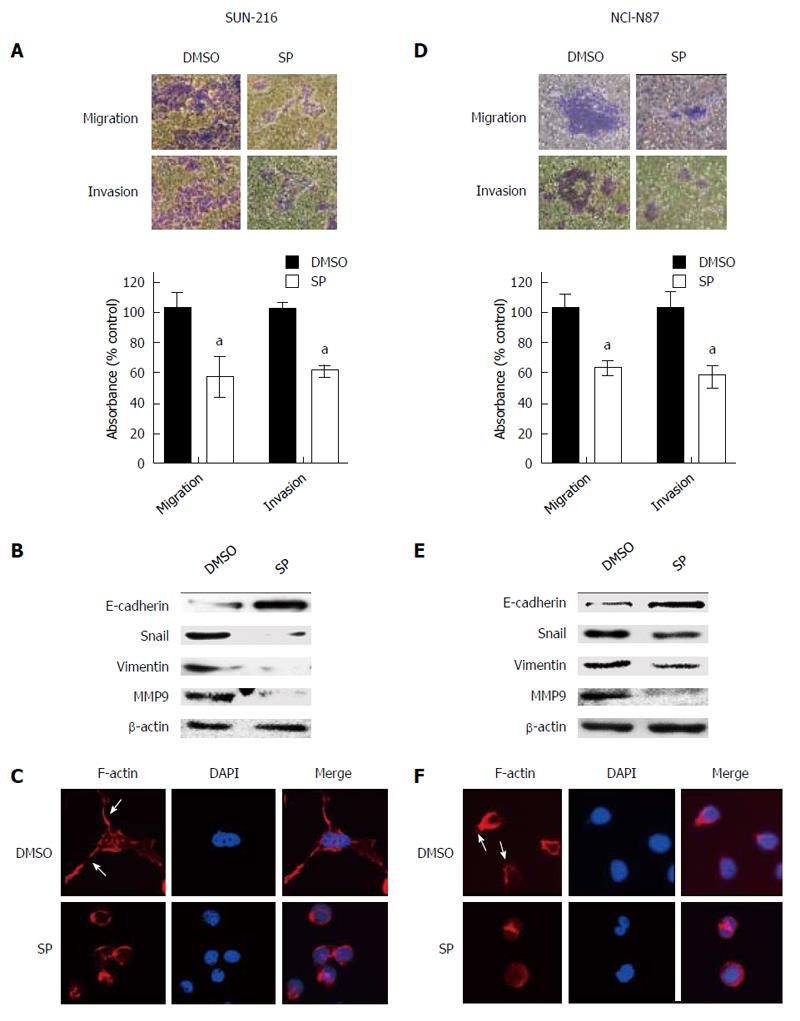
Figure 3 Effect of pharmacological inhibition of JNK on cell migration, invasion, EMT marker expressions and actin cytoskeleton organization.
SNU-216 and NCI-N87 cells were treated with either DMSO or SP600125 (SP). A, D: Cell migration and invasion were analyzed by Transwell assay followed by cell viability assessment using the crystal violet assay. Representative images of migrated/invasive cells taken 48 h after plating into a transwell insert are on the upper, and the quantification of migrated/invasive cells is on the lower. Results were calculated as percentages relative to DMSO vehicle control. Data are expressed as mean ± SD (n = 4 per each group). aP < 0.05 vs DMSO vehicle control; B, E: EMT marker expressions were determined by Western blot; C, F: The organization of the actin cytoskeleton was determined by immunofluorescence staining. Alexa Fluor 633-conjugated phalloidin was used to visualize F-actin (red), and DAPI staining (blue) was used for visualization of cell nuclei. Arrows indicate the FITC-labelled filopodia-like projections. Photographs were taken with a fluorescence microscope. Original magnification, × 400.
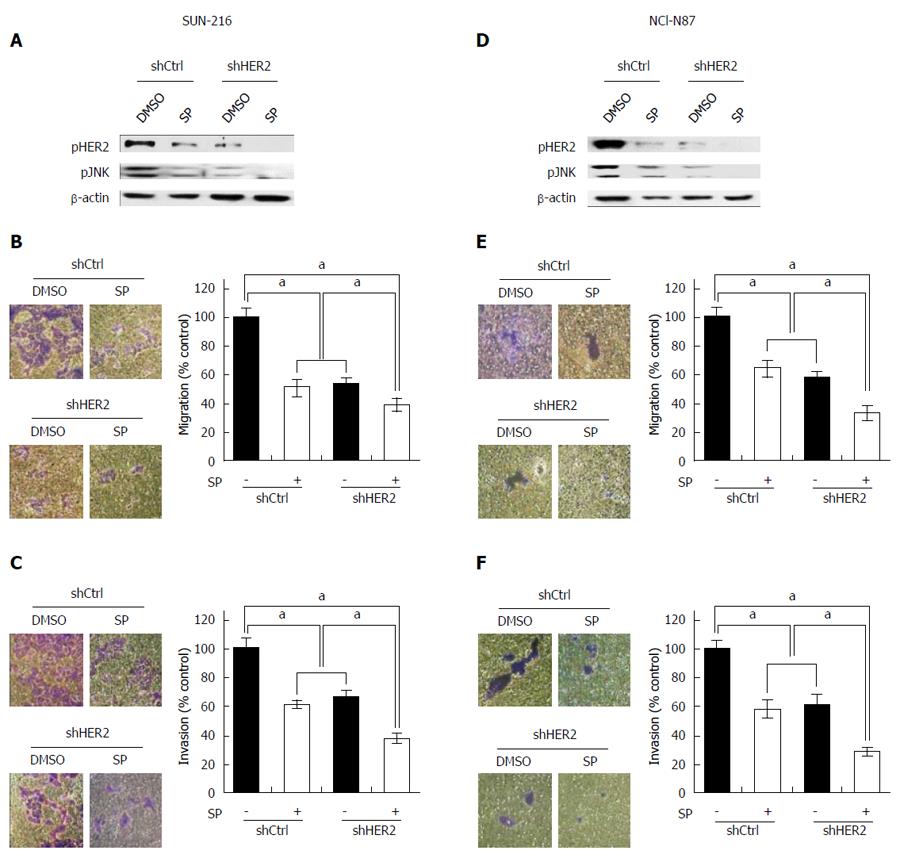
Figure 4 Combined effects of HER2 silencing and JNK inhibition on metastatic potential.
SNU-216 and NCI-N87 cells were infected with a lentivirus containing either control shRNA (shCtrl) or HER2 shRNA (shHER2) followed by treatment with either DMSO or SP600125 (SP). A, D: After treatment with SP for 24 h, protein expressions of pHER2 and pJNK were determined by Western blot; B, E: After treatment with SP for 48 h, cell migration was evaluated by Transwell migration assay; C, F: After treatment with SP for 48 h, invasion was evaluated by cell invasion assay. Results were calculated as percentages relative to control cells. Data are expressed as mean ± SD (n = 4 per each group). aP < 0.05 vs control cells.
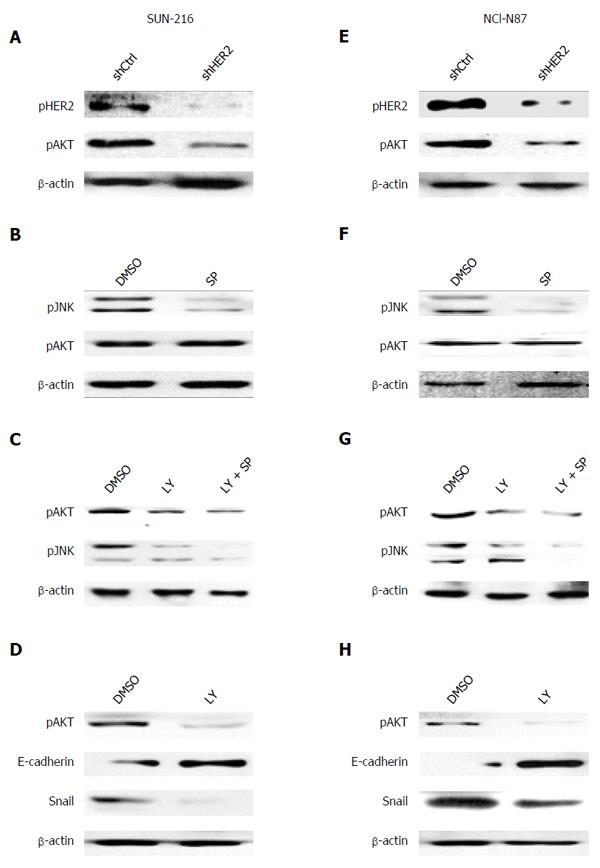
Figure 5 Association between AKT and JNK as well as EMT marker expressions in SNU-216 and NCI-N87 cells.
Western blot was performed to determine protein expressions of pHER2, pAKT, E-cadherin, Snail and pJNK. A, E: Cells were infected with a lentivirus containing either control shRNA (shCtrl) or HER2 shRNA (shHER2); B, F: Cells were treated with either DMSO or SP600125 (SP); C, G: Cells were treated with LY with or without SP; D, H: Cells were treated with either DMSO or LY294002 (LY).
Figure 6 Synergistic effect of JNK and AKT on metastatic potential of HER2-positive gastric cancer cells.
Combined effects of AKT and JNK on the metastatic potential of SNU-216 and NCI-N87 were determined by Transwell migration assay. A, B: Cells were treated with DMSO or SP600125 (SP) in the presence or absence of LY294002 (LY). Results were calculated as percentages relative to DMSO vehicle control. Data are expressed as mean ± SD (n = 4 per each group). aP < 0.05 vs DMSO vehicle control.
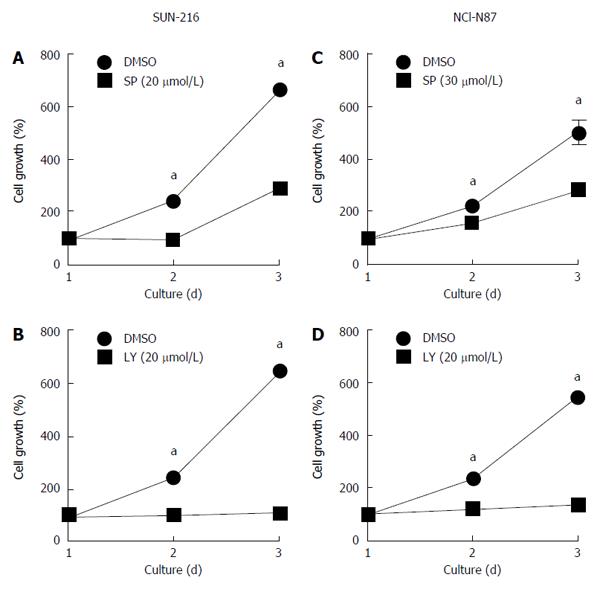
Figure 7 Effect of JNK or AKT on cell growth of human epidermal growth factor receptor 2-positive gastric cancer cell lines.
A, C: GC cell lines were treated with either DMSO or SP600125 (SP); B, D: Cells were treated with either DMSO or LY294002 (LY). Cell growth rates were analyzed using crystal violet assay on the indicated times, and absorbance was measured. Results were calculated as percentages relative to DMSO vehicle control. Data are expressed as mean ± SD (n = 4 per each group). aP < 0.05 vs DMSO vehicle control.
- Citation: Choi Y, Ko YS, Park J, Choi Y, Kim Y, Pyo JS, Jang BG, Hwang DH, Kim WH, Lee BL. HER2-induced metastasis is mediated by AKT/JNK/EMT signaling pathway in gastric cancer. World J Gastroenterol 2016; 22(41): 9141-9153
- URL: https://www.wjgnet.com/1007-9327/full/v22/i41/9141.htm
- DOI: https://dx.doi.org/10.3748/wjg.v22.i41.9141


