Copyright
©The Author(s) 2016.
World J Gastroenterol. May 21, 2016; 22(19): 4766-4775
Published online May 21, 2016. doi: 10.3748/wjg.v22.i19.4766
Published online May 21, 2016. doi: 10.3748/wjg.v22.i19.4766
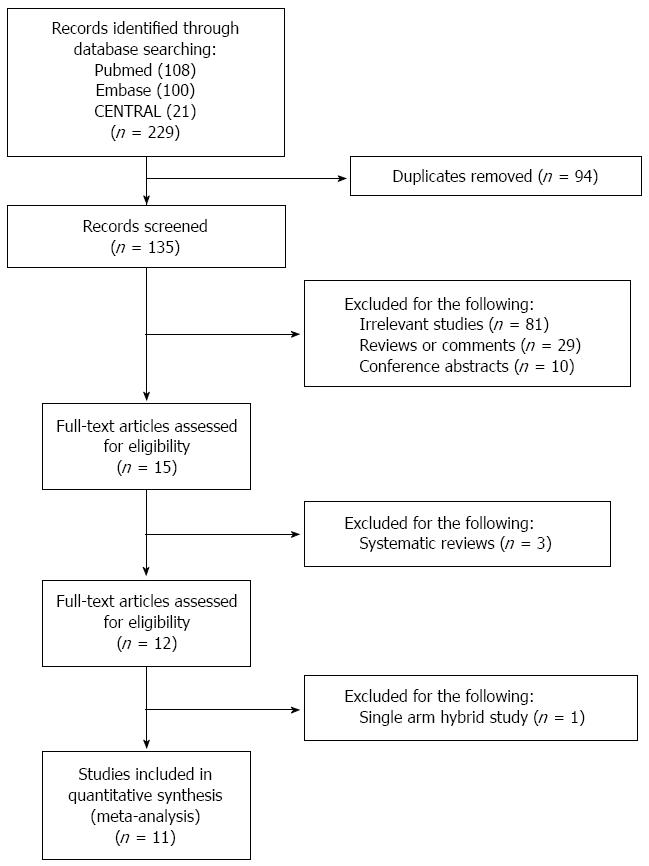
Figure 1 Study selection process of the meta-analysis.
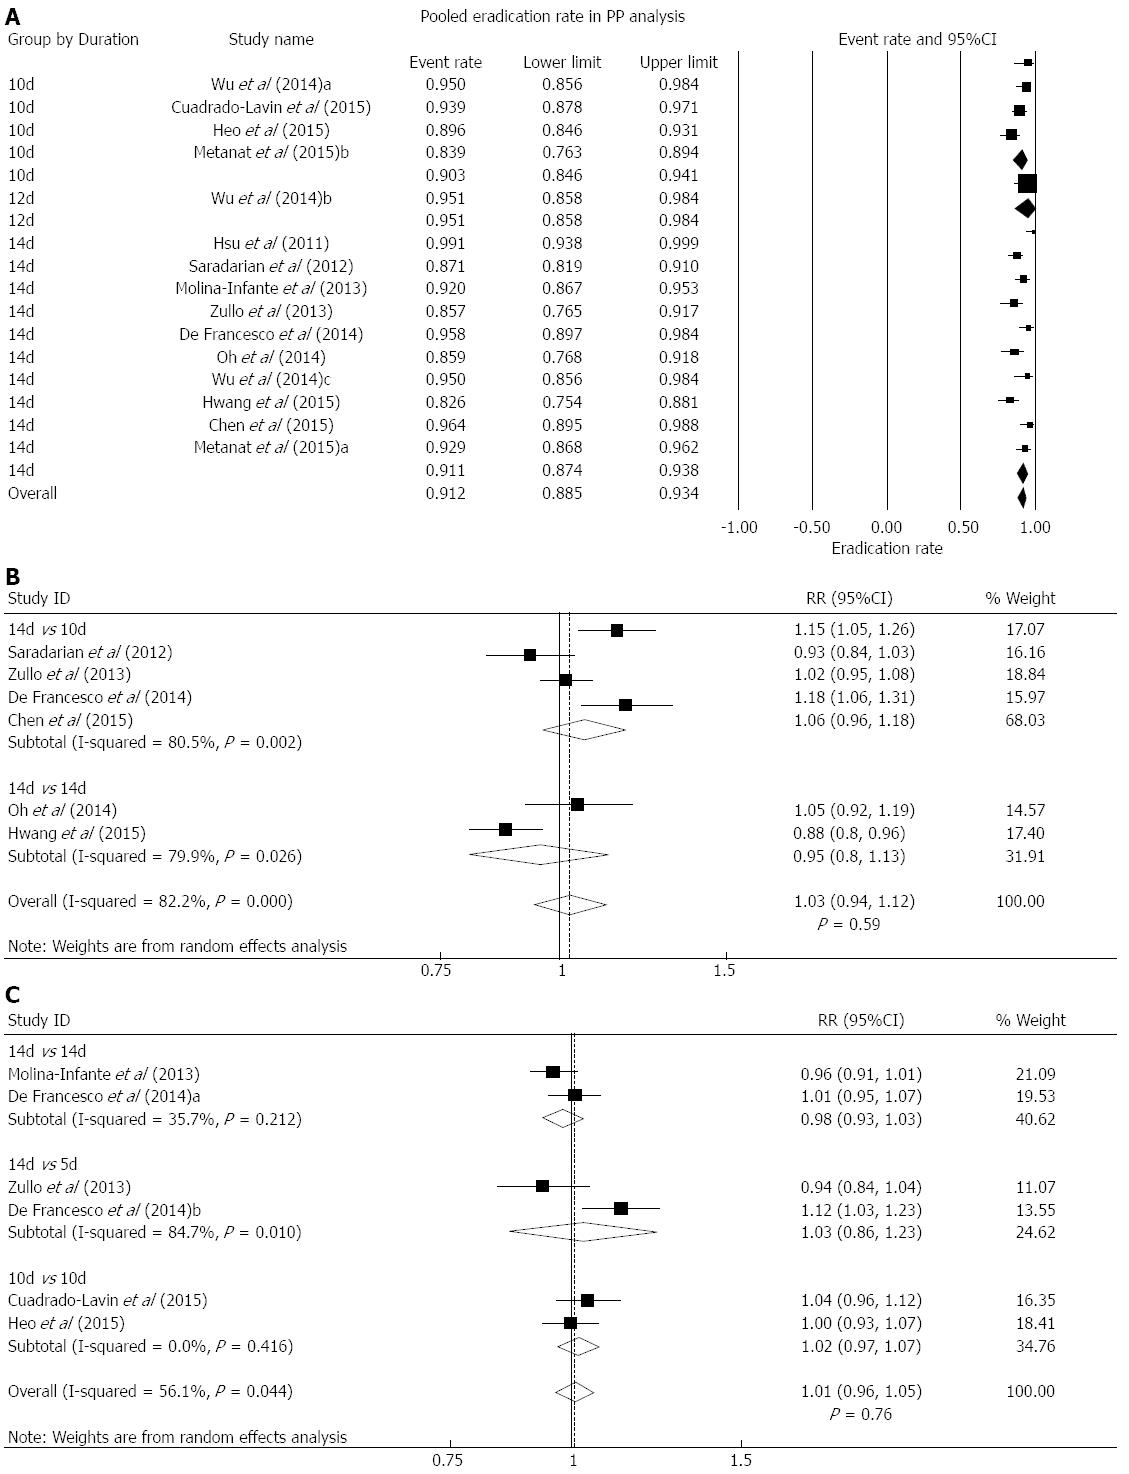
Figure 2 Per-protocol analysis.
Forest plot showing the overall eradication rate of Helicobacter pylori (H. pylori) using hybrid therapy based on data from PP analysis. Subgroup analyses were conducted based on different durations of hybrid regimen. B: Forest plot comparing hybrid with sequential therapy in H. pylori eradication using data from PP analysis. Subgroup analyses were conducted based on different durations of sequential regimen. C: Forest plot comparing hybrid with concomitant therapy in H. pylori eradication using the data from PP analysis. Subgroup analyses were conducted based on different durations of concomitant regimen.
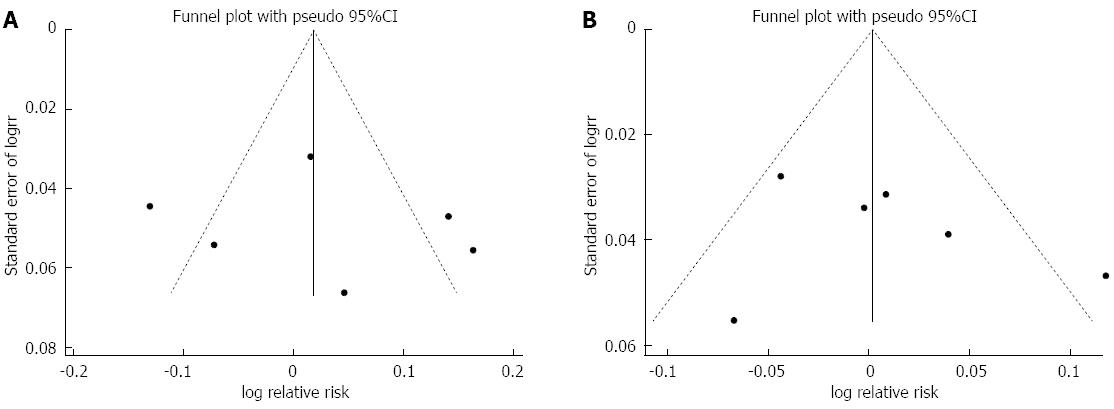
Figure 3 Publication bias.
A: Funnel plot of studies comparing hybrid with sequential therapy; B: Funnel plot of studies comparing hybrid with concomitant therapy.
- Citation: Song ZQ, Zhou LY. Hybrid, sequential and concomitant therapies for Helicobacter pylori eradication: A systematic review and meta-analysis. World J Gastroenterol 2016; 22(19): 4766-4775
- URL: https://www.wjgnet.com/1007-9327/full/v22/i19/4766.htm
- DOI: https://dx.doi.org/10.3748/wjg.v22.i19.4766


