©The Author(s) 2016.
World J Gastroenterol. Mar 21, 2016; 22(11): 3212-3219
Published online Mar 21, 2016. doi: 10.3748/wjg.v22.i11.3212
Published online Mar 21, 2016. doi: 10.3748/wjg.v22.i11.3212
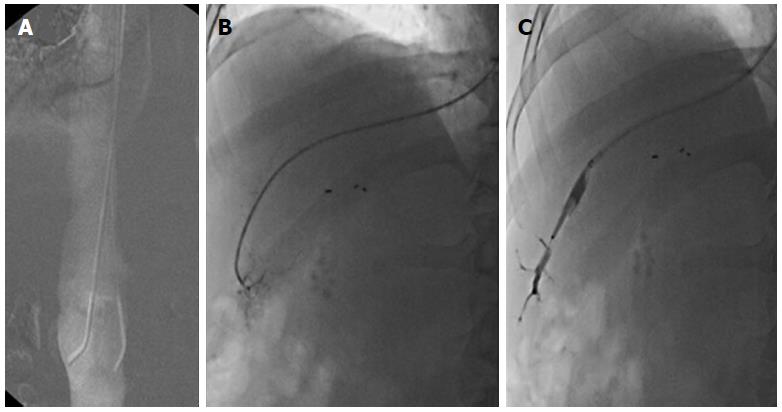
Figure 1 Inferior vena cava pressure, end-hole catheter method, balloon catheter method.
Fluoroscopic images of pressure measurements. A: The infrarenal inferior vena cava (IVC) pressure is assessed at the level of the renal vein; B: Measurement of wedged hepatic venous pressure with the end-hole catheter; C: Measurement of wedged hepatic venous pressure with the balloon catheter. In the measurement of the wedged hepatic venous pressure, adequate hepatic vein occlusion is confirmed by dye injection in both methods.
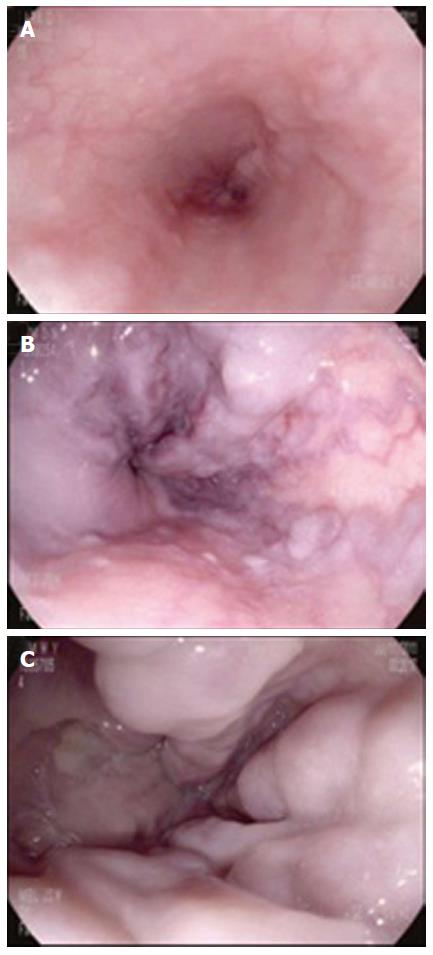
Figure 2 Endoscopic grading of the esophageal varices based on the general rules for recording endoscopic findings of esophagogastric varices.
A: F1, Small and straight; B: F2, Enlarged and tortuous; C: F3: Large and coil shaped.
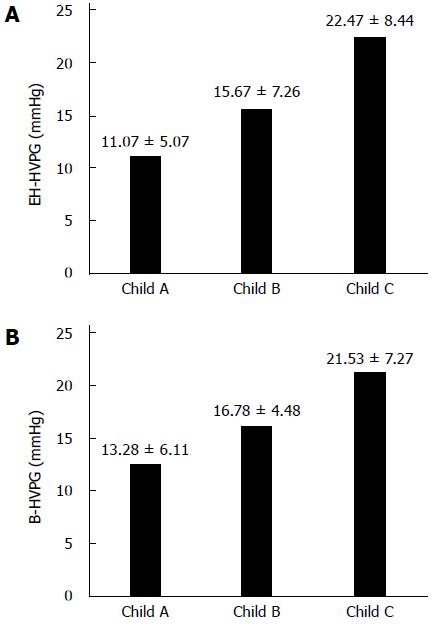
Figure 3 Association between mean hepatic venous pressure gradient values and Child’s status.
A: End-hole catheter method, P < 0.000; B: Balloon catheter method, P < 0.000.
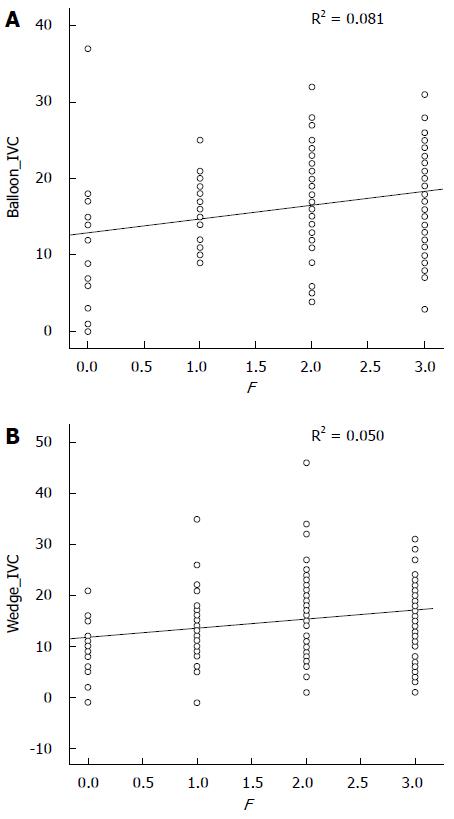
Figure 4 Correlation between hepatic venous pressure gradient and endoscopic grading of esophageal varices.
A: Hepatic venous pressure gradient (HVPG) measured with balloon catheter method (B-HVPG); B: HVPG measured with end-hole catheter method (EH-HVPG). Both EH-HVPG and B-HVPG had a good correlation with the endoscopic grading of esophageal varices. B-HVPG had a stronger positive correlation with the endoscopic esophageal varices grade than EH-HVPG (B-HVPG, r = 0.081, P = 0.002; EH-HVPG, r = 0.050, P = 0.004).
- Citation: Lee E, Kim YJ, Goo DE, Yang SB, Kim HJ, Jang JY, Jeong SW. Comparison of hepatic venous pressure gradient and endoscopic grading of esophageal varices. World J Gastroenterol 2016; 22(11): 3212-3219
- URL: https://www.wjgnet.com/1007-9327/full/v22/i11/3212.htm
- DOI: https://dx.doi.org/10.3748/wjg.v22.i11.3212


