©The Author(s) 2016.
World J Gastroenterol. Mar 21, 2016; 22(11): 3175-3185
Published online Mar 21, 2016. doi: 10.3748/wjg.v22.i11.3175
Published online Mar 21, 2016. doi: 10.3748/wjg.v22.i11.3175
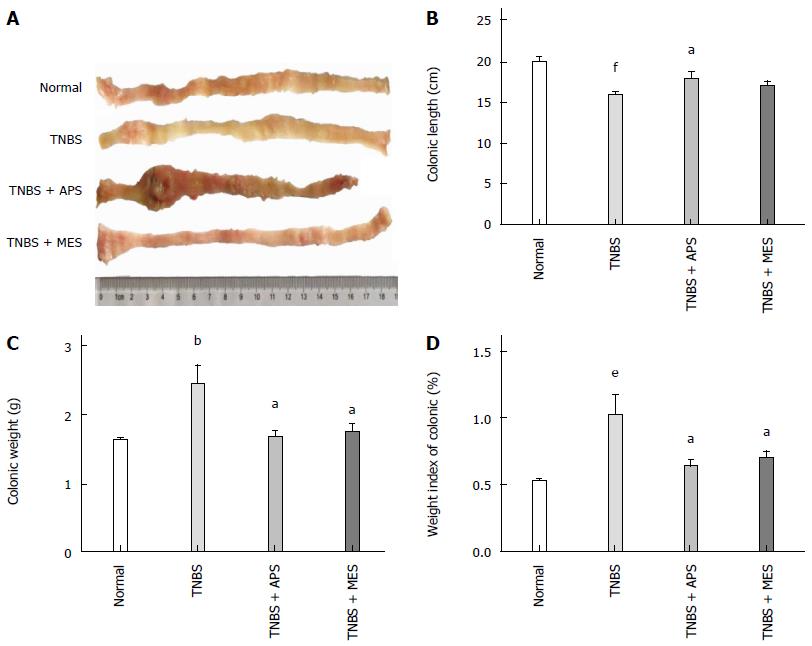
Figure 1 Representative images of colons and colonic character assay.
A: Representative images of colons; B: Colonic length; C: Colonic weight; D: Weight index of the colon. Data are mean ± SEM (n = 8). bP < 0.01, eP < 0.001, fP < 0.0001 vs normal group; aP < 0.05 vs TNBS group. TNBS: 2,4,6-trinitrobenzene sulfonic acid; APS: Astragalus polysaccharide; MES: Mesalazine.
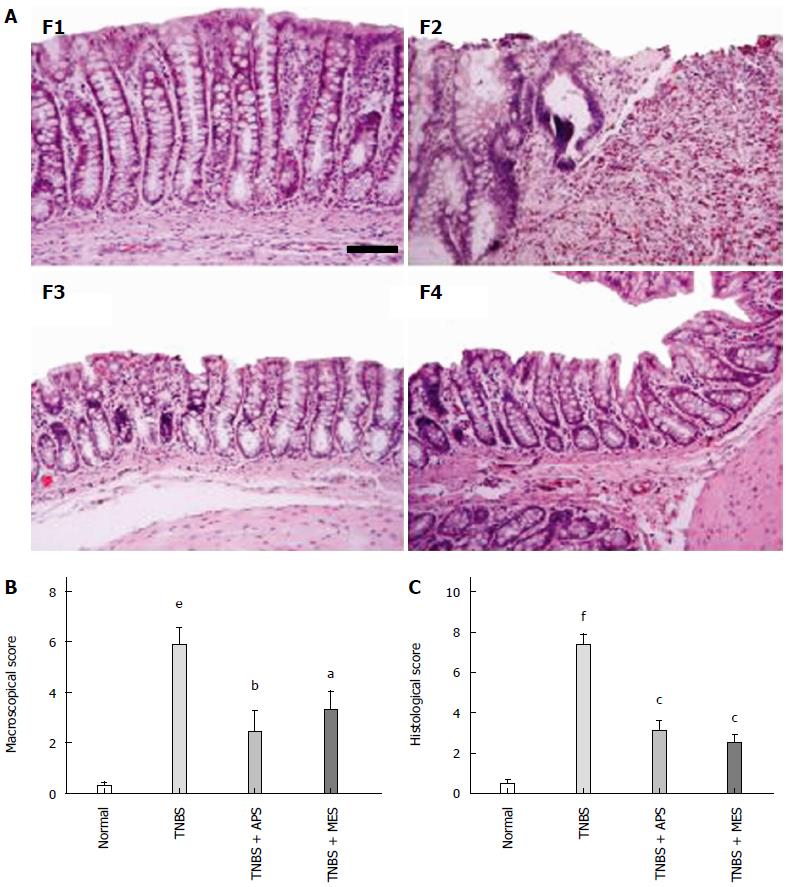
Figure 2 Representative histological images and injury scores.
A: Representative histological images stained with HE. F1: Normal; F2: TNBS; F3: TNBS + APS; F4: TNBS + MES. Bar = 100 μm. B: Macroscopic scores. C: Histological scores. Data are mean ± SEM (n = 8). eP < 0.001, fP < 0.0001 vs Normal group; aP < 0.05, bP < 0.01, cP < 0.0001 vs TNBS group. TNBS: 2,4,6-trinitrobenzene sulfonic acid; APS: Astragalus polysaccharide; MES: Mesalazine.
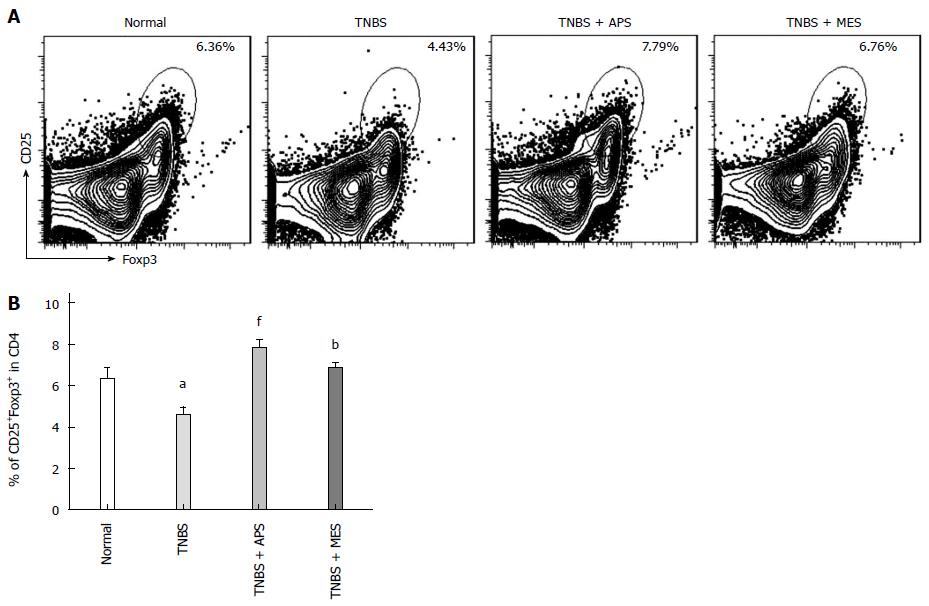
Figure 3 Assay of Treg cells.
A: Representative flow plots of CD4+CD25+Foxp3+ T cells. Histograms show the distribution of immunofluorescence labeling intensity of CD4, CD25 and Foxp3 expression in each group. Ordinate indicates cell counts; abscissa represents fluorescent intensity. B: Levels of CD4+CD25+Foxp3+ T cells. Data are mean ± SEM (n = 8). aP < 0.05 vs normal group; bP < 0.01, fP < 0.0001 vs TNBS group. TNBS: 2,4,6-trinitrobenzene sulfonic acid; APS: Astragalus polysaccharide; MES: Mesalazine.
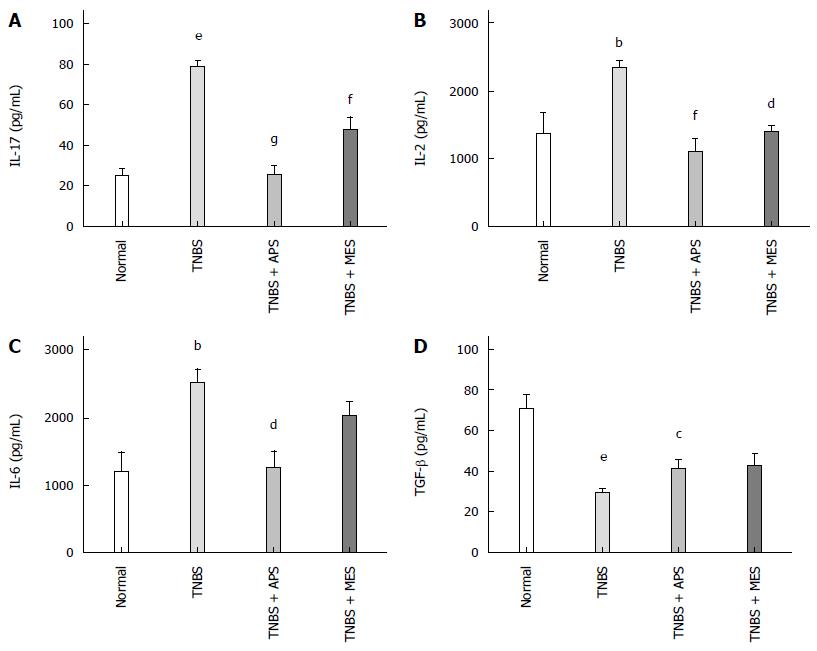
Figure 4 Concentrations of cytokines in the colonic mucosa.
A: Concentrations of IL-17 in the colonic mucosa from different groups; B: Concentrations of IL-2 in the colonic mucosa from different groups; C: Concentrations of IL-6 in the colonic mucosa from different groups; D: Concentrations of TGF-β in the colonic mucosa from different groups. Data are mean ± SEM (n = 8). aP < 0.05, bP < 0.01, eP < 0.0001 vs normal group; cP < 0.05, dP < 0.01, fP < 0.001, gP < 0.0001 vs TNBS group. TNBS: 2,4,6-trinitrobenzene sulfonic acid; APS: Astragalus polysaccharide; MES: Mesalazine.
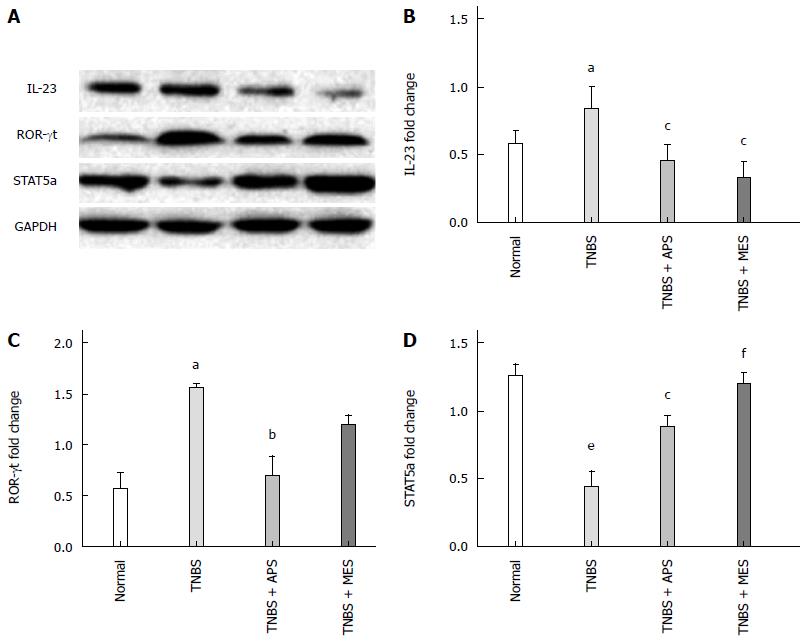
Figure 5 Western blot analysis of IL-23, ROR-γt and STAT-5a expression.
A: Representative Western blots of IL-23, ROR-γt, STAT-5 and GAPDH (n = 6); B: Quantitative analysis of ROR-γt protein (n = 6); C: Quantitative analysis of IL-23 protein (n = 6); D: Quantitative analysis of STAT-5a protein (n = 6). Data are mean ± SEM (n = 8). aP < 0.05, eP <0.000 vs normal group; cP < 0.05, bP < 0.01, fP < 0.001 vs TNBS group. TNBS: 2,4,6-trinitrobenzene sulfonic acid; APS: Astragalus polysaccharide; MES: Mesalazine.
- Citation: Zhao HM, Wang Y, Huang XY, Huang MF, Xu R, Yue HY, Zhou BG, Huang HY, Sun QM, Liu DY. Astragalus polysaccharide attenuates rat experimental colitis by inducing regulatory T cells in intestinal Peyer’s patches. World J Gastroenterol 2016; 22(11): 3175-3185
- URL: https://www.wjgnet.com/1007-9327/full/v22/i11/3175.htm
- DOI: https://dx.doi.org/10.3748/wjg.v22.i11.3175


