Copyright
©The Author(s) 2015.
World J Gastroenterol. Jul 28, 2015; 21(28): 8711-8722
Published online Jul 28, 2015. doi: 10.3748/wjg.v21.i28.8711
Published online Jul 28, 2015. doi: 10.3748/wjg.v21.i28.8711
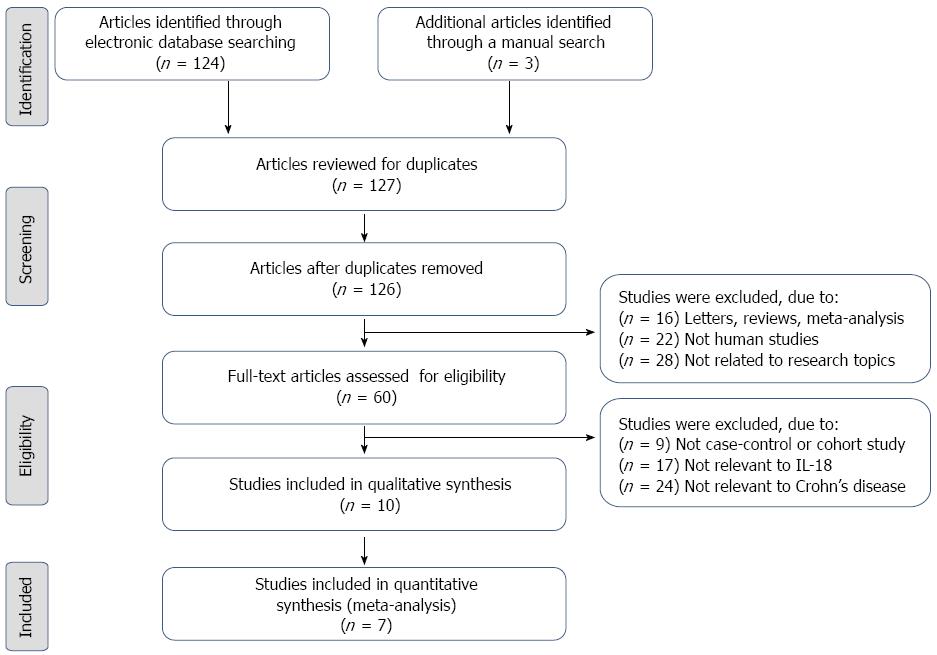
Figure 1 Flow chart of the literature search and study selection.
Seven case-control studies were included in this meta-analysis.
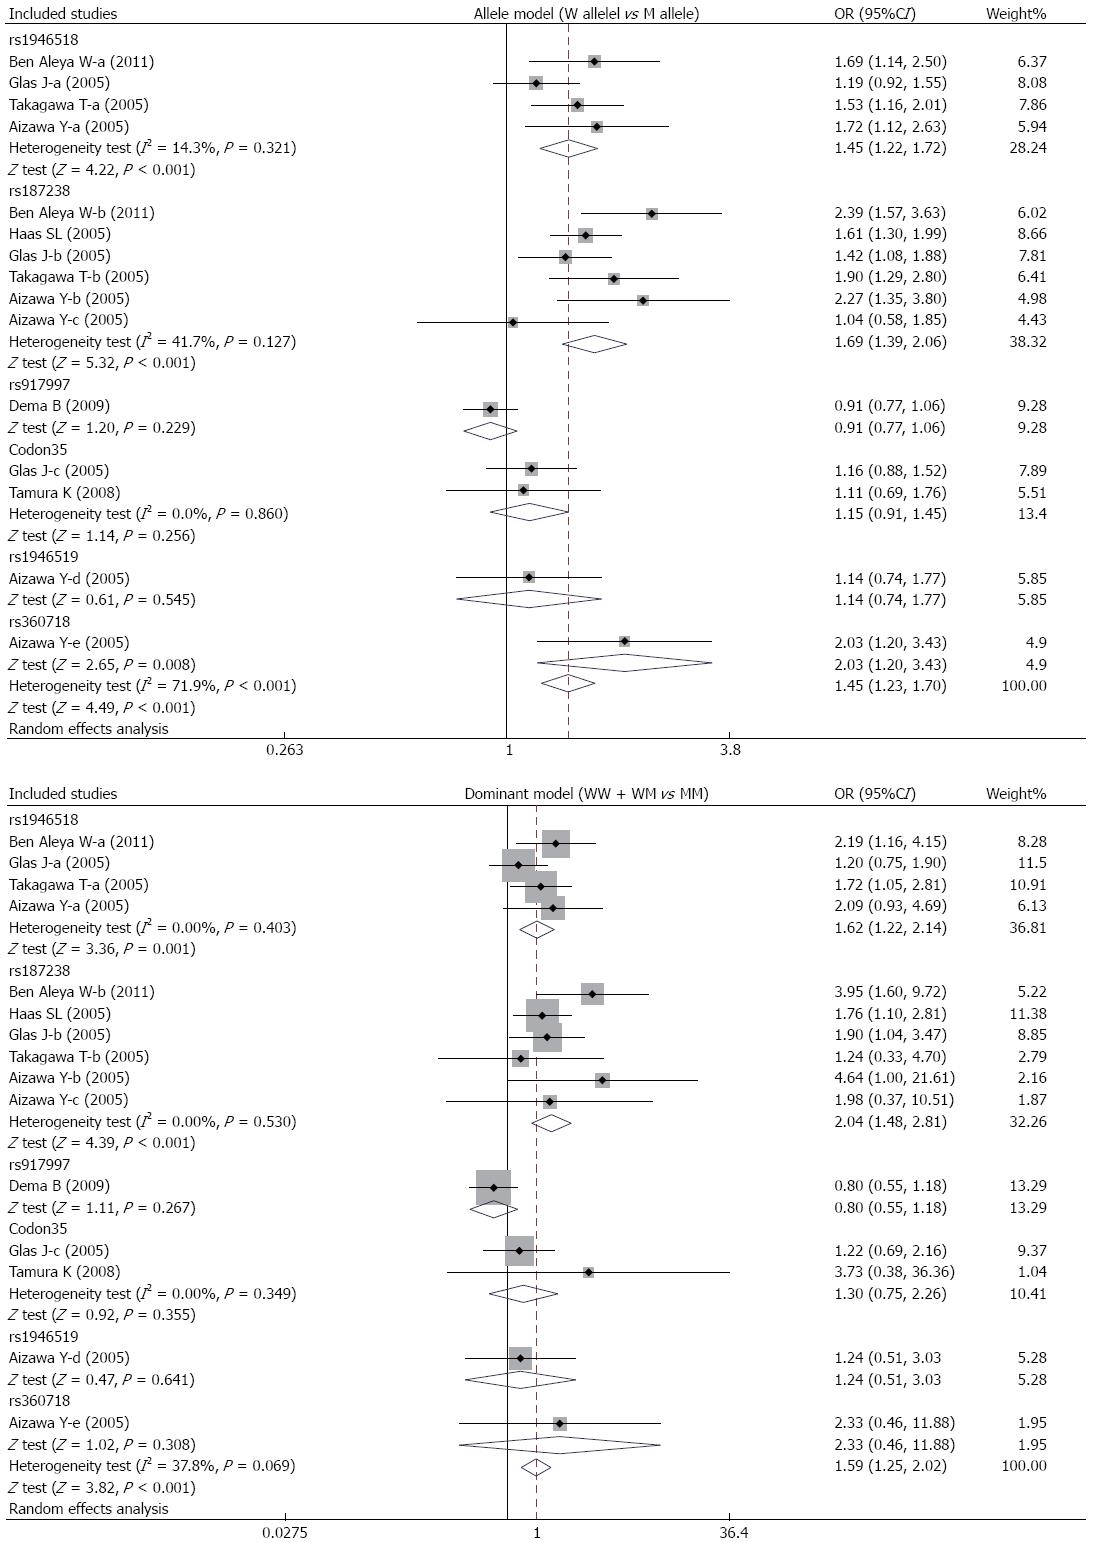
Figure 2 Forest plots of the relationships between interleukin-18 genetic polymorphisms and the risk of developing Crohn’s disease, using the allele and dominant models.
Figure 3 Subgroup analyses of the relationships between interleukin-18 genetic polymorphisms and the risk of developing Crohn’s disease, using the allele and dominant models.
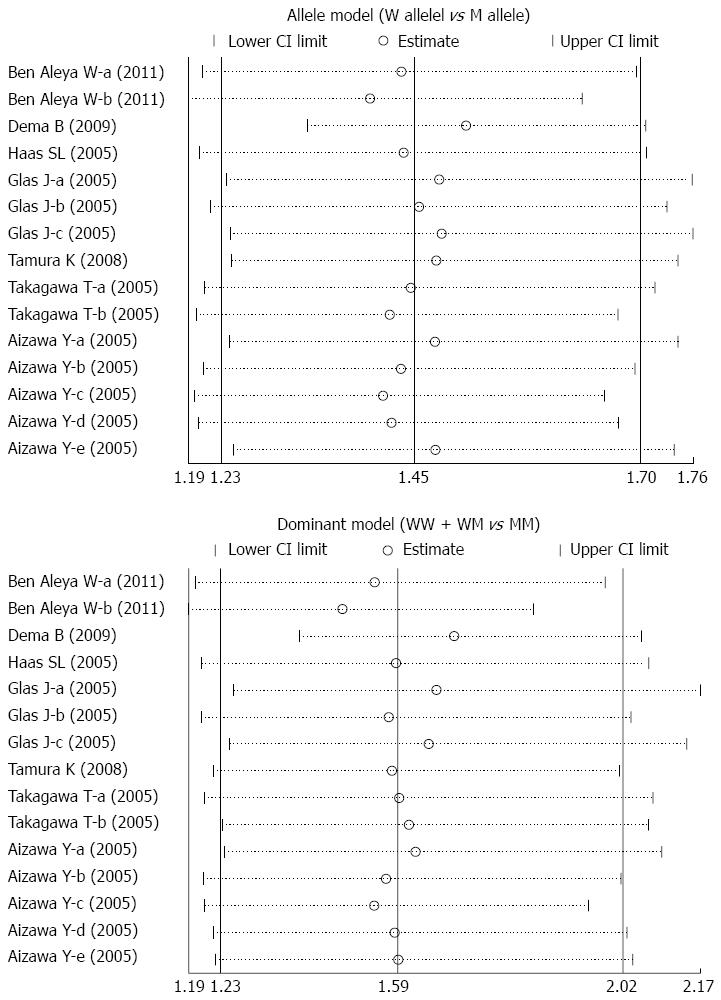
Figure 4 Sensitivity analysis of the summary odds ratio coefficients for the relationships between interleukin-18 genetic polymorphisms and the risk of developing Crohn’s disease, using the allele and dominant models.
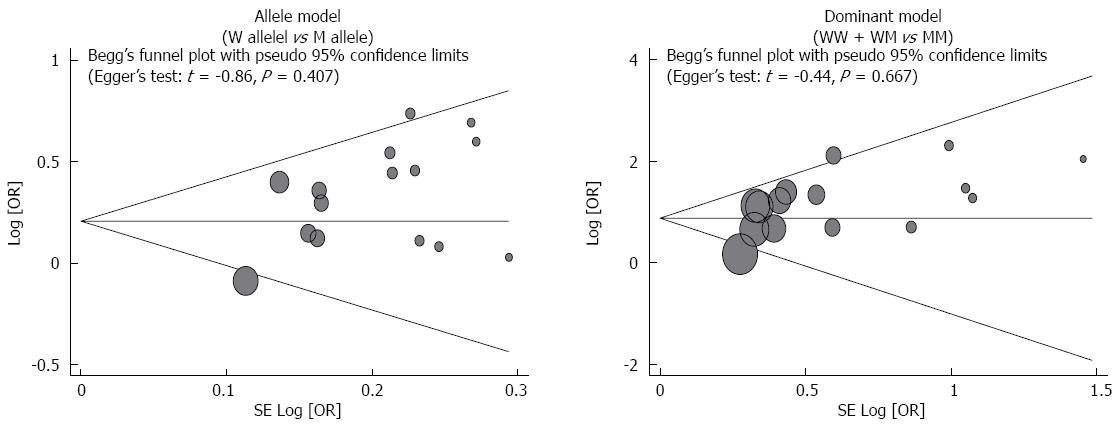
Figure 5 Funnel plot of publication biases of the relationships between interleukin-18 genetic polymorphisms and the risk of Crohn’s disease under the allele and dominant models.
W: Wild-type allele; M: Mutant allele; WW: Wild-type homozygote; WM: Heterozygote; MM: Mutant homozygote; OR: Odds ratio.
- Citation: Gao SJ, Zhang L, Lu W, Wang L, Chen L, Zhu Z, Zhu HH. Interleukin-18 genetic polymorphisms contribute differentially to the susceptibility to Crohn’s disease. World J Gastroenterol 2015; 21(28): 8711-8722
- URL: https://www.wjgnet.com/1007-9327/full/v21/i28/8711.htm
- DOI: https://dx.doi.org/10.3748/wjg.v21.i28.8711


