Copyright
©The Author(s) 2015.
World J Gastroenterol. Jul 28, 2015; 21(28): 8697-8710
Published online Jul 28, 2015. doi: 10.3748/wjg.v21.i28.8697
Published online Jul 28, 2015. doi: 10.3748/wjg.v21.i28.8697
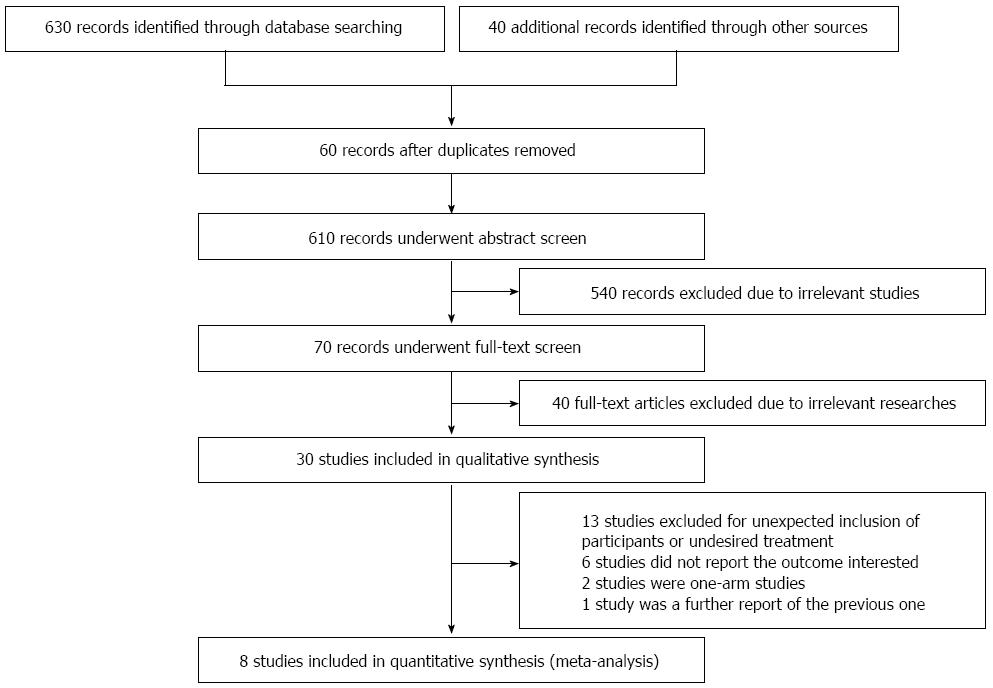
Figure 1 Study flow diagram.
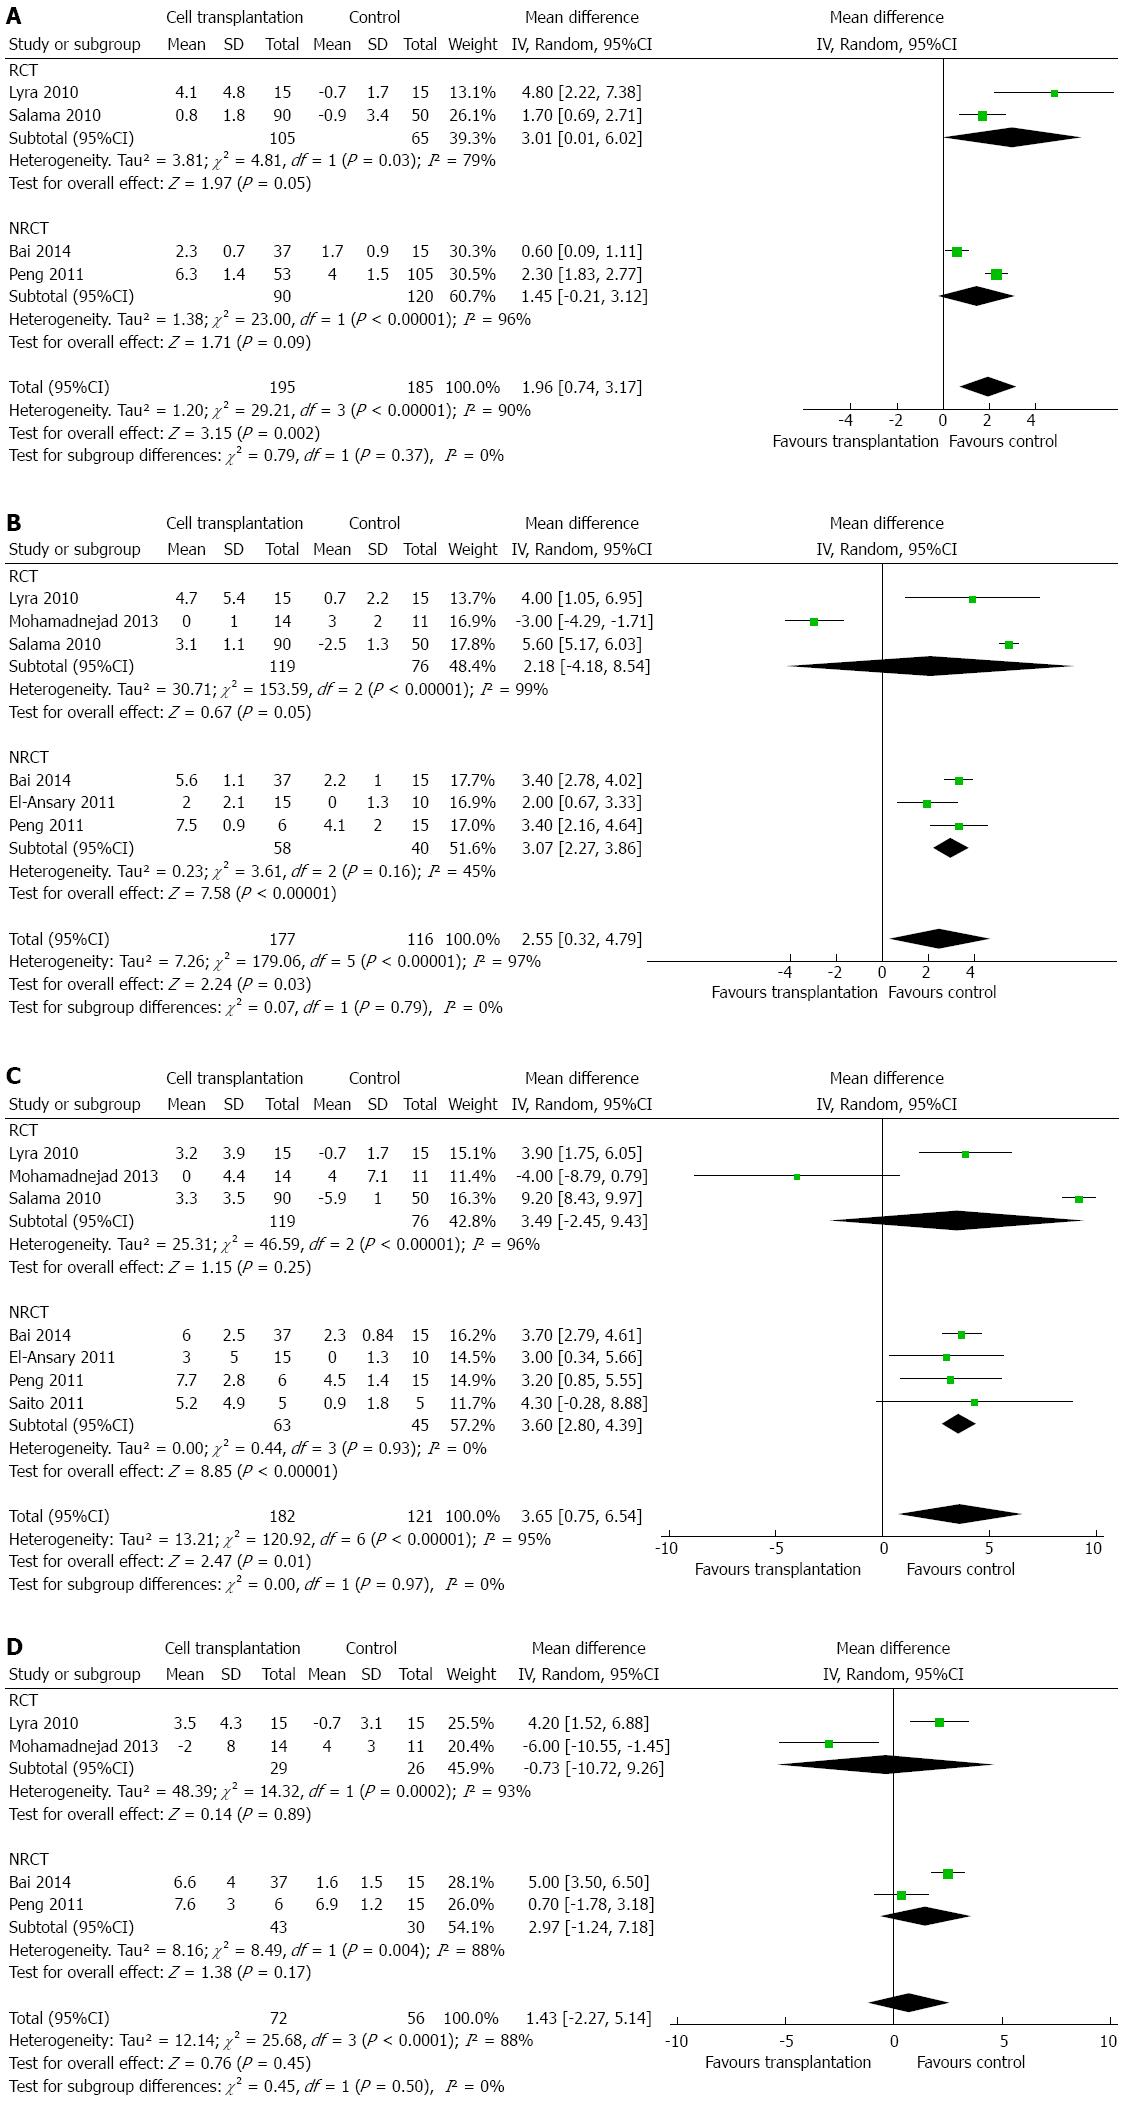
Figure 2 Changes in albumin level at 1 mo (A), 3 mo (B), 6 mo (C), and 12 mo (D) after autologous bone marrow transplantation.
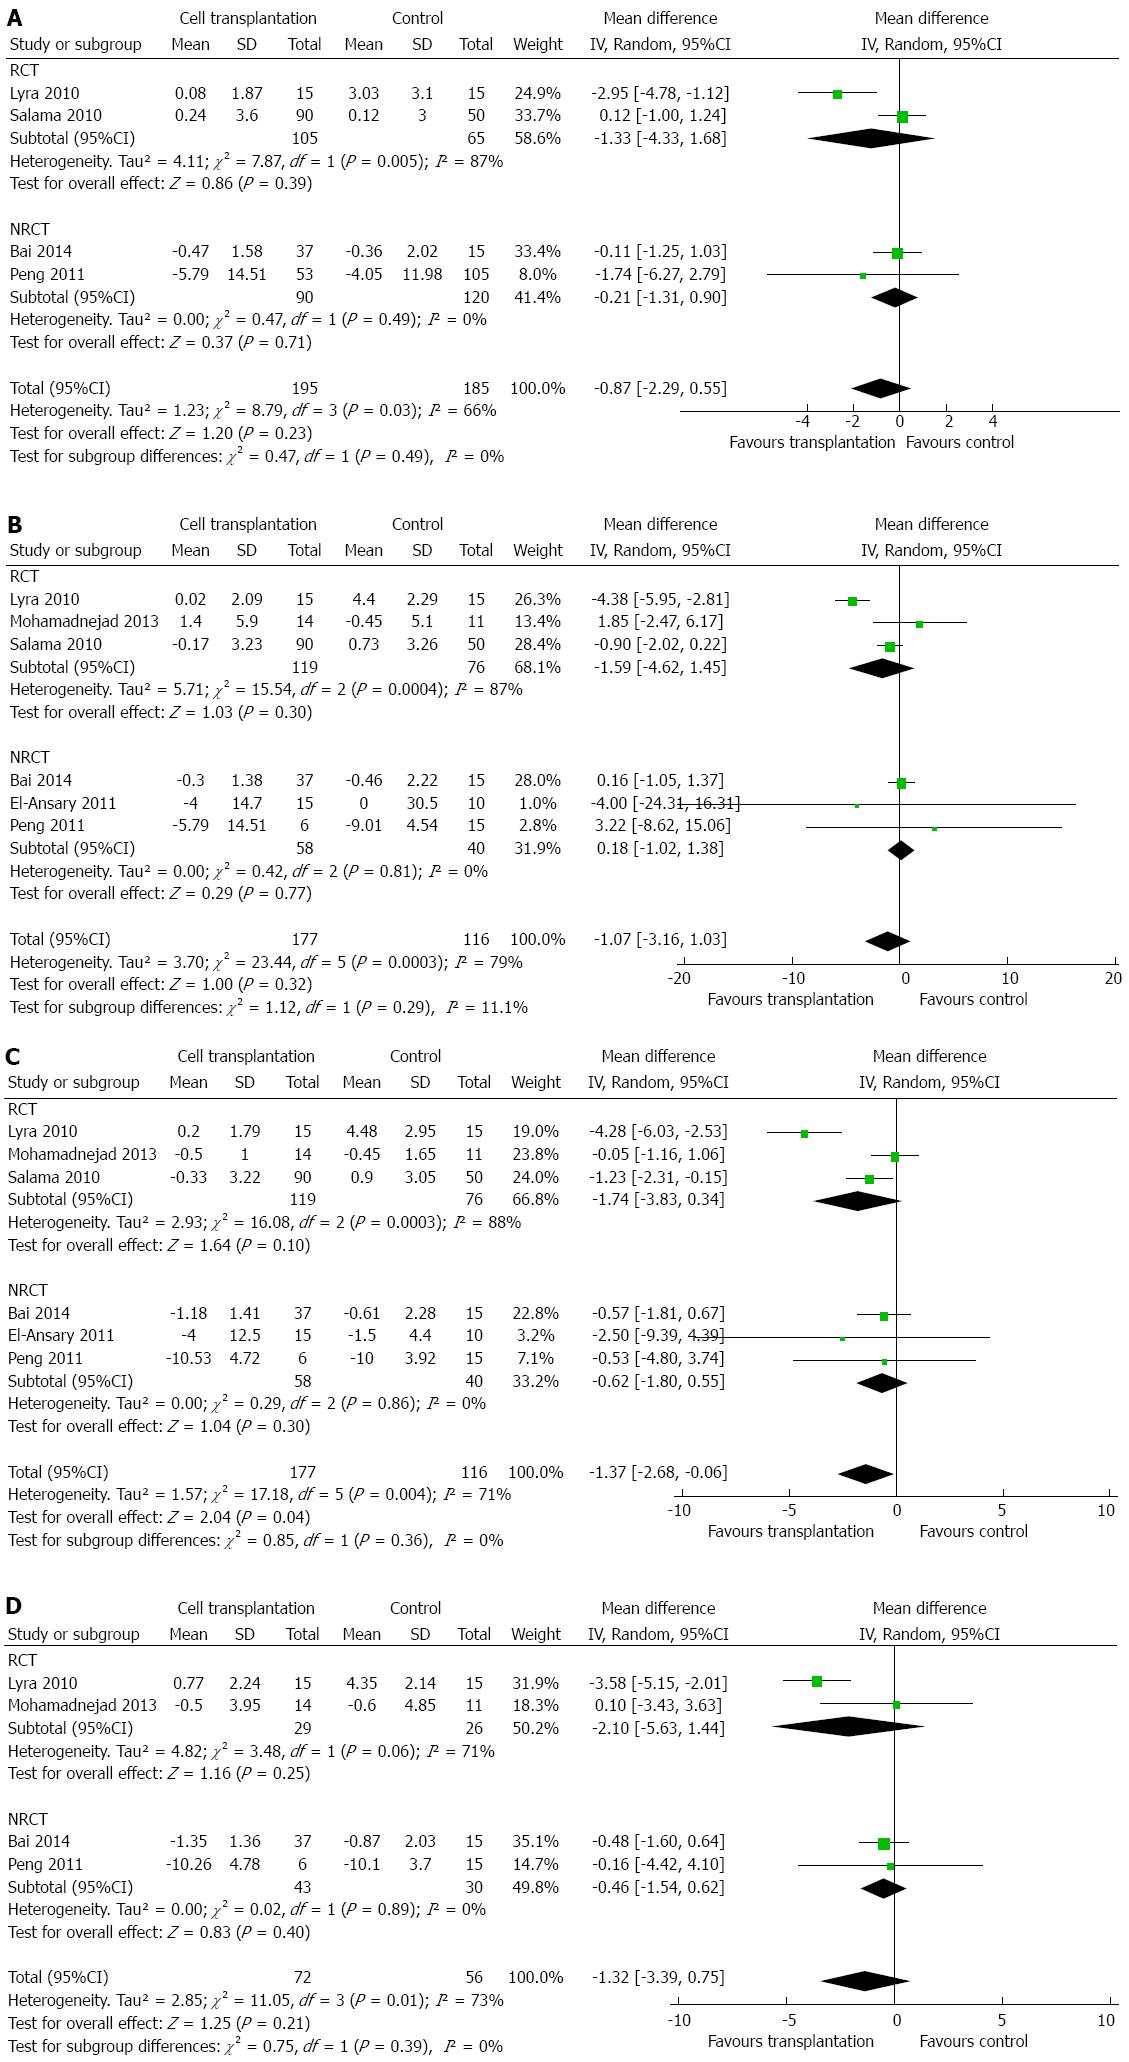
Figure 3 Changes in total bilirubin level at 1 mo (A), 3 mo (B), 6 mo (C), and 12 mo (D) after autologous bone marrow transplantation.
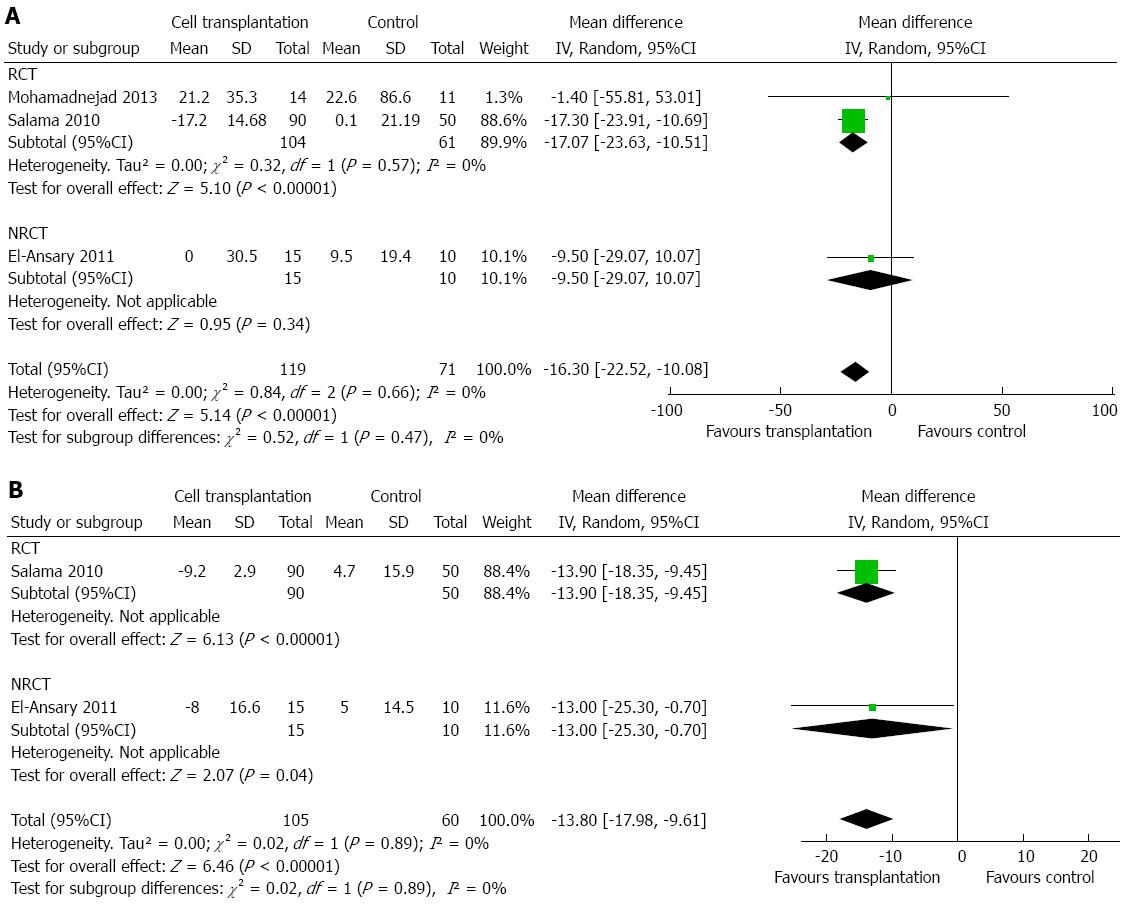
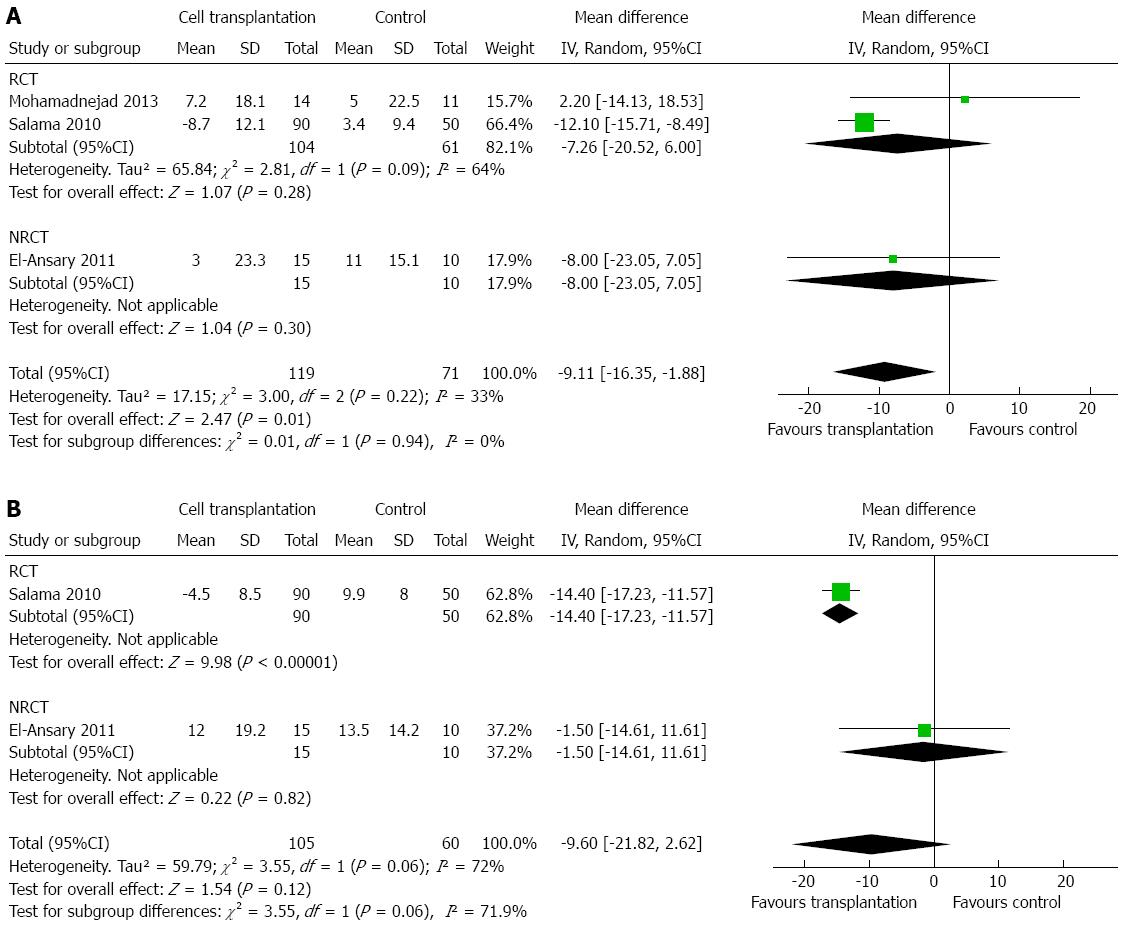
Figure 4 Changes in aspartate transaminase level at 3 mo (A) and 6 mo (B) after autologous bone marrow transplantation.
Figure 5 Changes in alanine transaminase level at 3 mo (A) and 6 mo (B) after autologous bone marrow transplantation.
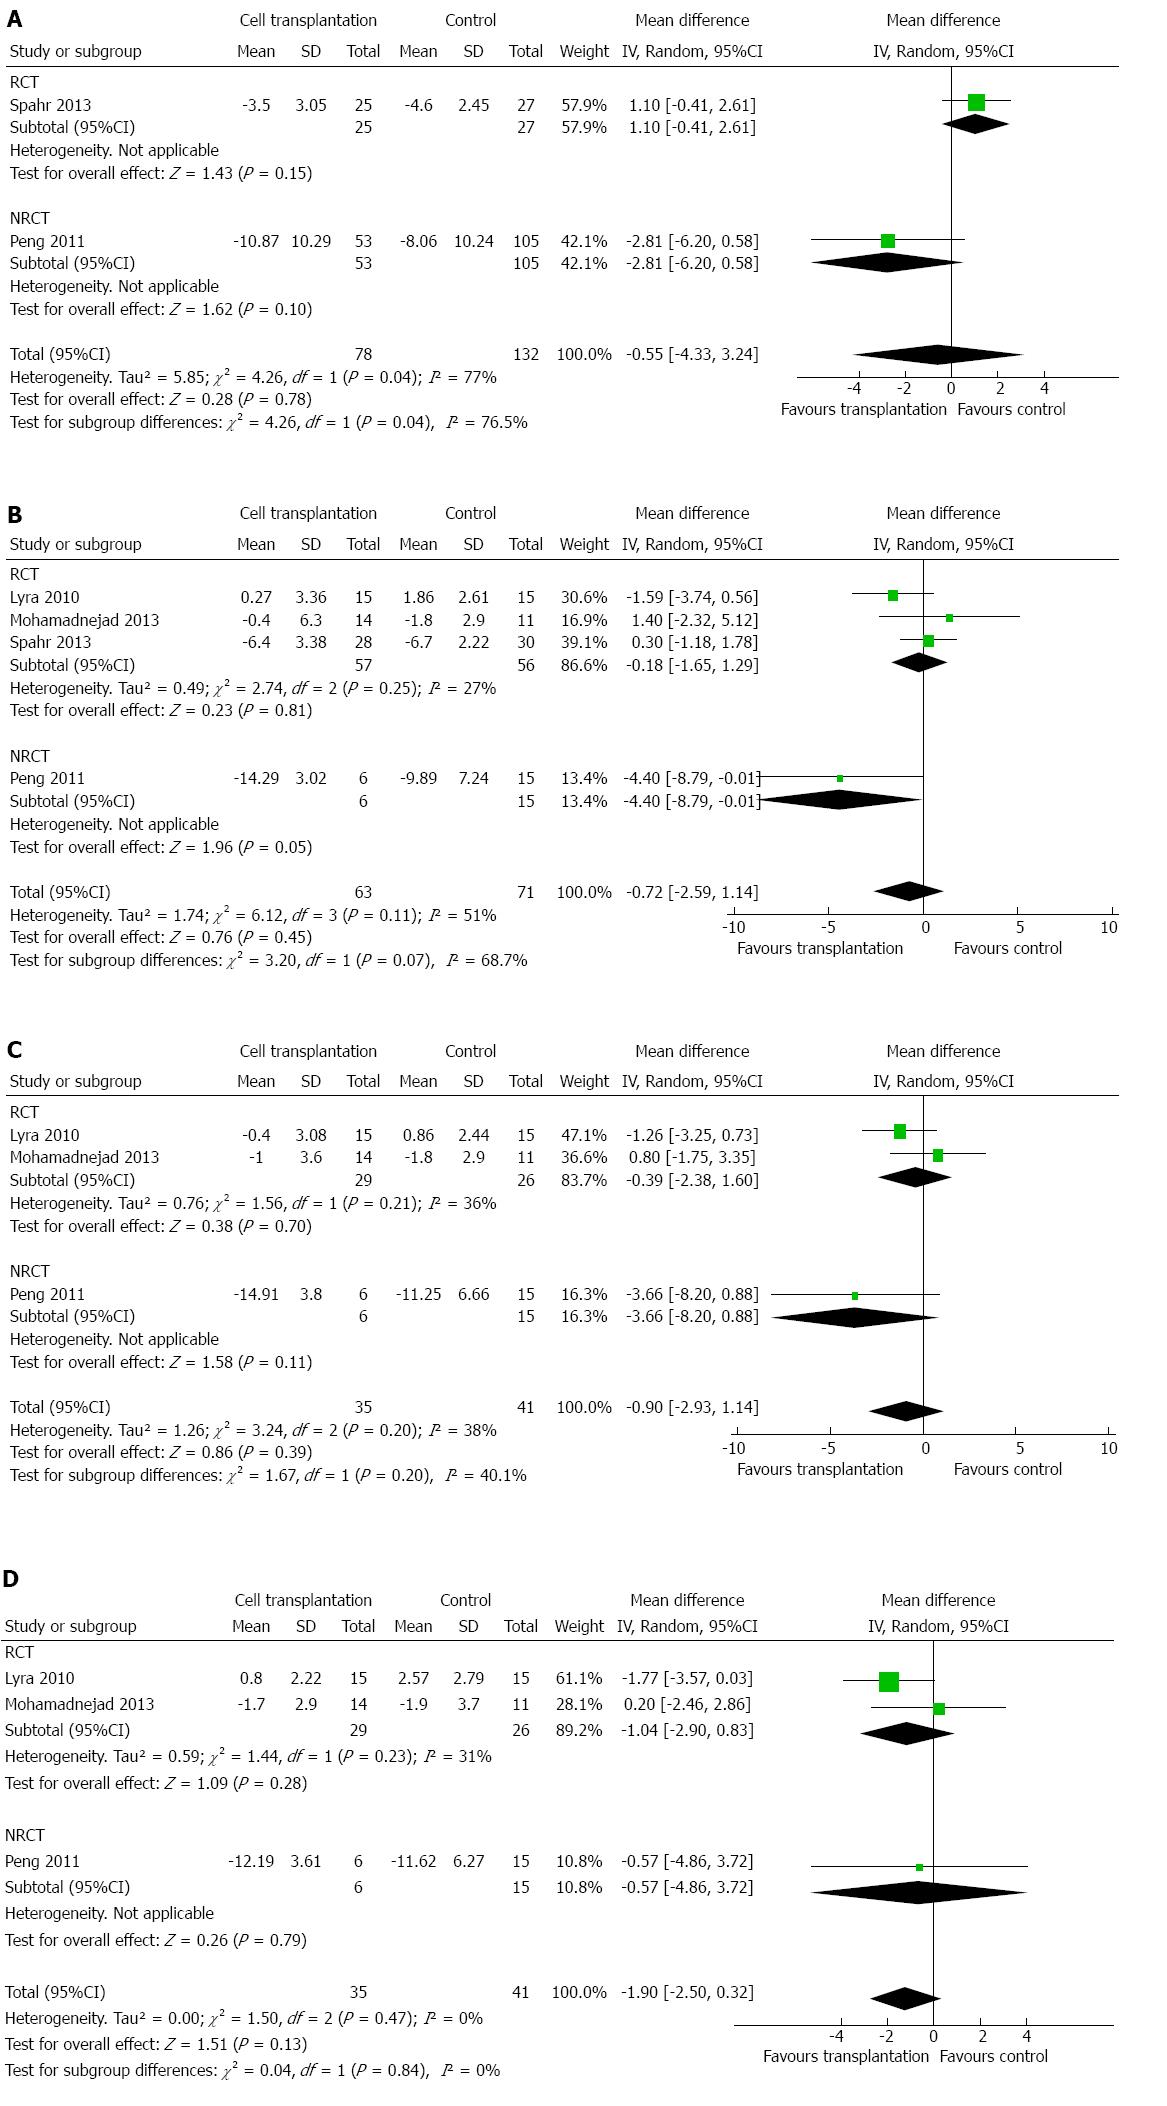
Figure 6 Changes in model for end-stage liver disease score at 1 mo (A), 3 mo (B), 6 mo (C), and 12 mo (D) after autologous bone marrow transplantation.
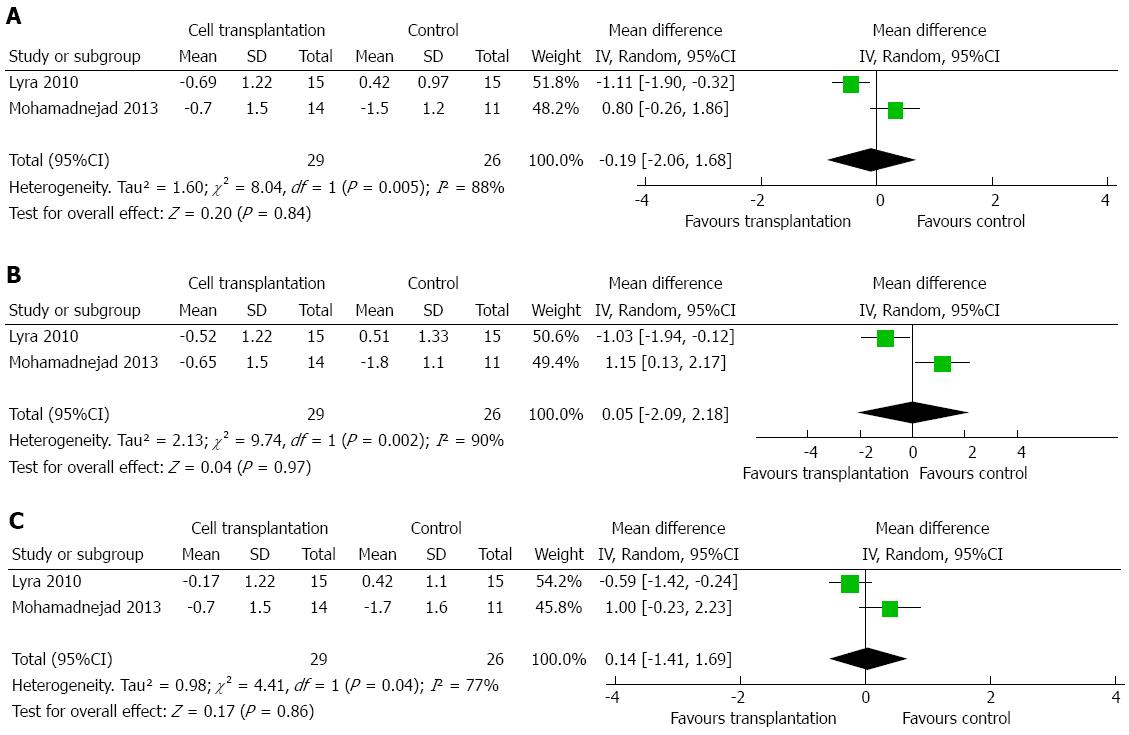
Figure 7 Changes in Child-Pugh score at 3 mo (A), 6 mo (B), and 12 mo (C) after autologous bone marrow transplantation.
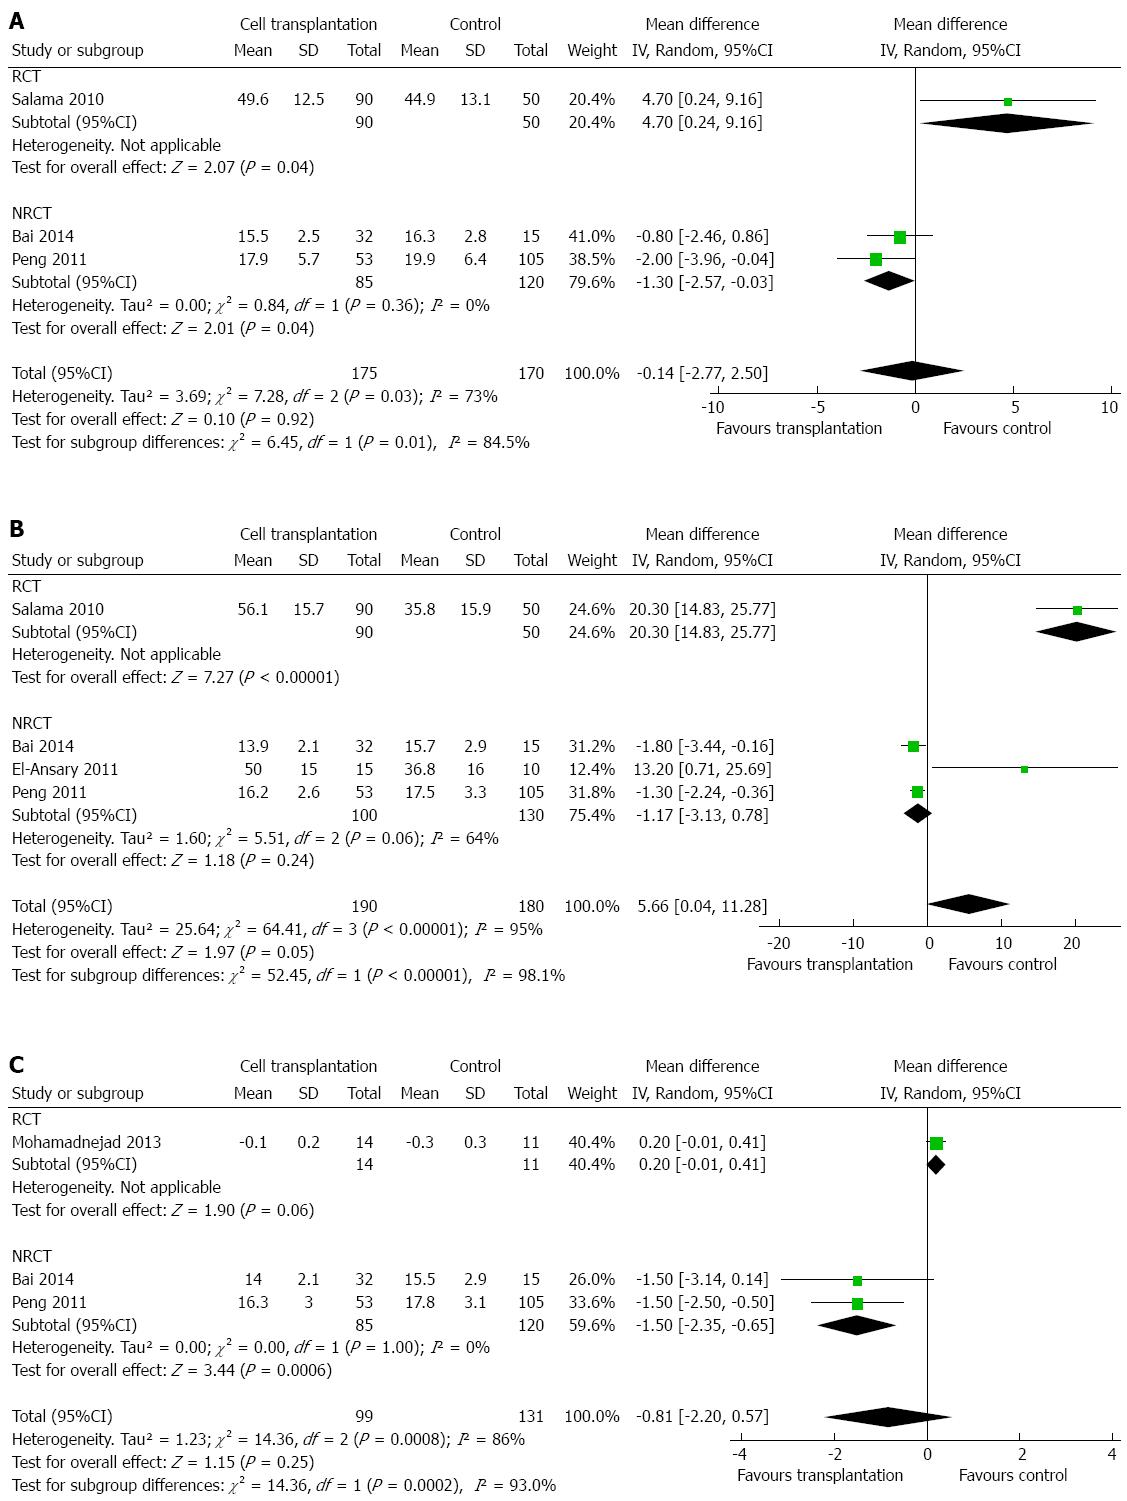
Figure 8 Changes in prothrombin time at 1 mo (A), 6 mo (B), and 12 mo (C) after autologous bone marrow transplantation.
- Citation: Pankaj P, Zhang Q, Bai XL, Liang TB. Autologous bone marrow transplantation in decompensated liver: Systematic review and meta-analysis. World J Gastroenterol 2015; 21(28): 8697-8710
- URL: https://www.wjgnet.com/1007-9327/full/v21/i28/8697.htm
- DOI: https://dx.doi.org/10.3748/wjg.v21.i28.8697


