©The Author(s) 2015.
World J Gastroenterol. May 21, 2015; 21(19): 5843-5855
Published online May 21, 2015. doi: 10.3748/wjg.v21.i19.5843
Published online May 21, 2015. doi: 10.3748/wjg.v21.i19.5843
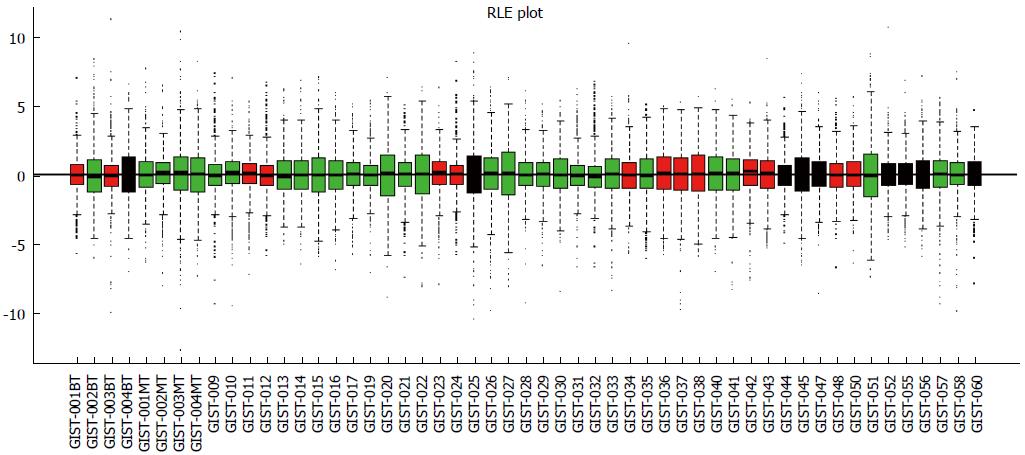
Figure 1 Relative log expression plot (quantile) of normalized data.
There were no significantly different profiles between samples. GIST: Gastrointestinal stromal tumor; RLE: Relative log expression.
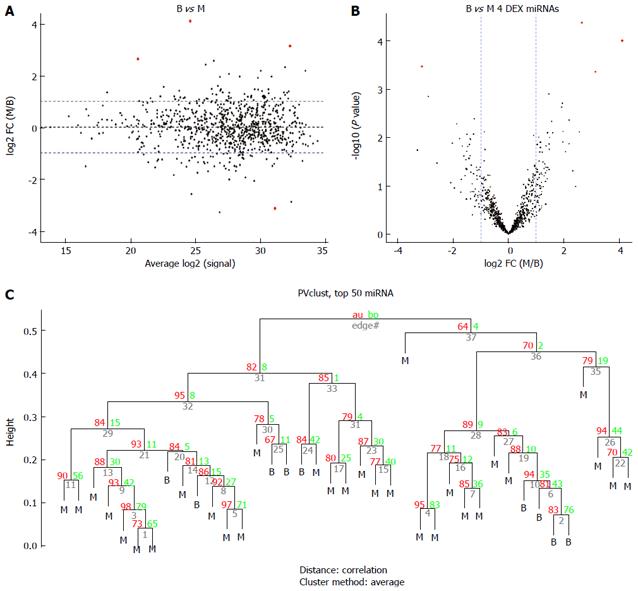
Figure 2 Comparison of the benign gastrointestinal stromal tumors (B group) vs the malignant gastrointestinal stromal tumors (M group).
A: MA plot of assays used to profile the compared samples: fold-change (Y-axis) vs normalized Ct measurements; B: Volcano plot of the resulting P values of the t-test between the B and M groups. Four miRNAs show adjusted P values (FDR) below 0.1 and fold-changes above 2 (shown in red); C: Hierarchical clustering of the 9 benign GIST tissues and 30 malignant GIST tissues based on the 50 most variable (top 50) miRNA assays. GIST: Gastrointestinal stromal tumor; FDR: False discovery rate.
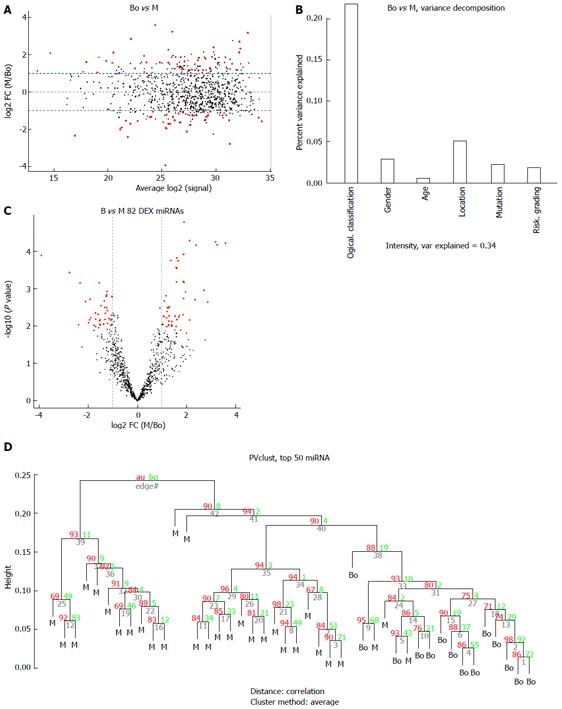
Figure 3 Comparison of the borderline gastrointestinal stromal tumors (borderline group) vs the malignant gastrointestinal stromal tumors (M group).
A: MA plot of assays used to profile the compared samples: fold-change (Y-axis) vs normalized Ct measurements; B: 45% of the variance observed in the Ct measurements of the 50 most variable (top 50) miRNA assays across all samples can be attributed to the sample description (BO or M). The remaining covariates considered here (“gender”, “tumor grade”, or “stage”) account for less than 5%; C: Volcano plot of the resulting P-values of the t-test between the Bo and M groups. Eighty-two miRNAs show adjusted P-values (FDR) below 0.1 and fold-changes above 2 (shown in red); D: Hierarchical clustering of the 14 borderline GIST tissues and 30 malignant GIST tissues based on the 50 most variable (top 50) miRNA assays. GIST: Gastrointestinal stromal tumor; FDR: False discovery rate; M: Malignant GIST tissues.
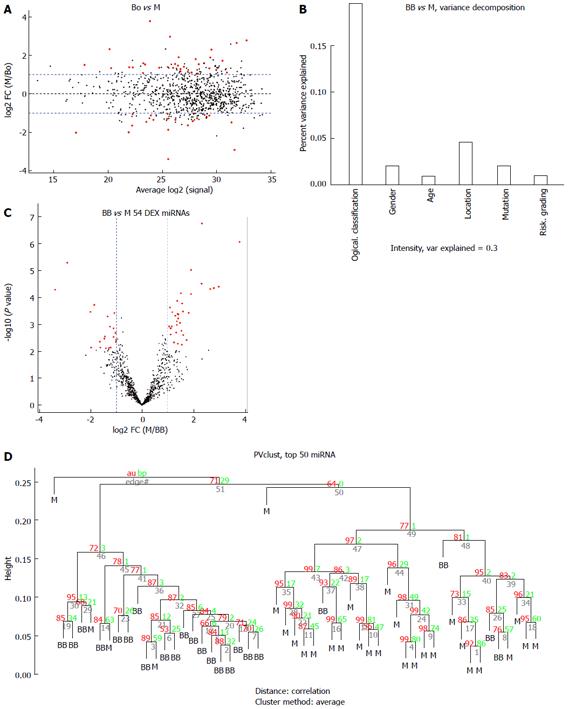
Figure 4 Comparison of the benign or borderline gastrointestinal stromal tumors (benign and borderline group) vs the malignant gastrointestinal stromal tumors (M group).
A: MA plot of assays used to profile the compared samples: fold-change (Y-axis) vs normalized Ct measurements; B: Forty-five percent of the variance observed in the Ct measurements of the 50 most variable (top 50) miRNA assays across all samples can be attributed to the sample description (BB or M). The remaining covariates considered here (“gender”, “tumor grade” or “stage”) account for less than 5%; C: Volcano plot of the resulting P-values of the t-test between the Bo and M groups. Fifty-four miRNAs show adjusted P-values (FDR) below 0.1 and fold-changes above 2 (shown in red); D: Hierarchical clustering of the 23 benign or borderline GIST tissues and 30 malignant GIST tissues based on the 50 most variable (top 50) miRNA assays. GIST: Gastrointestinal stromal tumor; FDR: False discovery rate; M: Malignant GIST tissues.
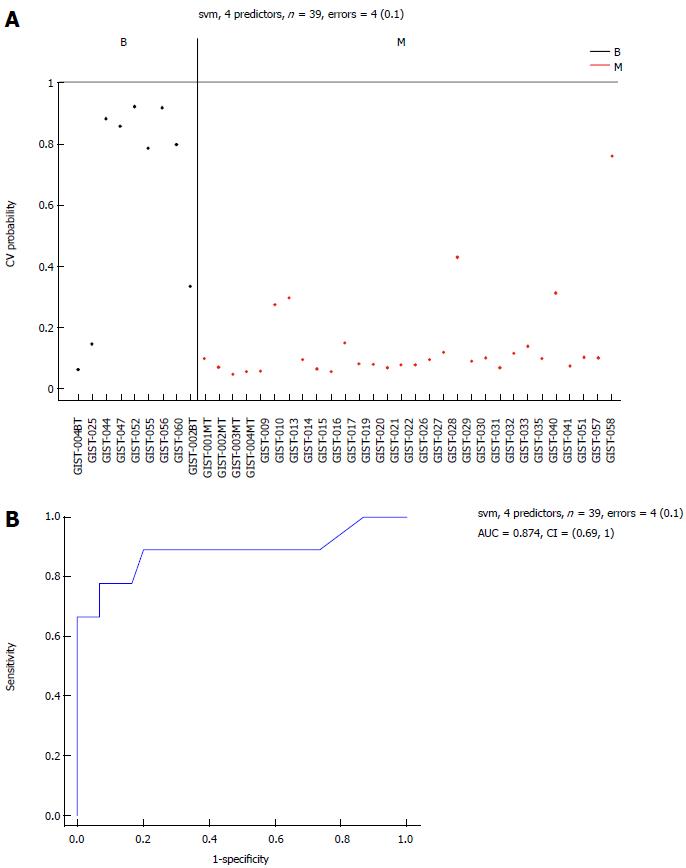
Figure 5 Area-under-the-curve (0.
874) estimation for the miRNA panel in the B and M groups. Performance of the 6 selected miRNAs in Table 2 for classification of benign gastrointestinal stromal tumor (GIST) tissues compared with malignant GIST tissues, using a support vector machine (SVM) algorithm and leave-one-out cross-validation procedure. A: Benign GIST tissue prediction probabilities for each sample used in this study: 39 samples with an error = 4 (0.1); B: Receiver operating characteristic (ROC) curve [area-under-the-curve (AUC) = 0.874]. M: Malignant GIST tissues.
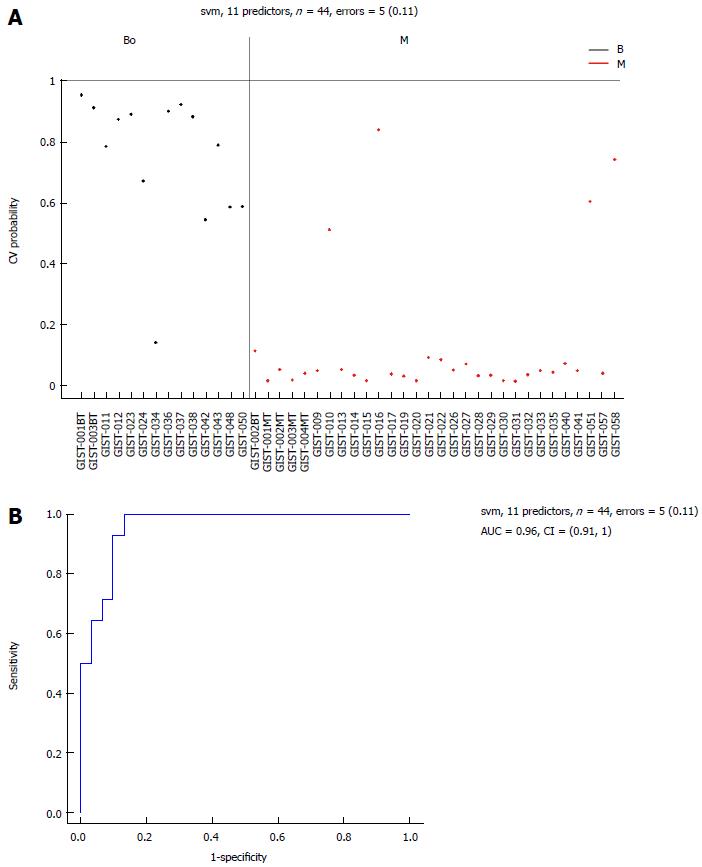
Figure 6 Area-under-the-curve (0.
96) estimation for the miRNA panel in the borderline and M groups. Performance of the 11 selected miRNAs for classification of borderline gastrointestinal stromal tumor tissues compared with malignant gastrointestinal stromal tumor tissues. A: Support vector machine (SVM) prediction probability for 44 samples with an error = 5 (0.11); B: Area-under-the-curve (AUC = 0.96) estimation for the miRNA panel in the borderline gastrointestinal stromal tumor (GIST) tissues and the malignant GIST tissues. M: Malignant GIST tissues.
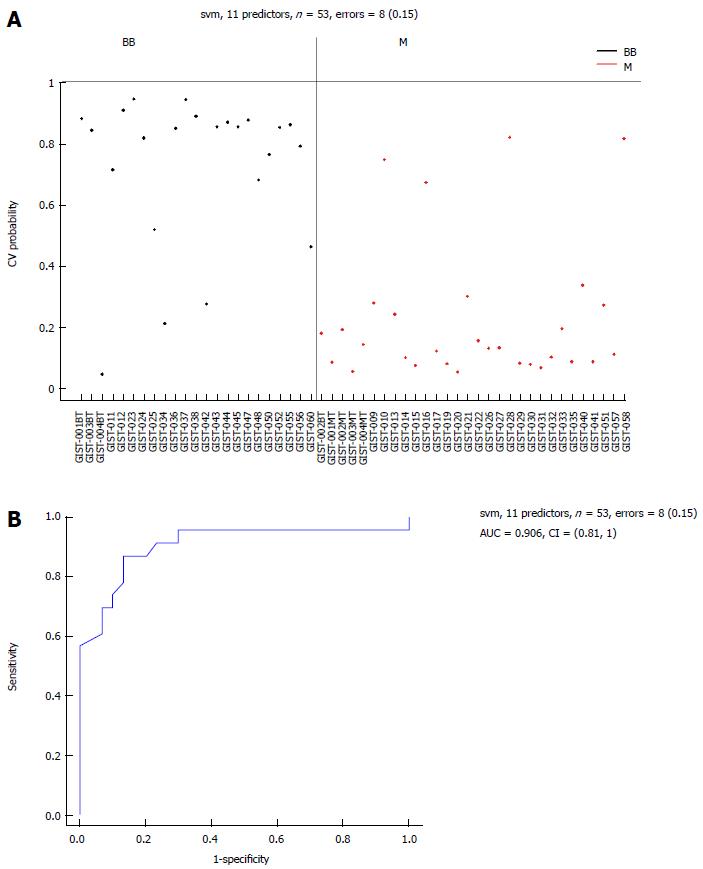
Figure 7 Area-under-the-curve (0.
906) estimation for the miRNA panel in the benign or borderline gastrointestinal stromal tumor tissues and M groups. Eleven selected miRNAs comparing the BB and M groups. A: Support vector machine (SVM) prediction probability for 53 samples with an error = 8 (0.15); B: Area-under-the-curve (AUC = 0.906) estimation for the miRNA panel in the BB and M groups. BB: Benign or borderline GIST tissues; M: Malignant GIST tissues; GIST: Gastrointestinal stromal tumor.
- Citation: Tong HX, Zhou YH, Hou YY, Zhang Y, Huang Y, Xie B, Wang JY, Jiang Q, He JY, Shao YB, Han WM, Tan RY, Zhu J, Lu WQ. Expression profile of microRNAs in gastrointestinal stromal tumors revealed by high throughput quantitative RT-PCR microarray. World J Gastroenterol 2015; 21(19): 5843-5855
- URL: https://www.wjgnet.com/1007-9327/full/v21/i19/5843.htm
- DOI: https://dx.doi.org/10.3748/wjg.v21.i19.5843


