Copyright
©The Author(s) 2015.
World J Gastroenterol. May 14, 2015; 21(18): 5695-5706
Published online May 14, 2015. doi: 10.3748/wjg.v21.i18.5695
Published online May 14, 2015. doi: 10.3748/wjg.v21.i18.5695
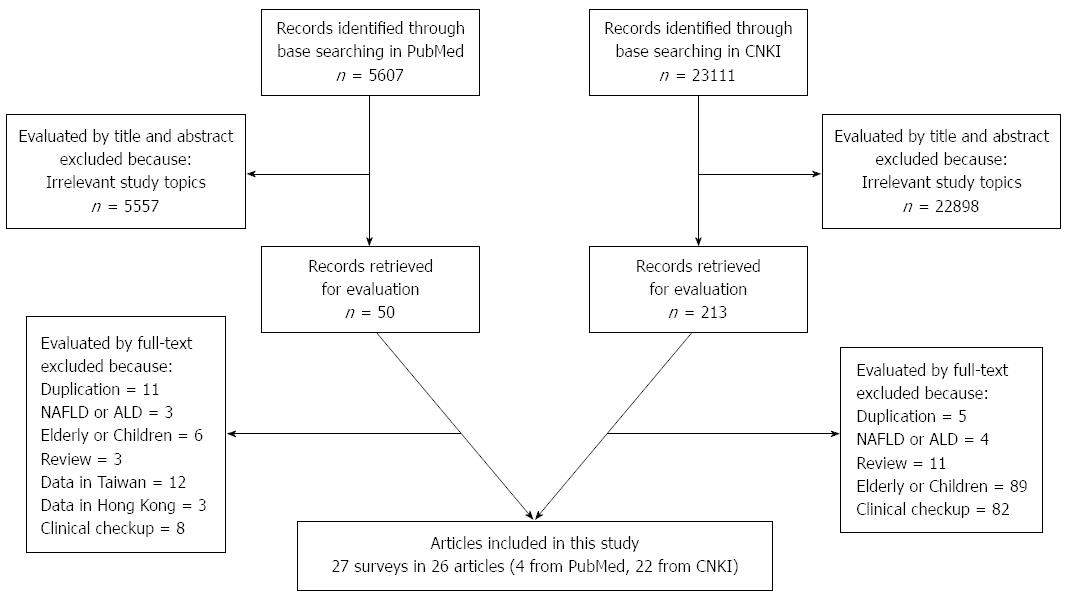
Figure 1 Flowchart of the study evaluation process.
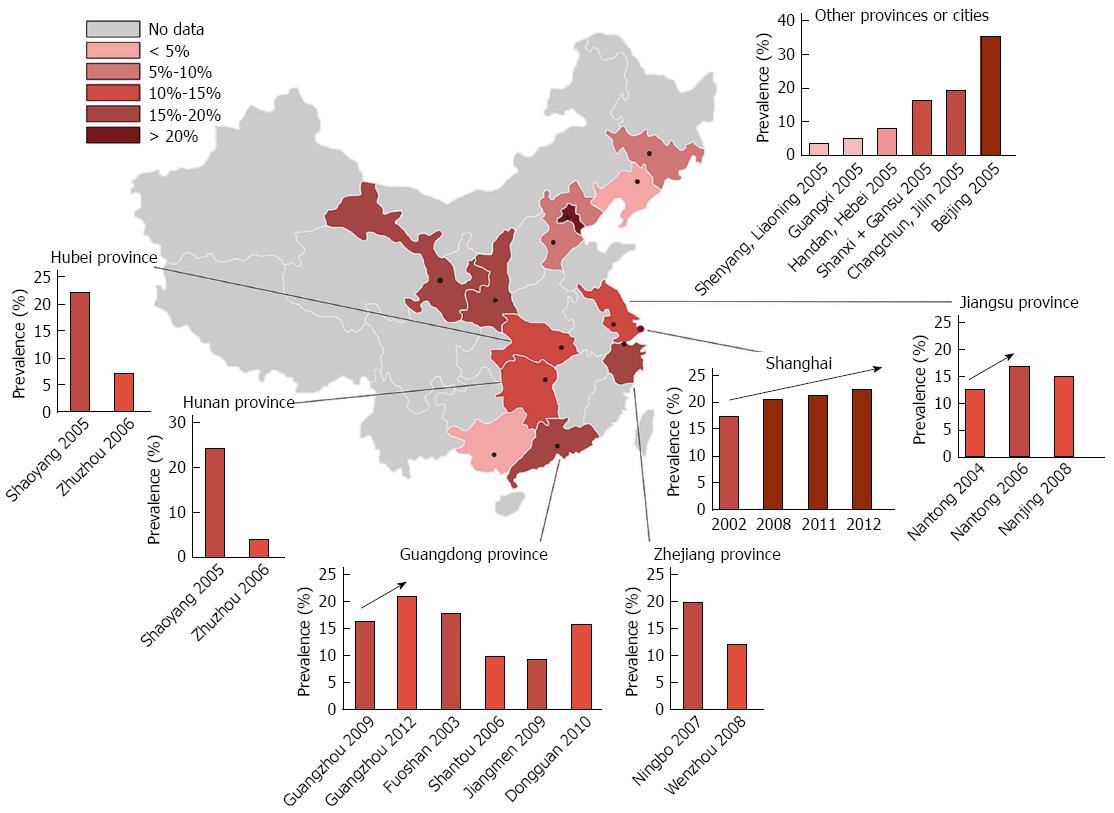
Figure 2 Prevalence in China.
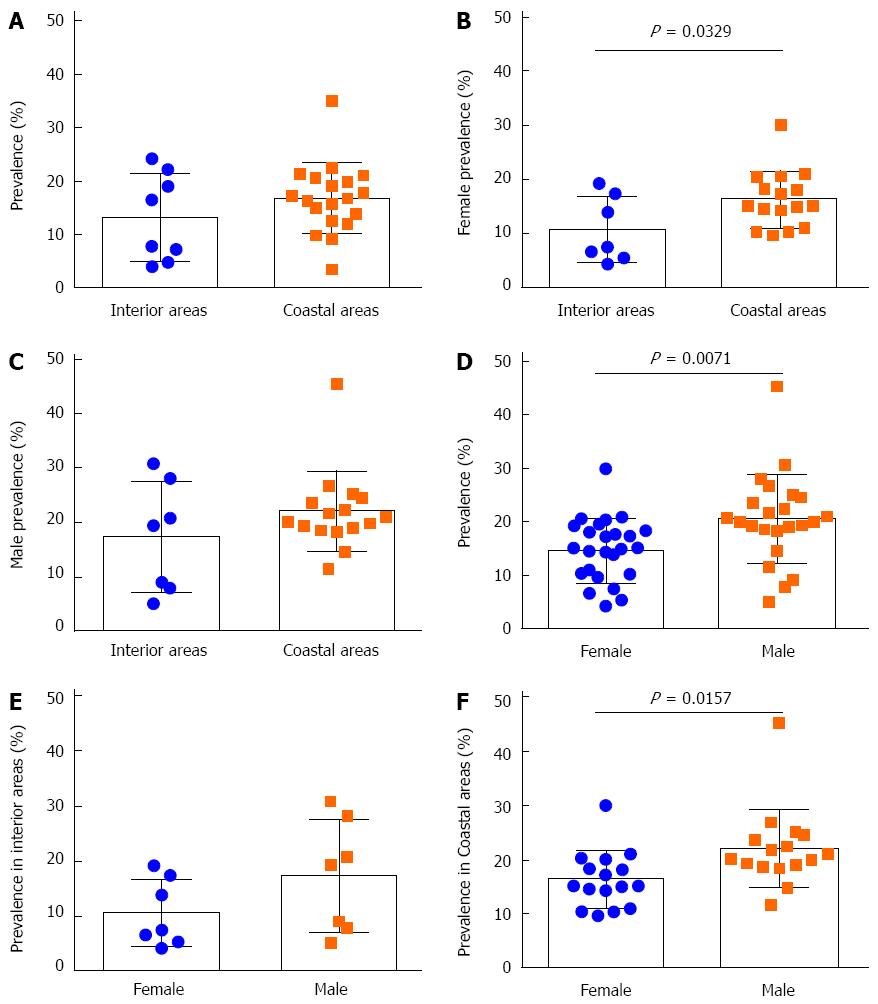
Figure 3 Comparisons of the prevalence of fatty liver disease according to gender and region.
A: All: Interior areas vs coastal areas; B: Females: interior areas vs coastal areas; C: Males: interior areas vs coastal areas; D: All: females vs males; E: Interior areas: females vs males; F: Coastal areas: females vs males.
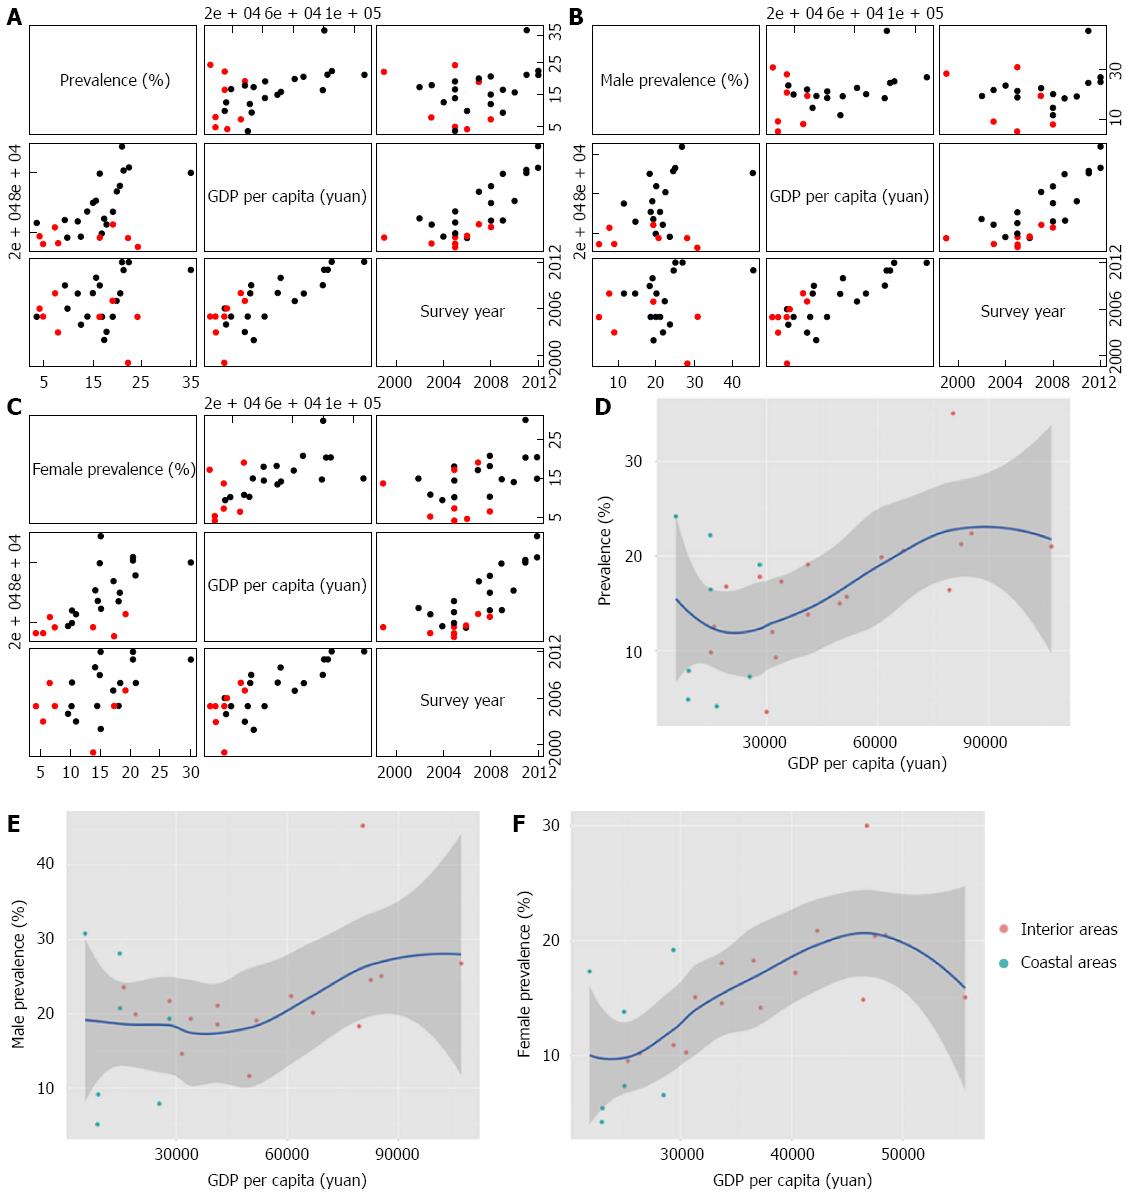
Figure 4 Correlations of the prevalence with the gross domestic product per capita and survey years.
A: The general prevalence; B: The prevalence in males; C: The prevalence in females (Black spots: Studies in coastal areas; Red spots: Studies in interior areas). Survey years and changes of the prevalence according to the gross domestic product (GDP) per capita; D: The general prevalence; E: The prevalence in males; F: The prevalence in females (Red spots: Studies in coastal areas; Green spots: Studies in interior areas).
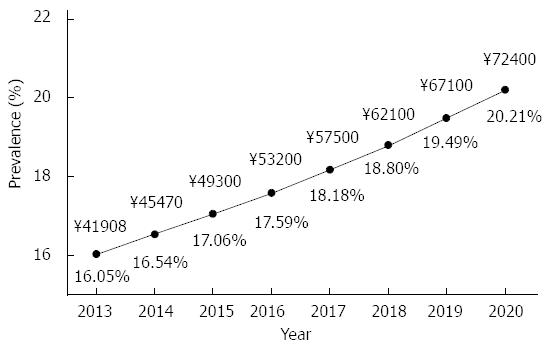
Figure 5 Estimated prevalence of fatty liver disease from 2013 to 2020, based on the current trend.
- Citation: Zhu JZ, Zhou QY, Wang YM, Dai YN, Zhu J, Yu CH, Li YM. Prevalence of fatty liver disease and the economy in China: A systematic review. World J Gastroenterol 2015; 21(18): 5695-5706
- URL: https://www.wjgnet.com/1007-9327/full/v21/i18/5695.htm
- DOI: https://dx.doi.org/10.3748/wjg.v21.i18.5695


