Copyright
©The Author(s) 2015.
World J Gastroenterol. Apr 28, 2015; 21(16): 5081-5089
Published online Apr 28, 2015. doi: 10.3748/wjg.v21.i16.5081
Published online Apr 28, 2015. doi: 10.3748/wjg.v21.i16.5081
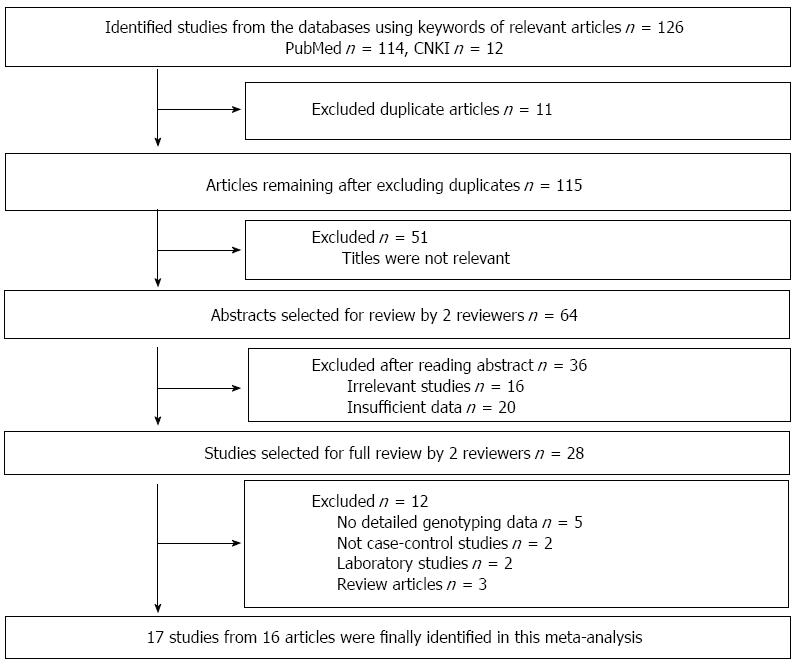
Figure 1 Flow diagram of study identification and selection.
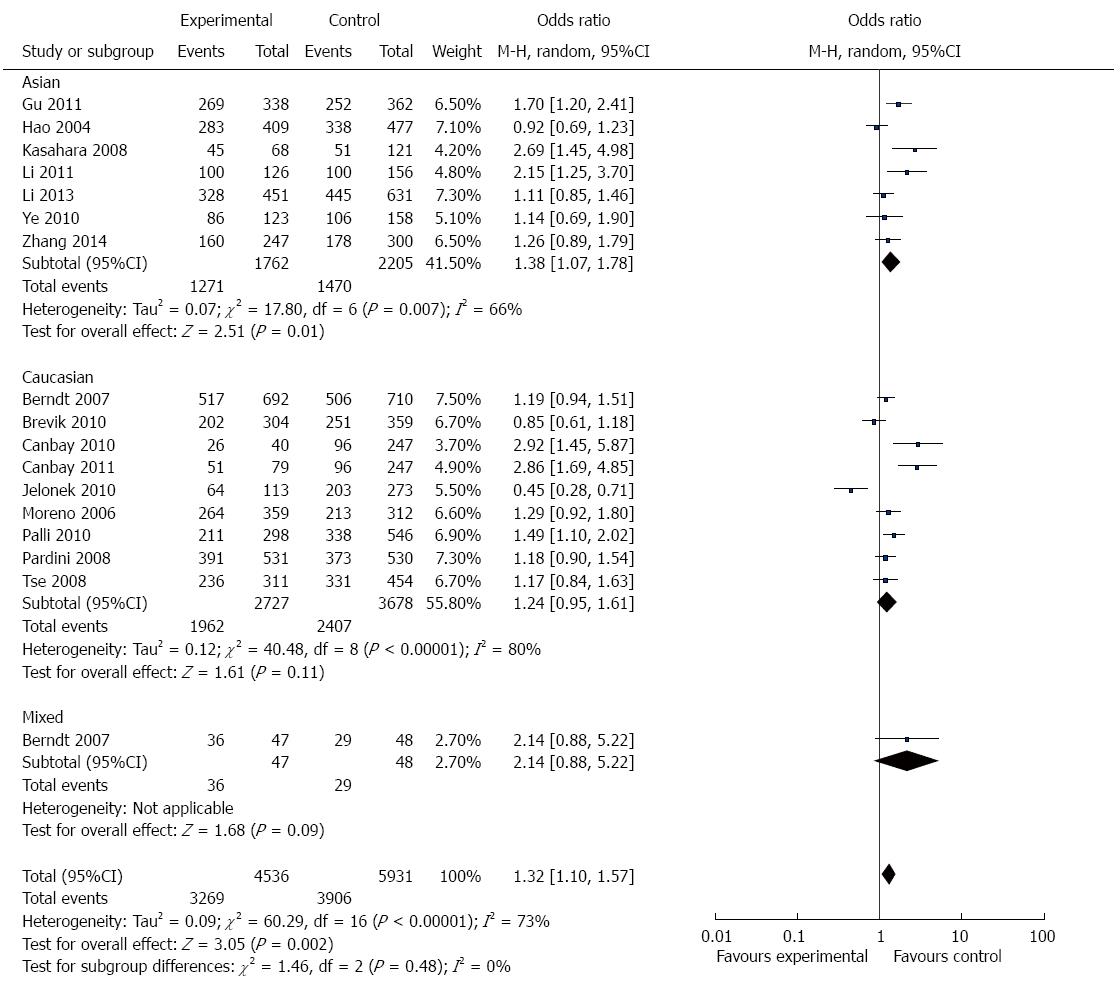
Figure 2 Forest plot of association of apurinic endonuclease 1 Asp148Glu polymorphism with gastrointestinal cancer risk stratified by ethnicity (TG + GG vs TT).
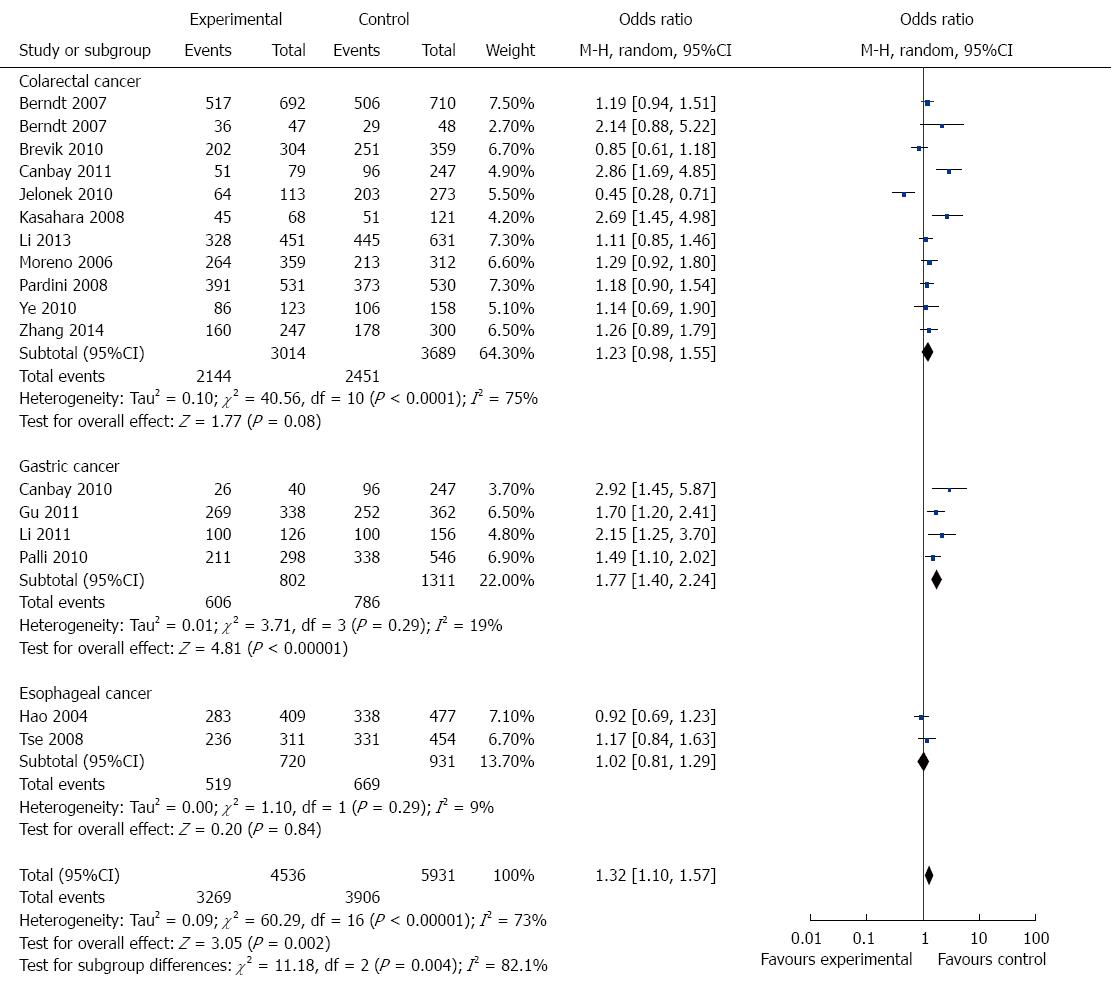
Figure 3 Forest plot of association of apurinic endonuclease 1 Asp148Glu polymorphism with GI cancer risk stratified by cancer type (TG + GG vs TT).
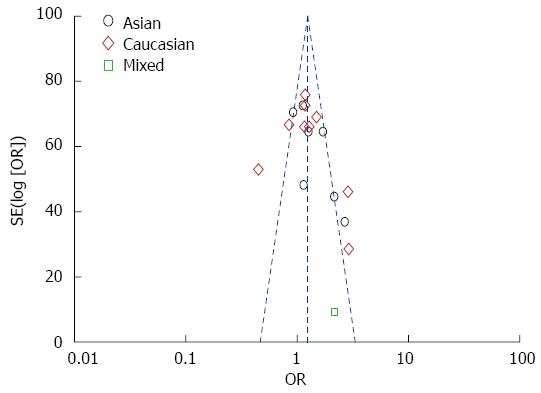
Figure 4 Funnel plot for publication bias.
- Citation: Dai ZJ, Shao YP, Kang HF, Tang W, Xu D, Zhao Y, Liu D, Wang M, Yang PT, Wang XJ. Relationship between apurinic endonuclease 1 Asp148Glu polymorphism and gastrointestinal cancer risk: An updated meta-analysis. World J Gastroenterol 2015; 21(16): 5081-5089
- URL: https://www.wjgnet.com/1007-9327/full/v21/i16/5081.htm
- DOI: https://dx.doi.org/10.3748/wjg.v21.i16.5081


