Copyright
©The Author(s) 2015.
World J Gastroenterol. Apr 7, 2015; 21(13): 4038-4047
Published online Apr 7, 2015. doi: 10.3748/wjg.v21.i13.4038
Published online Apr 7, 2015. doi: 10.3748/wjg.v21.i13.4038
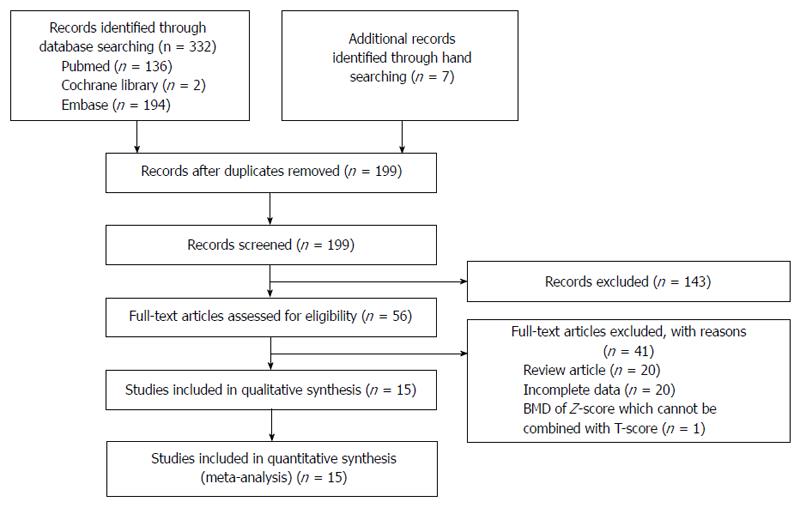
Figure 1 Flow diagram for identification of relevant studies.
Figure 2 Association between alcoholic liver diseases and bone fractures.
The size of each square is proportional to the study’s weight. Diamond is the summary estimate from the pooled studies with 95% CI. ALD: Alcoholic liver diseases;CI: Confidence interval (random effect model).
Figure 3 Association between alcoholic liver diseases and osteoporosis.
The size of each square is proportional to the study’s weight. Diamond is the summary estimate from the pooled studies with 95%CI. ALD: Alcoholic liver diseases; CI: Confidence interval (Random effect model).
- Citation: Bang CS, Shin IS, Lee SW, Kim JB, Baik GH, Suk KT, Yoon JH, Kim YS, Kim DJ. Osteoporosis and bone fractures in alcoholic liver disease: A meta-analysis. World J Gastroenterol 2015; 21(13): 4038-4047
- URL: https://www.wjgnet.com/1007-9327/full/v21/i13/4038.htm
- DOI: https://dx.doi.org/10.3748/wjg.v21.i13.4038


