©The Author(s) 2015.
World J Gastroenterol. Mar 14, 2015; 21(10): 3093-3099
Published online Mar 14, 2015. doi: 10.3748/wjg.v21.i10.3093
Published online Mar 14, 2015. doi: 10.3748/wjg.v21.i10.3093
Figure 1 Forest plot of operative time between the two groups.
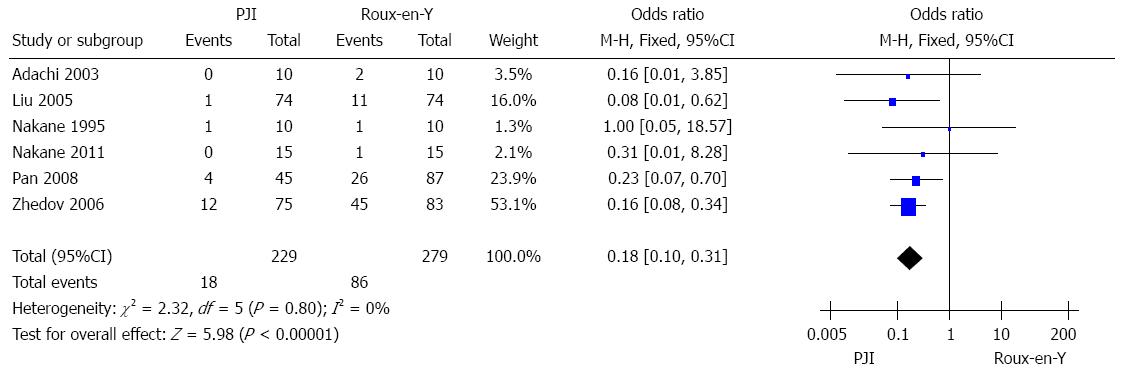
Figure 2 Forest plot of incidence of reflux esophagitis between the two groups.
Figure 3 Forest plot of incidence of dumping syndrome between the two groups.
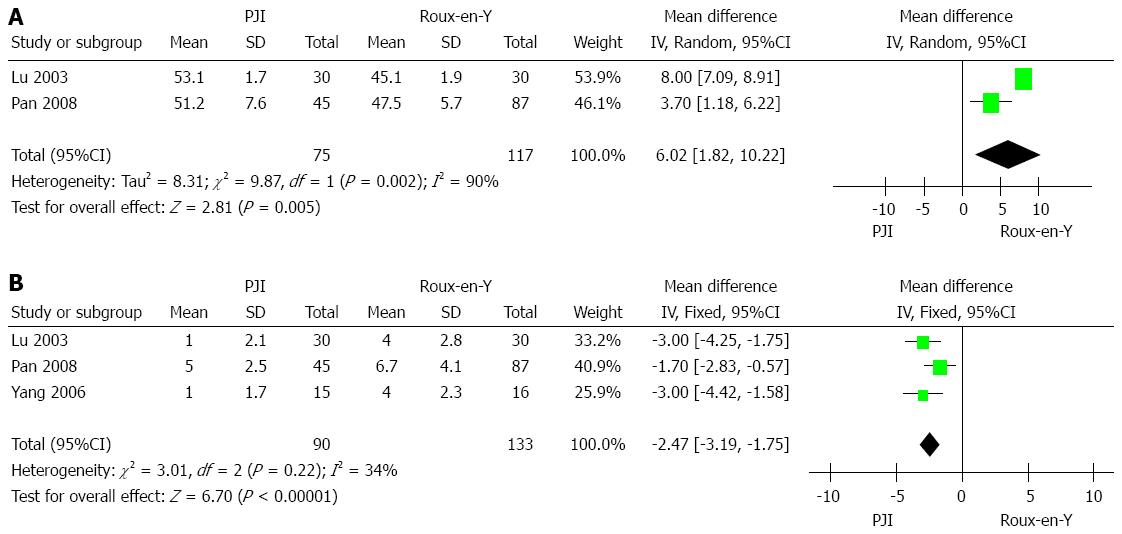
Figure 4 Forest plots of prognostic nutritional index (A) and postoperative weight loss (B) between the two groups.
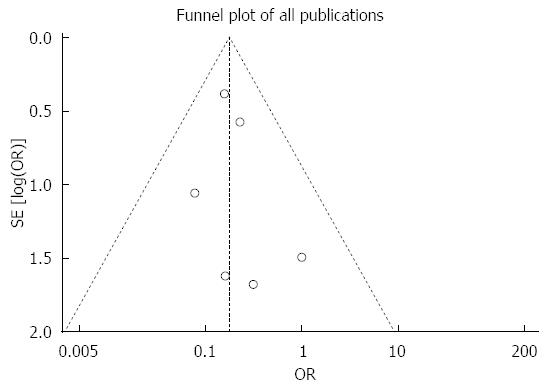
Figure 5 Funnel plot for publication bias.
- Citation: Fan KX, Xu ZF, Wang MR, Li DT, Yang XS, Guo J. Outcomes for jejunal interposition reconstruction compared with Roux-en-Y anastomosis: A meta-analysis. World J Gastroenterol 2015; 21(10): 3093-3099
- URL: https://www.wjgnet.com/1007-9327/full/v21/i10/3093.htm
- DOI: https://dx.doi.org/10.3748/wjg.v21.i10.3093


