Copyright
©2014 Baishideng Publishing Group Co.
World J Gastroenterol. Feb 21, 2014; 20(7): 1858-1870
Published online Feb 21, 2014. doi: 10.3748/wjg.v20.i7.1858
Published online Feb 21, 2014. doi: 10.3748/wjg.v20.i7.1858
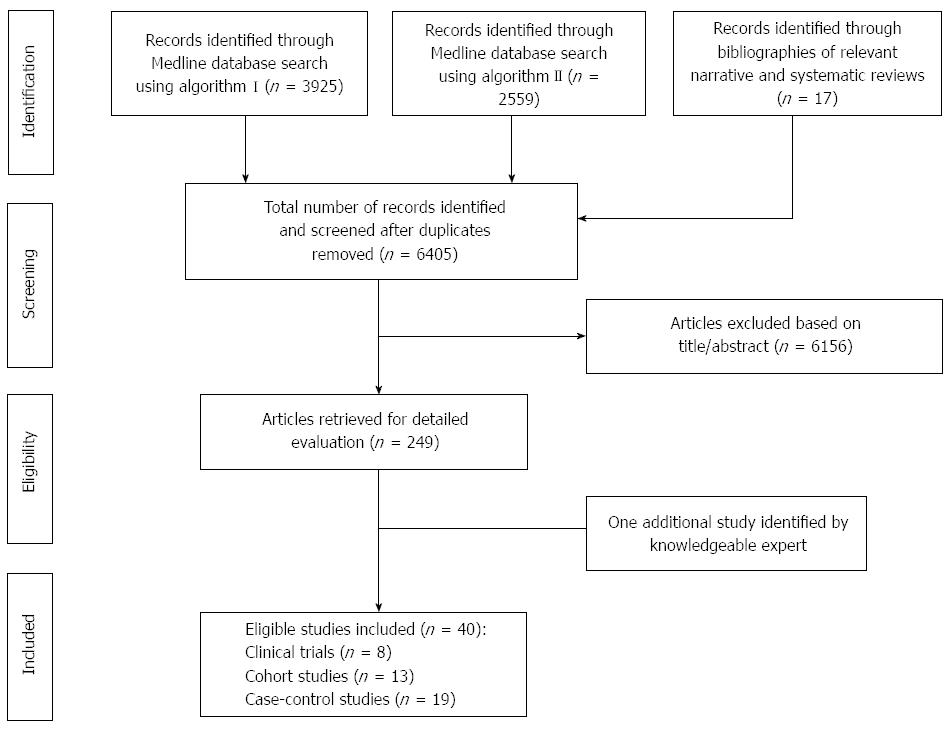
Figure 1 Summary of evidence search and selection.
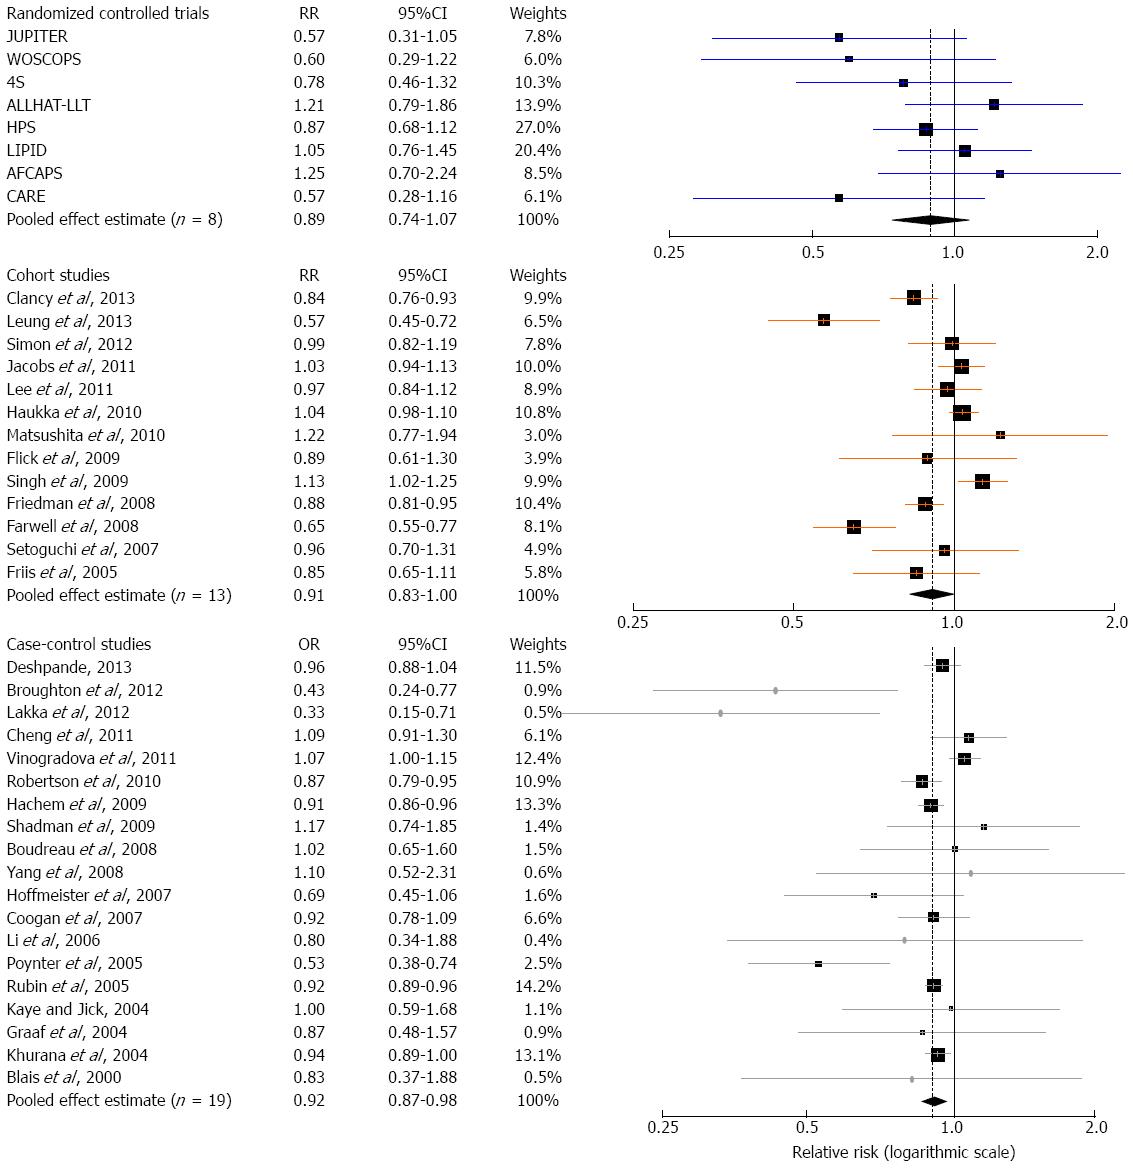
Figure 2 Forest plot: results from individual studies and meta-analyses.
The RR and 95%CI for each study are displayed on a logarithmic scale. Pooled estimates are from a random-effects model.
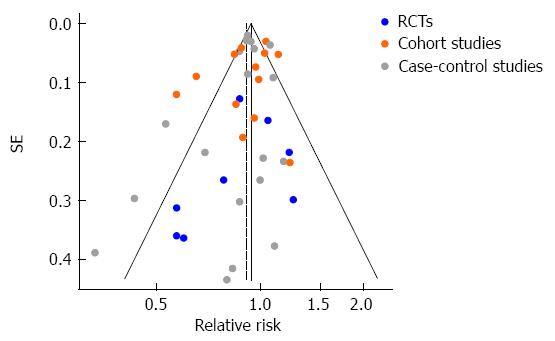
Figure 3 Funnel plot of observed relative risk against standard error (as a surrogate of study size) for all studies analyzed.
RCT: Randomized controlled trials.
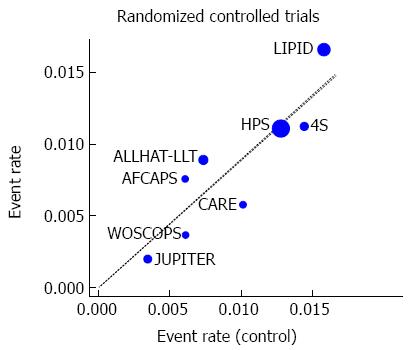
Figure 4 L’Abbé plot of the incidence of colorectal cancer in the experimental (statin) group, against the incidence in the control group, across the analyzed randomized controlled trials (n = 8).
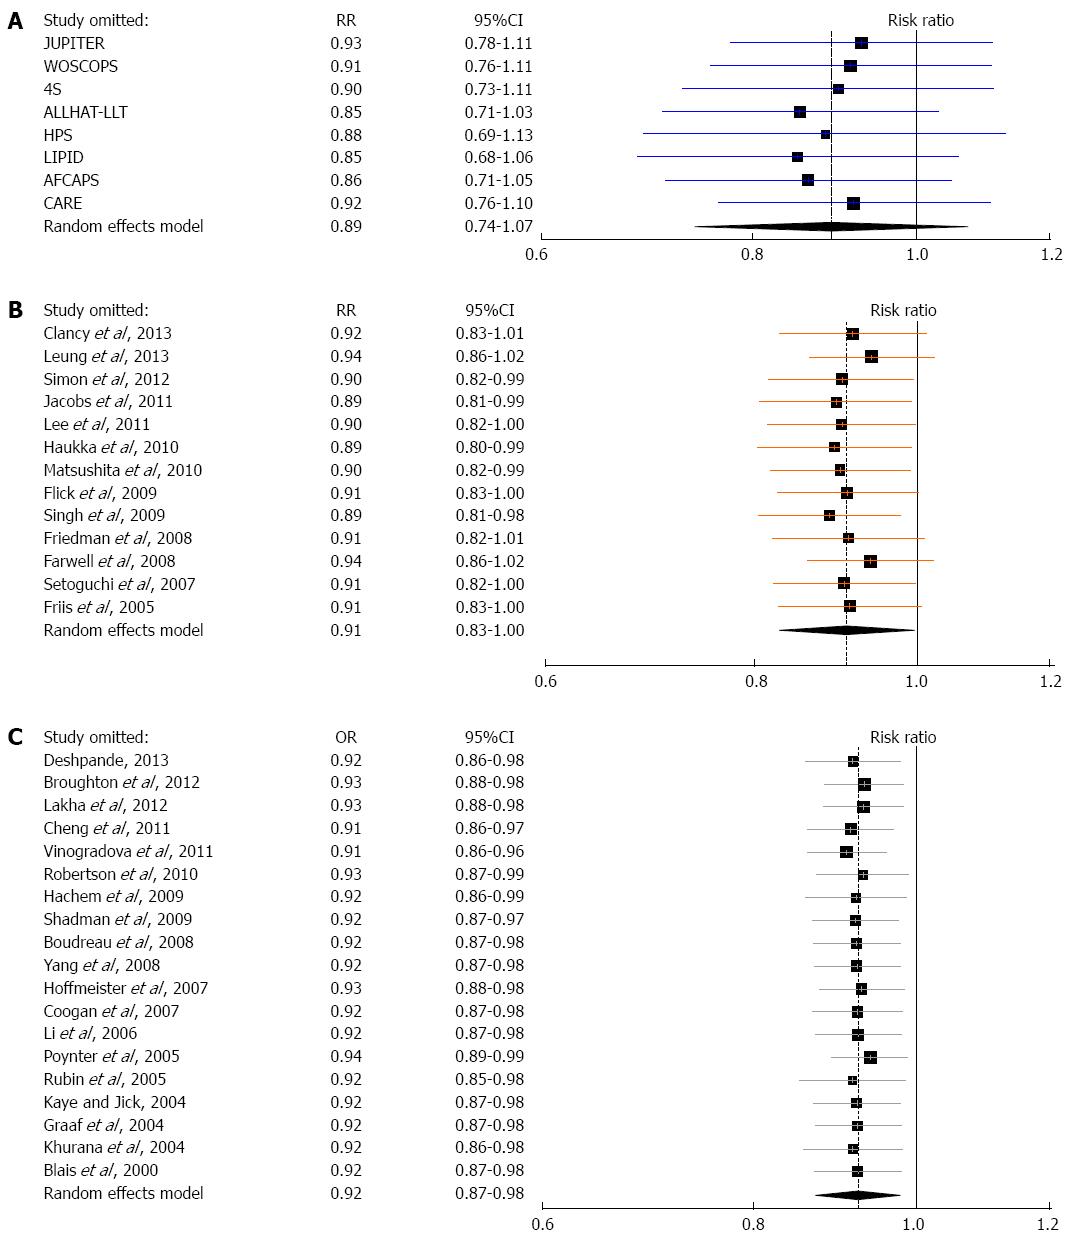
Figure 5 ‘‘Leave-one-out” sensitivity analysis for the three meta-analyses: pooled estimates are from random-effects models with one study omitted at a time.
A: Randomized controlled trials, B: Cohort studies, C: Case-control studies.
- Citation: Lytras T, Nikolopoulos G, Bonovas S. Statins and the risk of colorectal cancer: An updated systematic review and meta-analysis of 40 studies. World J Gastroenterol 2014; 20(7): 1858-1870
- URL: https://www.wjgnet.com/1007-9327/full/v20/i7/1858.htm
- DOI: https://dx.doi.org/10.3748/wjg.v20.i7.1858


