Copyright
©2014 Baishideng Publishing Group Inc.
World J Gastroenterol. Dec 21, 2014; 20(47): 17914-17923
Published online Dec 21, 2014. doi: 10.3748/wjg.v20.i47.17914
Published online Dec 21, 2014. doi: 10.3748/wjg.v20.i47.17914
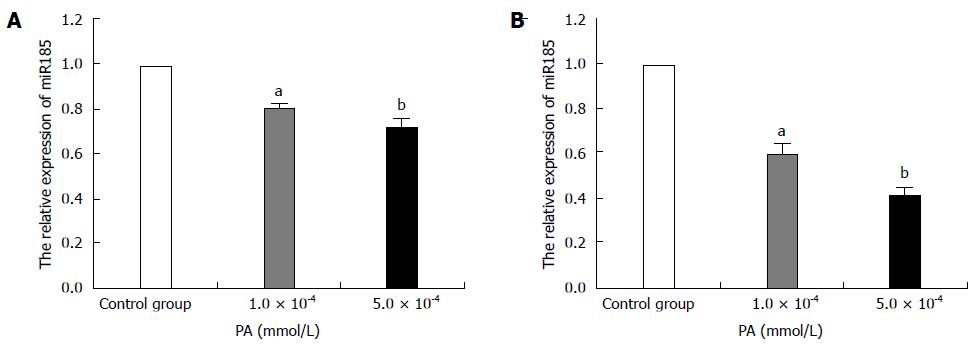
Figure 1 MicroRNA-185 expression levels in palmitic acid-treated HepG2 cells.
HepG2 cells were treated with 1.0 × 10⁻⁴ or 5.0 × 10⁻⁴ mmol/L PA; qRT-PCR detected microRNA-185 (miR-185) levels after 24-h (A) or 48-h (B) incubation. RNU6-2 was used as an internal control for miR-185. Data are mean ± SEM from three separate experiments. aP < 0.05, bP < 0.01 vs the normal control group. PA: Palmitic acid; qRT-PCR: Quantitative reverse transcription-polymerase chain reaction.
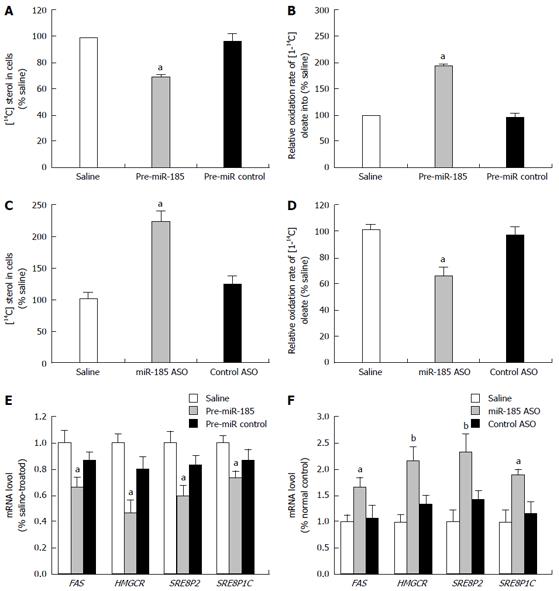
Figure 2 Effect of miR-185 on lipid metabolism in HepG2 cells.
HepG2 cells were transfected with pre-miR-185 or anti-miR-185 (an antisense oligonucleotide against miR-185), and fatty acid oxidation and sterol synthesis rates were determined. A: The sterol synthesis rate was determined by the amount of [14C] acetate incorporated into HepG2 cell sterols after transfection with pre-miR-185; B: The fatty acid oxidation rate was measured by the oxidation of [1-14C] oleate into 14CO2 after transfection with pre-miR-185; C: Sterol synthesis rates in HepG2 cells after transfection with miR-185 inhibitors; D: Fatty acid oxidation rates in HepG2 cells after transfection with miR-185 inhibitors; E: Quantitative reverse transcription-PCR was used to assess the mRNA levels of key lipid metabolism-associated genes in HepG2 cells after overexpression of miR-185; F: mRNA levels of lipid metabolism-associated genes after miR-185 inhibition. Data are mean ± SEM from three separate experiments. aP < 0.05, bP < 0.01 vs the normal control group. miR-185: microRNA-185; ASO: Antisense oligonucleotide; SREBP-1C: Sterol-regulatory element-binding proteins 1C; SREBP-2: Sterol-regulatory element-binding proteins 2; HMGCR: 3-hydroxy-3-methylglutaryl-CoA reductase.
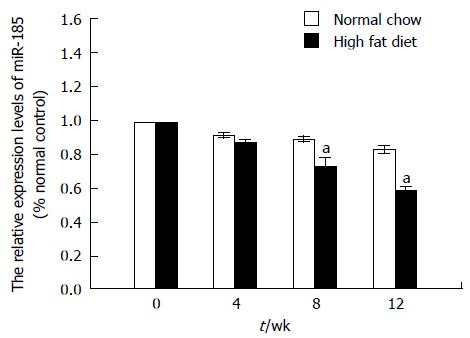
Figure 3 MicroRNA-185 expression levels in C57BL/6J mice fed a high fat diet.
C57BL/6J mice were fed a normal chow or a high fat diet for 12 wk and liver tissues were harvested at 4, 8, and 12 wk. The miR-185 levels were determined by quantitative reverse transcription-PCR (n = 10). Data are mean ± SEM from three separate experiments. aP < 0.05 vs the normal control group. miR-185: microRNA-185.
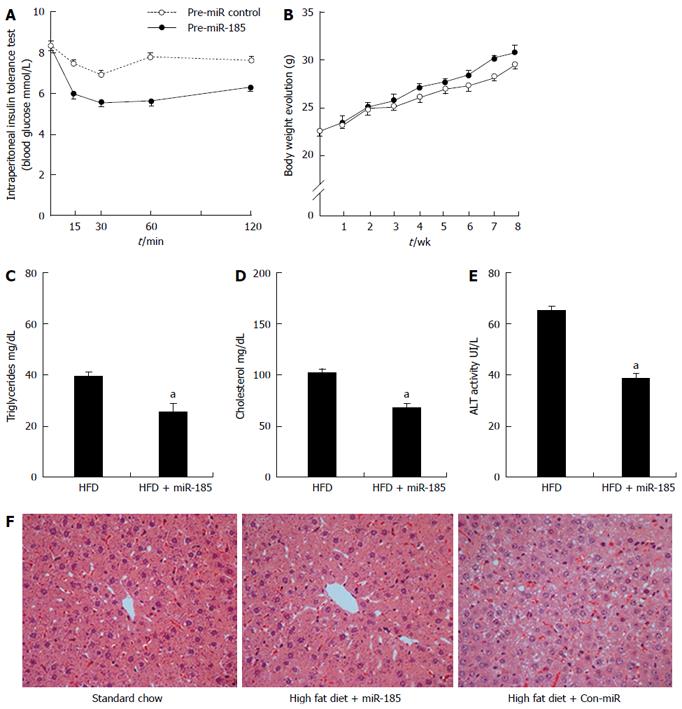
Figure 4 Overexpression of microRNA-185 improves insulin sensitivity and reduces liver steatosis.
Eight-week-old male C57BL/6 mice were fed a high-fat diet for 12 wk. One half of the mice (n = 10) were injected with miR-185 (20 mg/kg body weight) and the control group (n = 10) received injections of control microRNA for 8 wk. A: ITT was performed after the last injection, and mice were submitted to 8 h fasting before intraperitoneal administration of insulin; B: Body weights were recorded weekly during the treatment period; C-E: Triglycerides, cholesterol and alanine aminotransferase levels were assessed after the last injection; F: At the end of the treatment, liver sections were stained by haematoxylin and eosin stain to assess lipid accumulation (magnification × 400). Where applicable, data are mean ± SEM from three separate experiments, n = 10, aP < 0.05 vs the normal control group. HFD: High-fat diet.
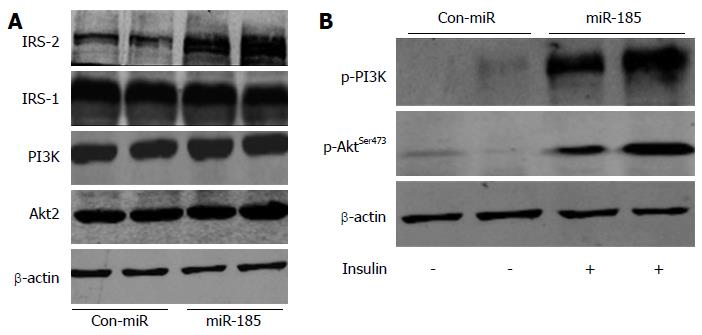
Figure 5 MicroRNA-185 regulates the insulin signalling pathway in HepG2 cells.
A: The HepG2 cells were transfected with pre-miR-185 or pre-miR control and, after 48 h, the protein expression levels of insulin receptor substrate (IRS)-1, IRS-2, phosphatidylinositide 3-kinase (PI3K) and Akt2 were detected by Western blot; B: Effect of miR-185 on Akt2 and PI3K phosphorylation. miR-185: microRNA-185.
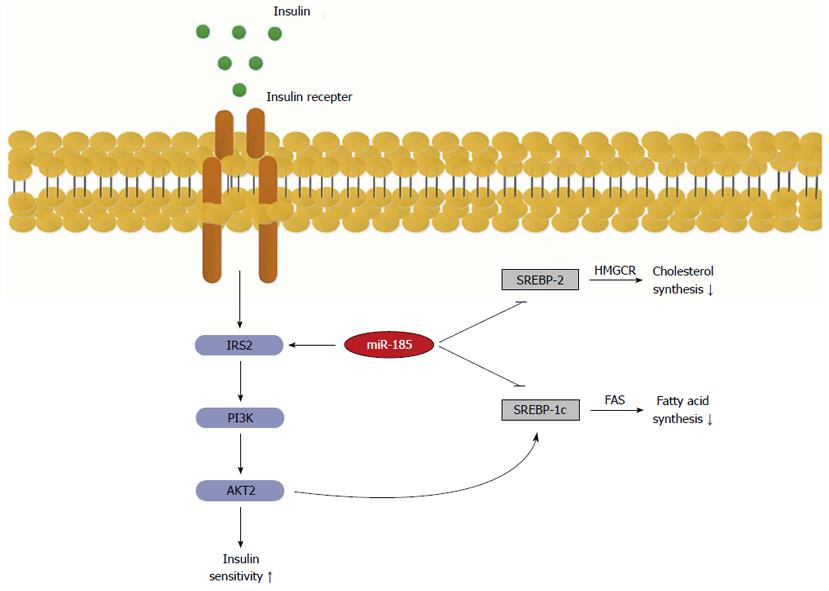
Figure 6 Role of microRNA-185 in the regulation of insulin signalling transduction and lipid metabolism.
MicroRNA-185 up-regulates the key effector insulin receptor substrate-2 (IRS-2), which in turn activates the phosphatidylinositide 3-kinase/Akt2 signalling that increases insulin sensitivity. On the other hand, miR-185 represses SREBP-1c and 2, which ultimately results in decreased lipid synthesis. SREBP-1C: Sterol-regulatory element-binding proteins 1C; SREBP-2: Sterol-regulatory element-binding proteins 2; FAS: Fatty acid synthase.
- Citation: Wang XC, Zhan XR, Li XY, Yu JJ, Liu XM. MicroRNA-185 regulates expression of lipid metabolism genes and improves insulin sensitivity in mice with non-alcoholic fatty liver disease. World J Gastroenterol 2014; 20(47): 17914-17923
- URL: https://www.wjgnet.com/1007-9327/full/v20/i47/17914.htm
- DOI: https://dx.doi.org/10.3748/wjg.v20.i47.17914


