©2014 Baishideng Publishing Group Inc.
World J Gastroenterol. Sep 14, 2014; 20(34): 12283-12291
Published online Sep 14, 2014. doi: 10.3748/wjg.v20.i34.12283
Published online Sep 14, 2014. doi: 10.3748/wjg.v20.i34.12283
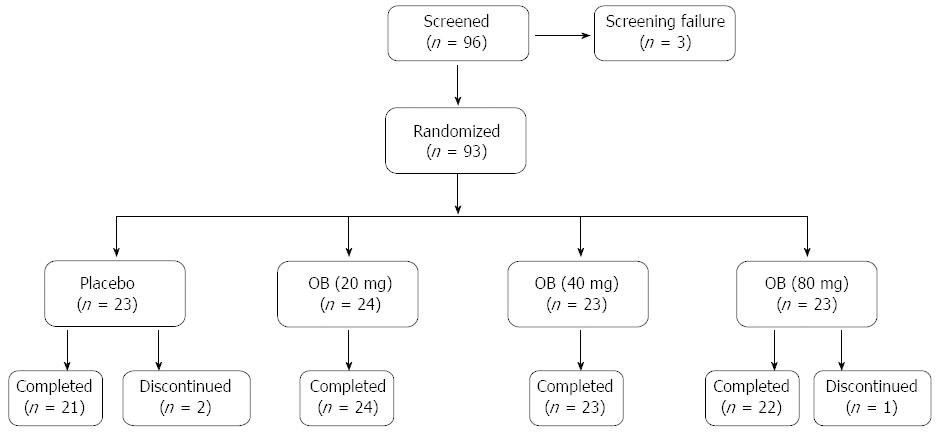
Figure 1 Patient disposition.
OB: Otilonium bromide.
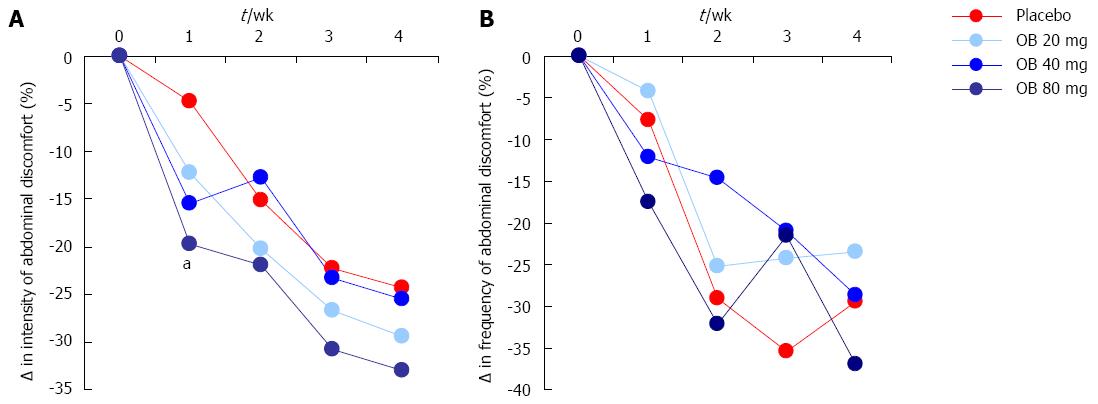
Figure 2 Effect of otilonium bromide (20, 40, 80 mg) and placebo on the intensity (A) and frequency (B) of abdominal discomfort, bloating or pain.
Data are presented as % change from baseline values. Asterix denotes level of statistical significance (aP < 0.05) for placebo vs 80 mg otilonium bromide at 1 wk.
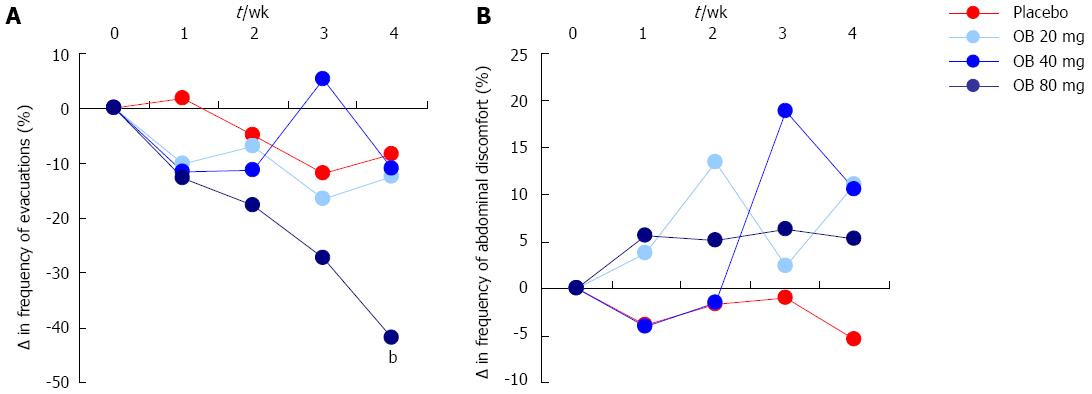
Figure 3 Effect of otilonium bromide (20, 40, 80 mg) and placebo on the frequency of evacuations (A) and the presence of mucus in stool, incomplete evacuation or difficulty of evacuation (B).
Data are presented as % change from baseline values. Asterix denotes level of statistical significance (bP < 0.01) for placebo vs 80 mg OB at 4 wk.
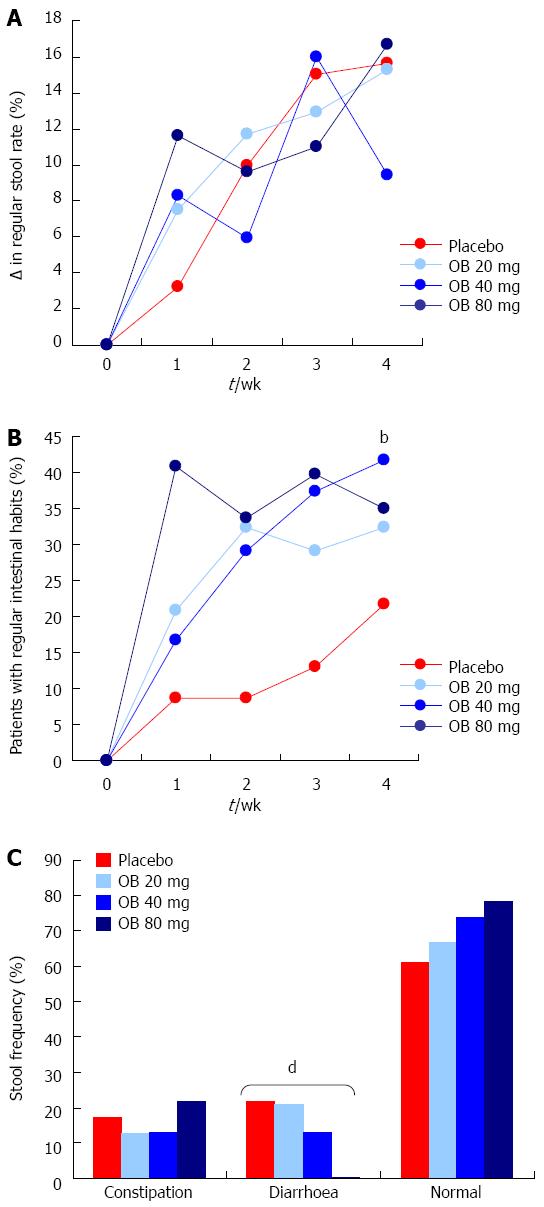
Figure 4 Effect of otilonium bromide (20, 40, 80 mg) and placebo on change in regular stool rate (A), regular intestinal habits (B) and frequency of stool type (C).
Data are presented as % change from baseline values (A + B) or % patients (C). Asterix denotes level of statistical significance (bP < 0.01) for placebo vs 40 mg otilonium bromide at 4 wk (B) and a dose dependent reduction in frequency of diarrhoea (dP < 0.001) (C).
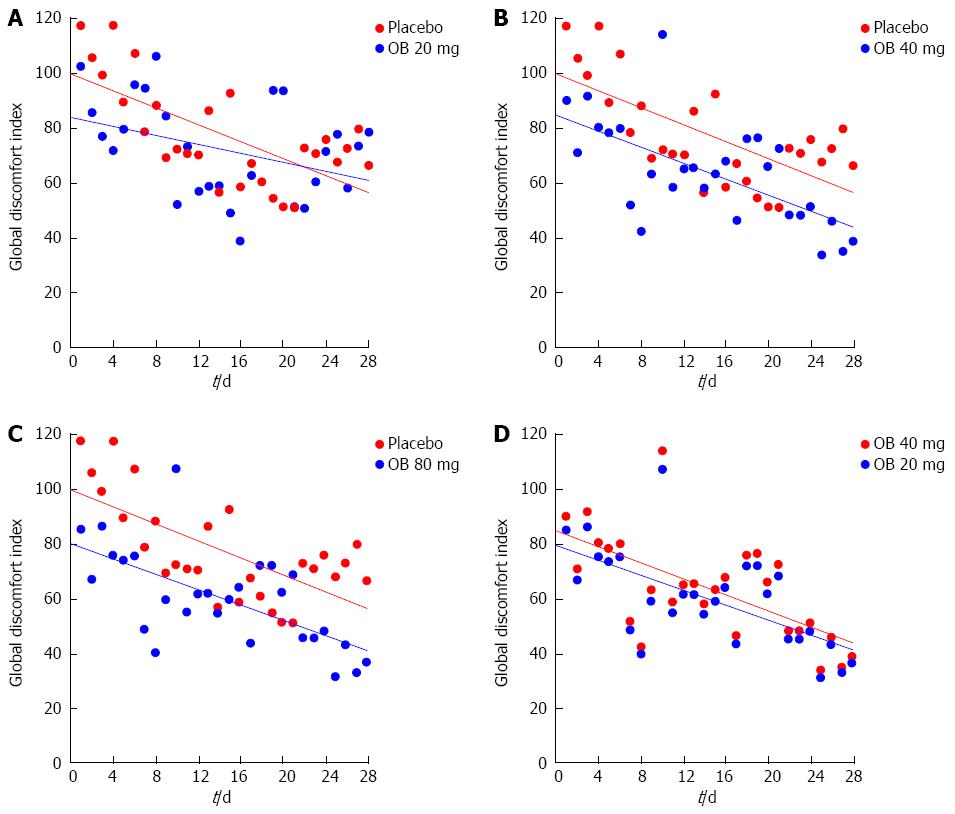
Figure 5 Effect of otilonium bromide (20, 40, 80 mg) and placebo on global discomfort index (A, B, C, D).
Data are presented by scatterplot for individual global discomfort index values. Mean values over time are represented by trendlines for different treatment.
- Citation: Chmielewska-Wilkoń D, Reggiardo G, Egan CG. Otilonium bromide in irritable bowel syndrome: A dose-ranging randomized double-blind placebo-controlled trial. World J Gastroenterol 2014; 20(34): 12283-12291
- URL: https://www.wjgnet.com/1007-9327/full/v20/i34/12283.htm
- DOI: https://dx.doi.org/10.3748/wjg.v20.i34.12283


