©2014 Baishideng Publishing Group Inc.
World J Gastroenterol. Jul 14, 2014; 20(26): 8525-8534
Published online Jul 14, 2014. doi: 10.3748/wjg.v20.i26.8525
Published online Jul 14, 2014. doi: 10.3748/wjg.v20.i26.8525
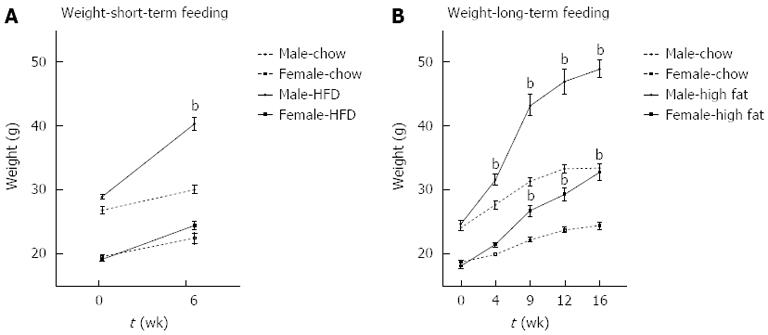
Figure 1 Effect of high fat diet feeding on body weight.
Male and female C57Bl/6 mice were fed with either a high fat diet (HFD) supplemented with sucrose and fructose in the drinking water, or with a control chow diet for 6 or 16 wk. Body weights were recorded during both the short-term (6 wk, A), and long-term (16 wk, B) feedings. bP < 0.01 vs chow fed controls, n = 10/group.
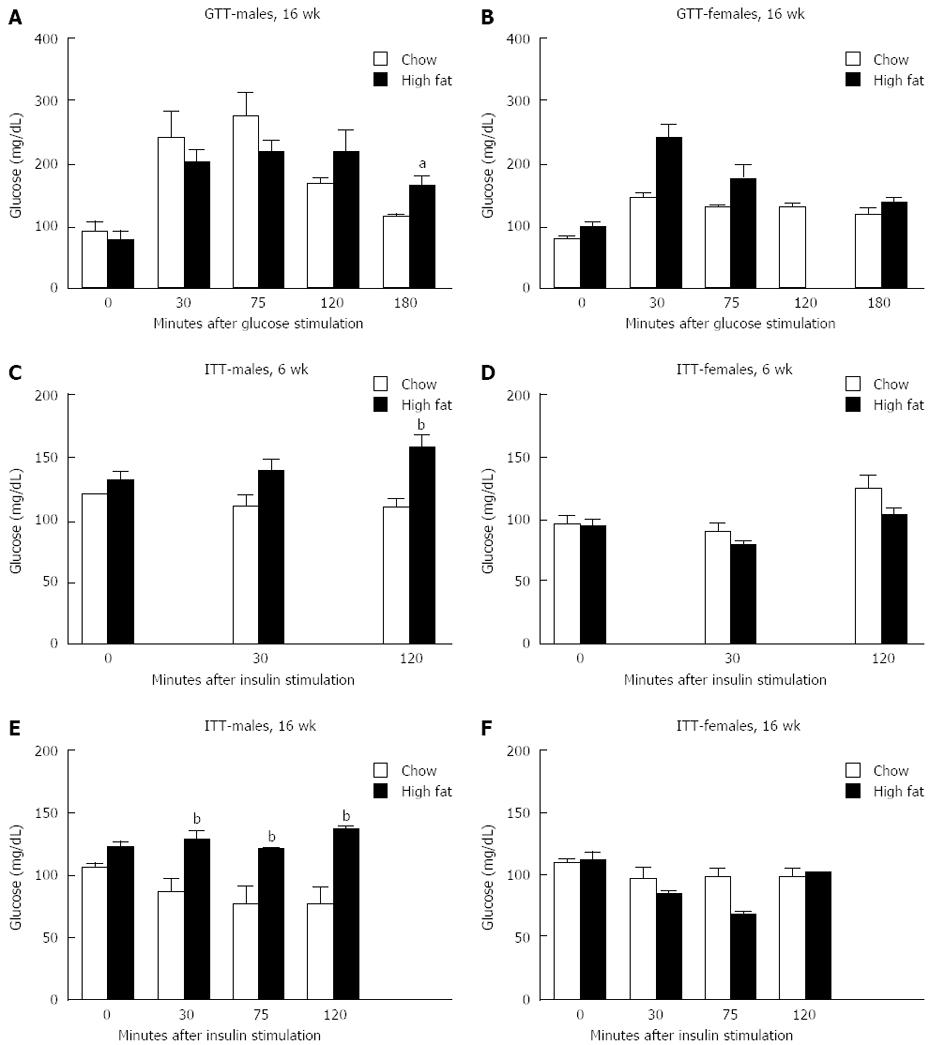
Figure 2 High fat diet results in insulin resistance in male mice after 16 wk high fat diet feeding.
Male and female mice were fed with either high fat diet (HFD) or chow diet for 6 or 16 wk. Glucose tolerance test (GTT) was performed: glucose levels were measured 0, 30, 75, 120 and 180 min after ip glucose injection in male (A) and female mice (B) fed with HFD for 16 wk. Insulin tolerance test (ITT) was performed: glucose levels were measured 0, 30, 75 and 120 min after ip insulin injection in male and female mice fed with HFD for 6 wk (C and D, respectively) or 16 wk (E and F, respectively). aP < 0.05, bP < 0.01 vs chow fed controls, n = 5/group, P = 0.03 vs chow fed controls in GTT-males, 16 wk, n = 5/group.
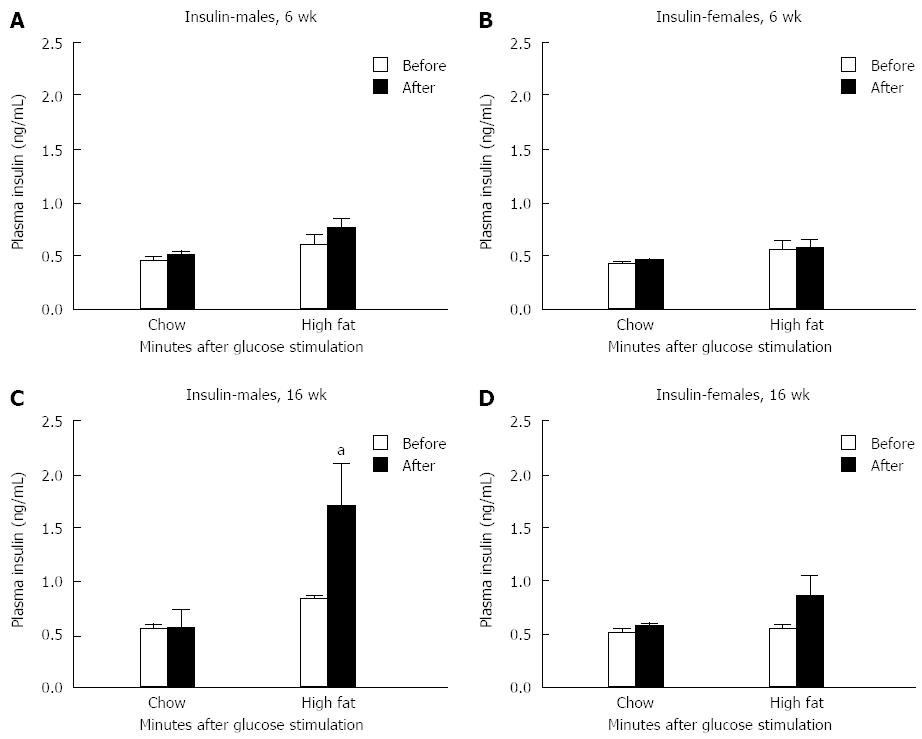
Figure 3 Elevated insulin levels in male mice after long-term high fat diet feeding.
Insulin levels were measured using enzyme-linked immunosorbent assay prior to and 30 min after glucose stimulation in males (A) and females (B), following a short-term high fat diet (HFD) feeding, and males (C) and females (D), after a long-term HFD feeding. aP < 0.05 vs chow fed controls, n = 5/group.
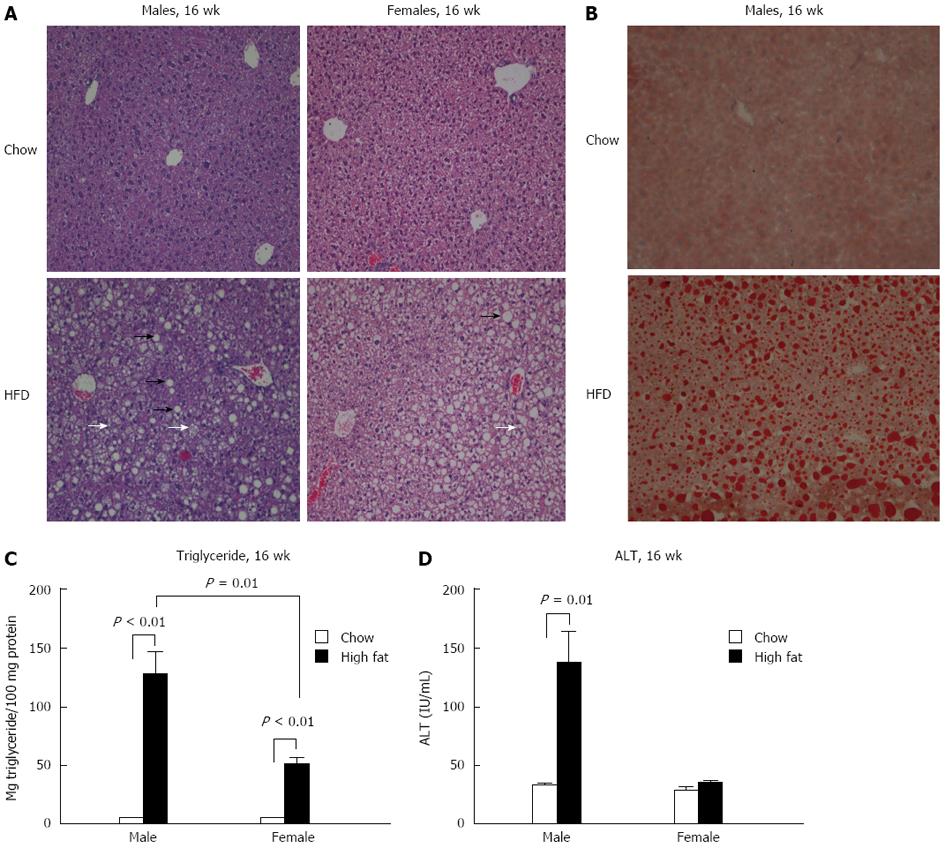
Figure 4 Long-term high fat diet feeding results in steatohepatitis in male mice, and steatosis in female mice.
Male and female mice were fed with either high fat diet (HFD) or control chow diet for 6 or 16 wk. A, B: Liver tissue was subjected to HE of male (A) and Oil-Red-O staining (B) (× 100). Dark arrow: Macrovesicular steatosis, white arrow: Microvesicular steatosis. One representative slide from n = 5/group is shown; C, D: Liver triglyceride levels (C) were evaluated in mice fed with HFD for 16 wk. Serum alanine aminotransferase (ALT) levels were measured after long-term HFD feeding (D).
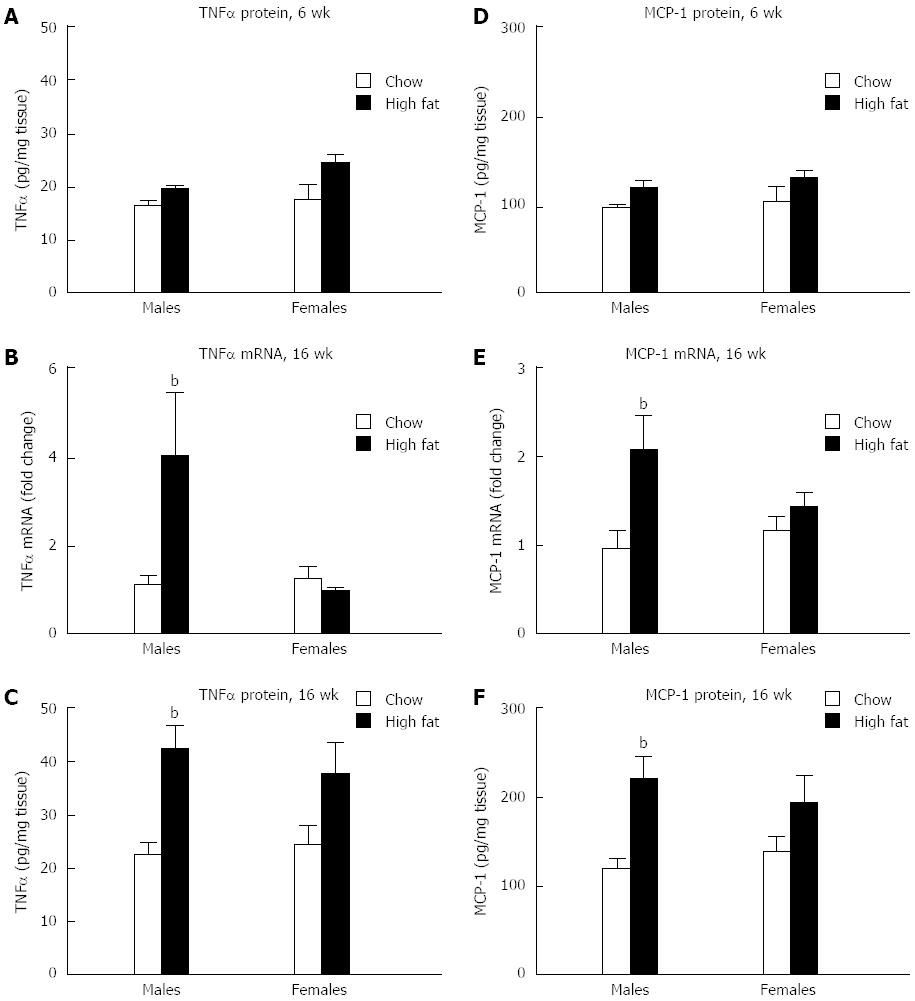
Figure 5 Long-term high fat diet results in hepatic inflammation in male mice.
A-C: Liver tumor necrosis factor-α (TNFα) protein levels (A) were evaluated in the short-term feeding levels of TNFα in the liver were analyzed at the mRNA (B) and protein (C) level after a long-term feeding; D-F: Monocyte chemoattractant protein 1 (MCP-1) protein levels (D) were evaluated in the short-term feeding. Levels of MCP-1 in the liver were analyzed at the mRNA (E) and protein (F) level after a long-term feeding. bP < 0.01 vs chow fed controls, n = 10/group.
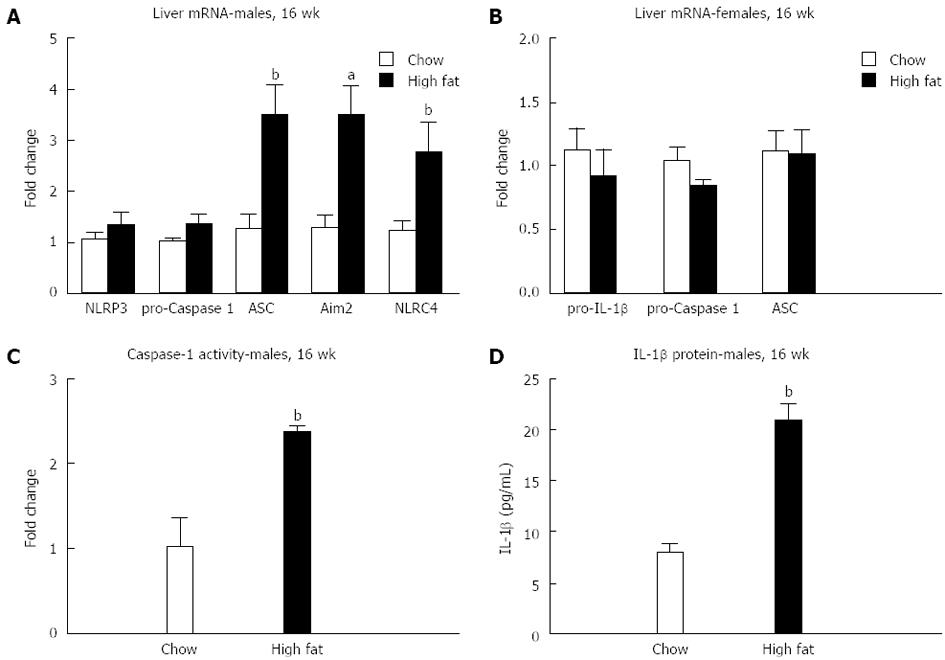
Figure 6 Long-term high fat diet induced inflammasome upregulation and activation in male mice.
Hepatic mRNA expression of the inflammasome components NOD-like receptors3 (NLRP3), caspase-1, adaptor molecule, Aim2, and NLRC4 were measured using real-time quantitative polymerase chain reaction in male (A) and female (B) mice after a long-term high fat diet. The functional activity of the inflammasome was evaluated by measurements of caspase-1 activity (C) and total nterleukin (IL)-1β protein (D) levels, in the liver. aP < 0.05, bP < 0.01 vs chow fed controls, n = 10/group.
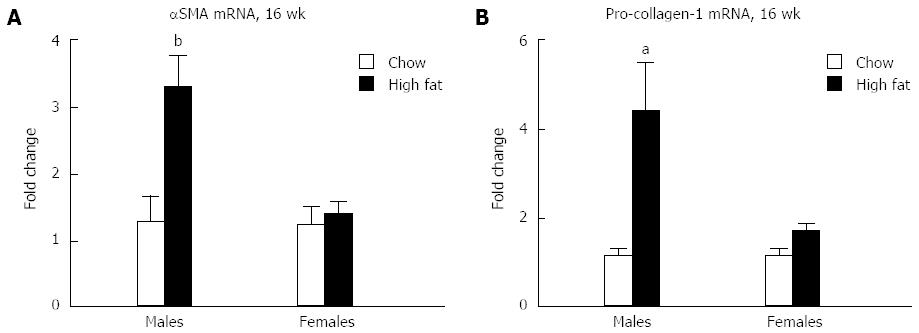
Figure 7 Long-term male mice fed a high fat diet display increase in fibrotic markers.
Hepatic mRNA expression of α-smooth muscle actin (αSMA) (A) and pro-collagen-1 (B), were measured using real-time quantitative polymerase chain reaction in male mice following a long-term high fat diet feeding. aP < 0.05, bP < 0.01 vs chow fed controls, n = 10/group.
- Citation: Ganz M, Csak T, Szabo G. High fat diet feeding results in gender specific steatohepatitis and inflammasome activation. World J Gastroenterol 2014; 20(26): 8525-8534
- URL: https://www.wjgnet.com/1007-9327/full/v20/i26/8525.htm
- DOI: https://dx.doi.org/10.3748/wjg.v20.i26.8525


