Copyright
©2014 Baishideng Publishing Group Inc.
World J Gastroenterol. May 28, 2014; 20(20): 6314-6321
Published online May 28, 2014. doi: 10.3748/wjg.v20.i20.6314
Published online May 28, 2014. doi: 10.3748/wjg.v20.i20.6314
Figure 1 Heat map showing differentially expressed (fold change > 2) 659 lncRNAs (A) and 690 mRNAs (B) between hepatocellular carcinoma samples and non-tumor samples (greater than 2.
0-fold change, P < 0.05). Each row represents one non-coding/coding RNA, and each column represents a tissue sample. The relative expression values are depicted according to the color scale. Red indicates upregulation; green indicates downregulation. Ca: Cancer samples; Nt: Matched non-tumor samples.
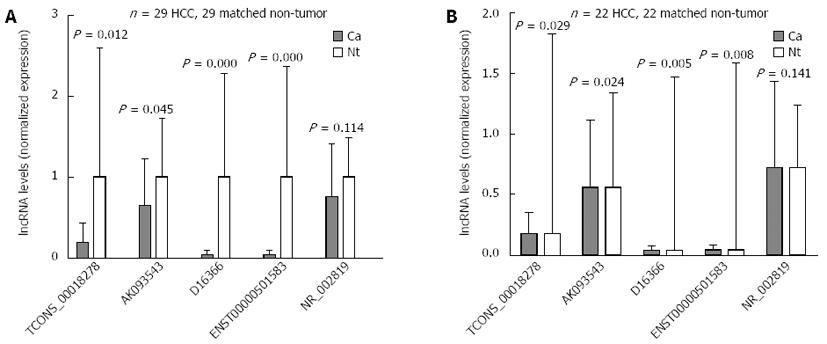
Figure 2 Validation of the differential expression of five lncRNAs using quantitative real-time reverse transcription polymerase chain reaction.
A: In 29 paired hepatocellular carcinoma and non-tumor samples; B: In 22 paired hepatitis B virus-related hepatocellular carcinoma and non-tumor samples. Ca: Cancer samples; Nt: Matched non-tumor samples; HCC: Hepatocellular carcinoma; lncRNAs: Long non-coding RNAs.
- Citation: Liu WT, Lu X, Tang GH, Ren JJ, Liao WJ, Ge PL, Huang JF. LncRNAs expression signatures of hepatocellular carcinoma revealed by microarray. World J Gastroenterol 2014; 20(20): 6314-6321
- URL: https://www.wjgnet.com/1007-9327/full/v20/i20/6314.htm
- DOI: https://dx.doi.org/10.3748/wjg.v20.i20.6314


