Copyright
©2014 Baishideng Publishing Group Co.
World J Gastroenterol. Jan 14, 2014; 20(2): 518-524
Published online Jan 14, 2014. doi: 10.3748/wjg.v20.i2.518
Published online Jan 14, 2014. doi: 10.3748/wjg.v20.i2.518
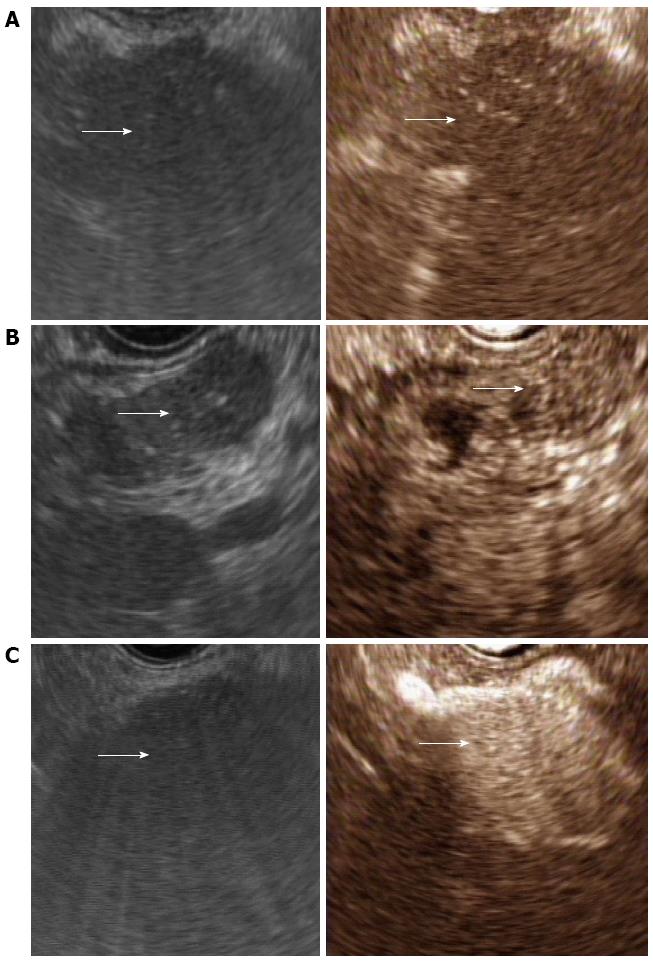
Figure 1 Conventional endoscopic ultrasonography (left) and contrast-enhanced harmonic endoscopic ultrasonography (right).
These pictures showed a typical example of a hypoenhancement pattern (A), an isoenhancement pattern (B), and hyperenhancement pattern (C).
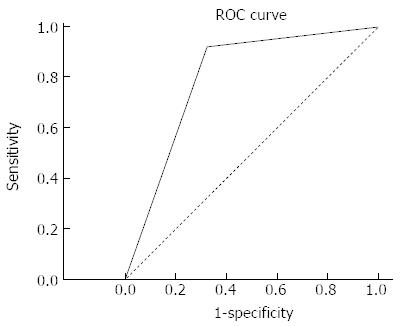
Figure 2 Receiver operating characteristic curve.
Hypoenhancement pattern, determined by contrast-enhanced harmonic endoscopic ultrasonography, was calculated to diagnose pancreatic adenocarcinoma with the area under the receiver operating characteristic (ROC) curve of 0.799.
- Citation: Park JS, Kim HK, Bang BW, Kim SG, Jeong S, Lee DH. Effectiveness of contrast-enhanced harmonic endoscopic ultrasound for the evaluation of solid pancreatic masses. World J Gastroenterol 2014; 20(2): 518-524
- URL: https://www.wjgnet.com/1007-9327/full/v20/i2/518.htm
- DOI: https://dx.doi.org/10.3748/wjg.v20.i2.518


