©2014 Baishideng Publishing Group Co.
World J Gastroenterol. Apr 7, 2014; 20(13): 3640-3648
Published online Apr 7, 2014. doi: 10.3748/wjg.v20.i13.3640
Published online Apr 7, 2014. doi: 10.3748/wjg.v20.i13.3640
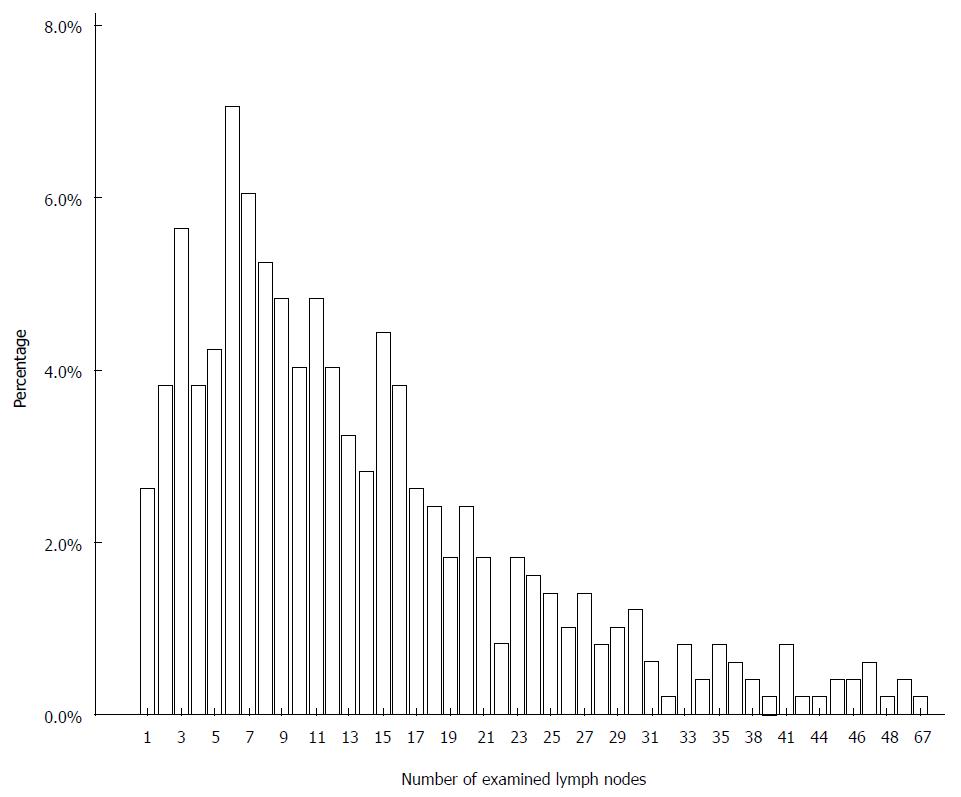
Figure 1 Percentage of the number of examined lymph nodes for the entire cohort.
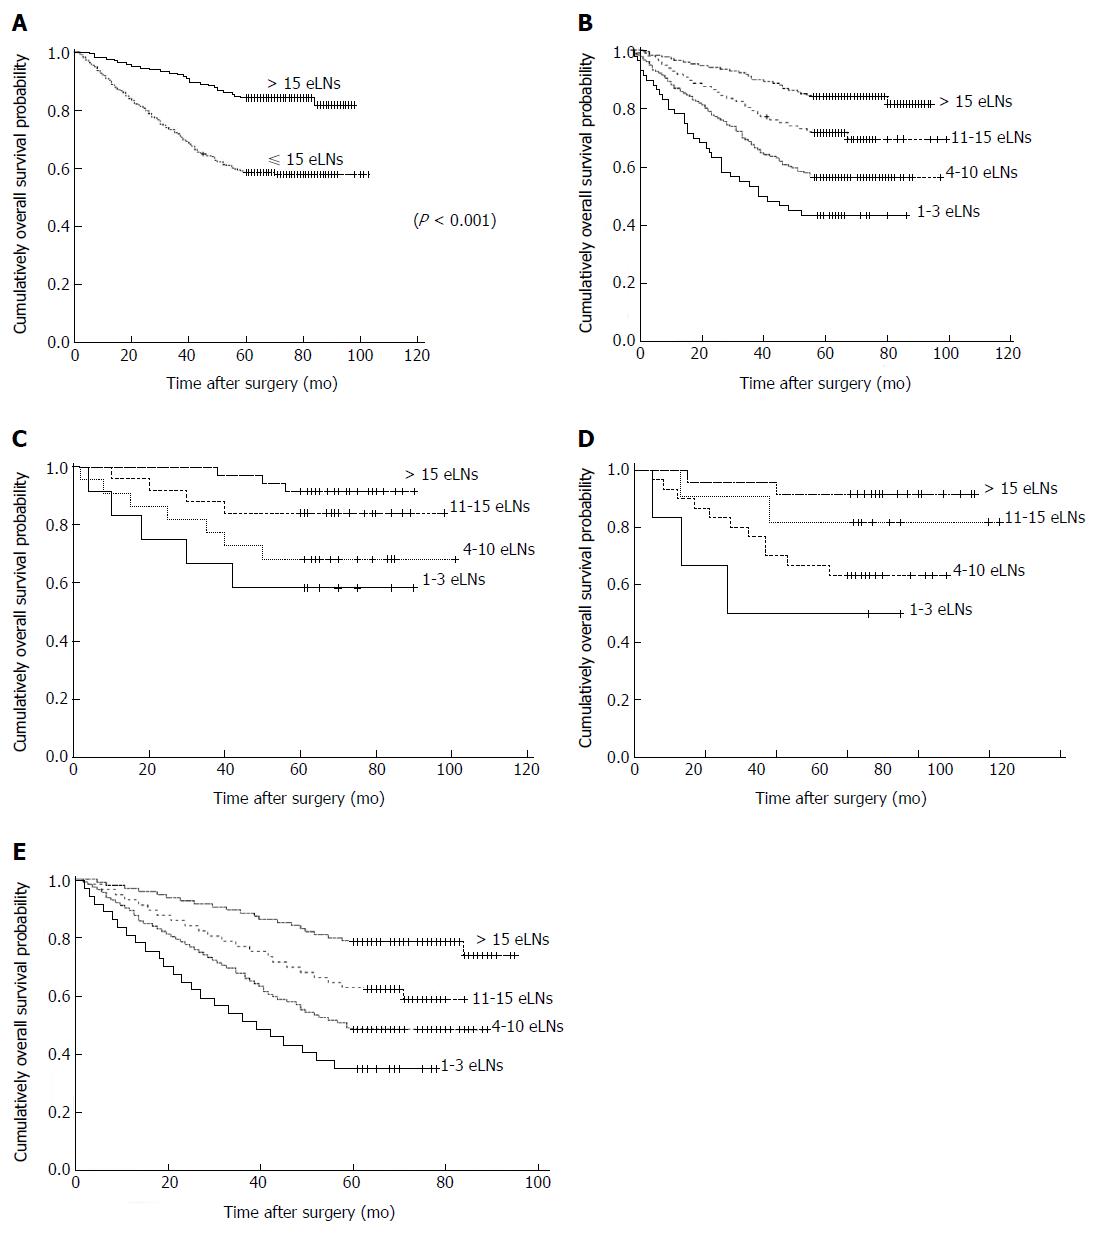
Figure 2 Survival curves.
A: For ≤ 15 eLNs group and > 15 eLNs group in total node-negative gastric cancer patients; B: For 4 categories in total node-negative gastric cancer patients according to the number of examined negative lymph nodes (P < 0.001); C: For 4 categories in pathological T2 patients according to the number of examined negative lymph nodes (P = 0.022); D: For 4 categories in pathological T3 patients according to the number of examined negative lymph nodes (P = 0.033); E: For 4 categories in pathological T4 patients according to the number of examined negative lymph nodes (P < 0.001). eLNs: Examined lymph nodes.
- Citation: Jiao XG, Deng JY, Zhang RP, Wu LL, Wang L, Liu HG, Hao XS, Liang H. Prognostic value of number of examined lymph nodes in patients with node-negative gastric cancer. World J Gastroenterol 2014; 20(13): 3640-3648
- URL: https://www.wjgnet.com/1007-9327/full/v20/i13/3640.htm
- DOI: https://dx.doi.org/10.3748/wjg.v20.i13.3640


