Copyright
©2013 Baishideng Publishing Group Co.
World J Gastroenterol. Mar 7, 2013; 19(9): 1396-1404
Published online Mar 7, 2013. doi: 10.3748/wjg.v19.i9.1396
Published online Mar 7, 2013. doi: 10.3748/wjg.v19.i9.1396
Figure 1 Experimental design.
In all groups, total warm hepatic ischemia was induced for 20 min by clamping the portal triad. A total of 1 × 10⁸ fluorescence-labeled platelets, approximately 1% of all circulating platelets in the recipient rat, were injected via the left carotid artery 5 min before intravital microscopy (IVM).
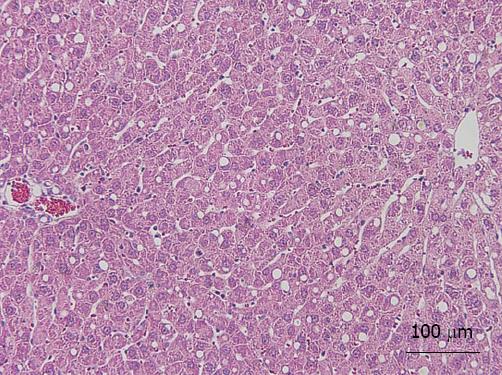
Figure 2 Mild steatotic liver model.
Hematoxylin and eosin staining of liver specimens after 2 wk of a choline deficient diet demonstrated that between 10% and 20% of hepatocytes had deposition of microvesicular lipid droplets.
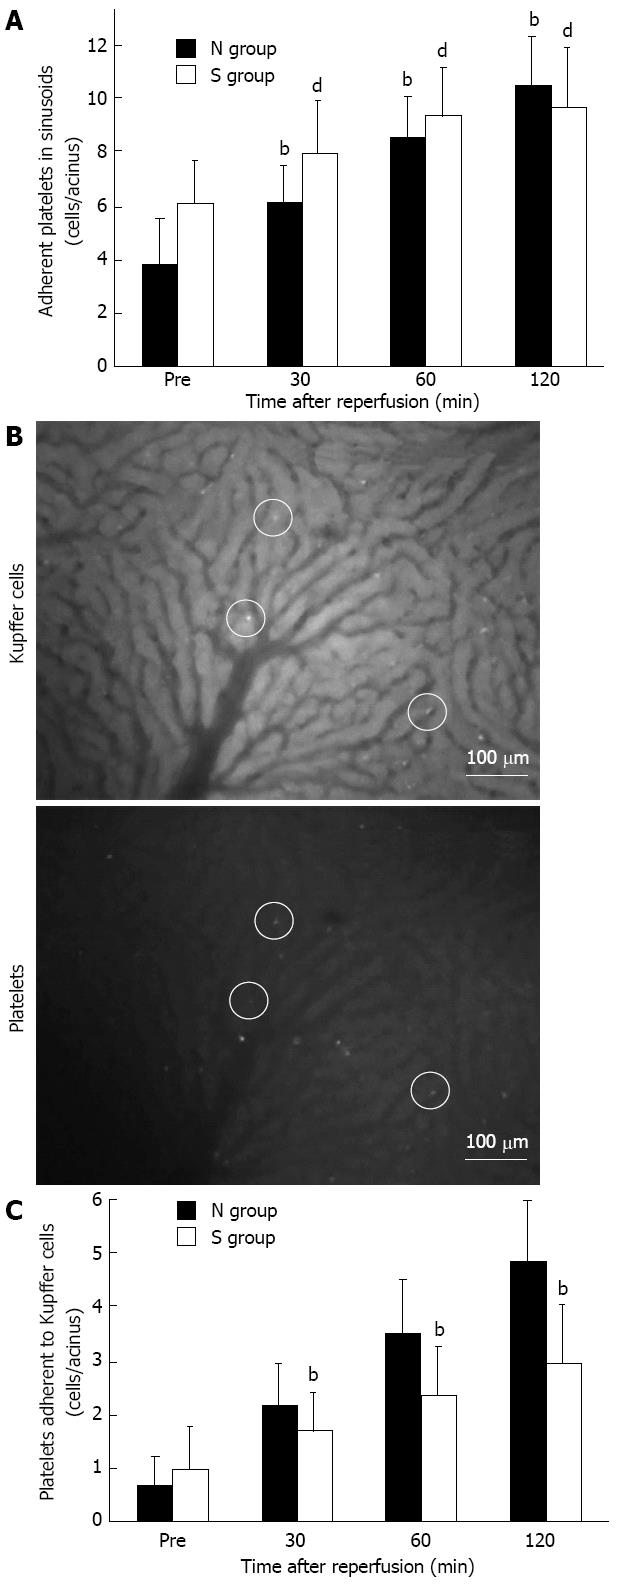
Figure 3 Platelets and Kupffer cell dynamics in sinusoids.
A: The number of adherent platelets in sinusoids increased along with the reperfusion time in both groups. Shown as mean ± SD; n = 6. bP < 0.01 vs pre-ischemia in the normal liver (N) group, dP < 0.01 vs pre-ischemia in the mild steatotic liver (S) group; B: Video images of Kupffer cells (KCs) and platelets in acini 30 min after reperfusion. The field is approximately 0.2 mm2. The upper figure shows the acini of fluorescently stained KCs, and in the lower figure, the acini of fluorescently stained platelets. White circles indicate adhesion to KCs and platelets in the same place; C: In the S group, the number of adherent platelets adhering to KCs was significantly less than in the N group at 30 min after reperfusion and concomitant with the duration of reperfusion. Shown as mean ± SD; n = 6; bP < 0.01 vs the N group.
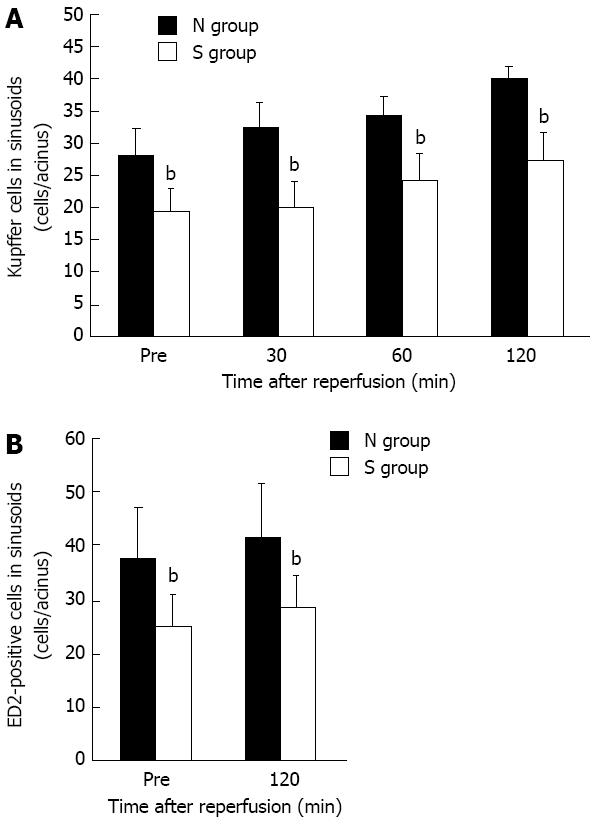
Figure 4 The number of Kupffer cells in sinusoids (mean ± SD).
A:The number of Kupffer cells in sinusoids observed in the intravital microscopy system was decreased significantly in the mild steatotic liver (S) group compared to the normal liver (N) group at any point in time before and after ischemia reperfusion. n = 6. bP < 0.01 vs the N group; B: In immunohistochemical staining, the number of ED2-positive cells was significantly less in the S group than in the N group. n = 6. bP < 0.01 vs the N group.
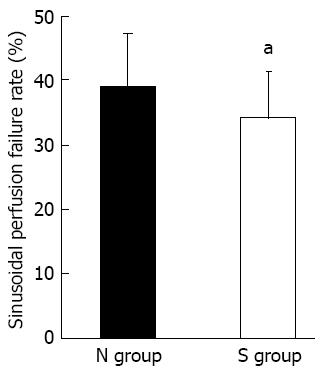
Figure 5 Sinusoidal perfusion failure rate (mean ± SD).
The sinusoidal perfusion failure rate after 120 min of reperfusion was lower in the mild steatotic liver (S) group than in the normal liver (N) group. n = 6. aP < 0.05 vs the N group.
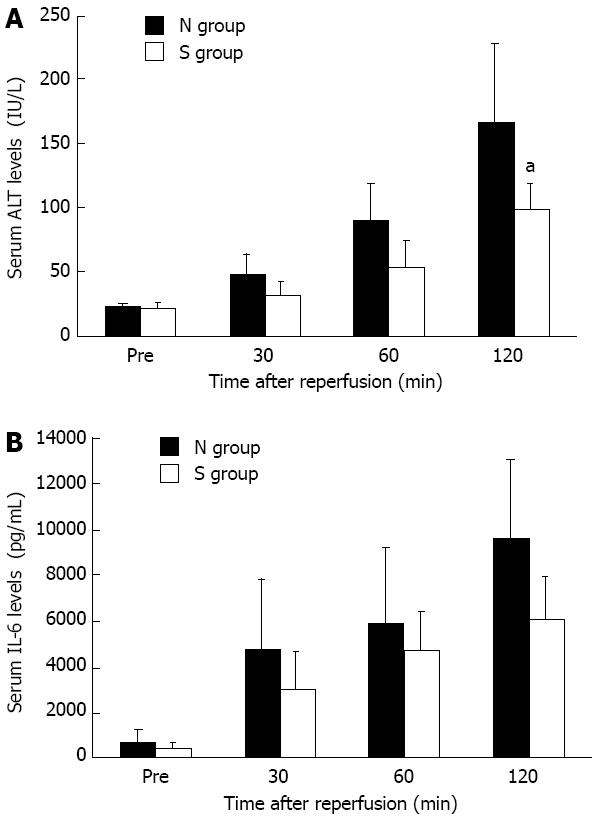
Figure 6 Serum alanine aminotransferase and interleukin-6 levels (mean ± SD).
A: Serum alanine aminotransferase (ALT) levels were significantly lower in the mild steatotic liver (S) group than in the normal liver (N) group at 120 min after reperfusion. n = 6. aP < 0.05 vs the N group; B: The concentration of serum interleukin-6 (IL-6) tended to be lower in the S group compared with in the N group but there was no significant difference (after 120 min of reperfusion, P = 0.09 vs the N group). n = 6.
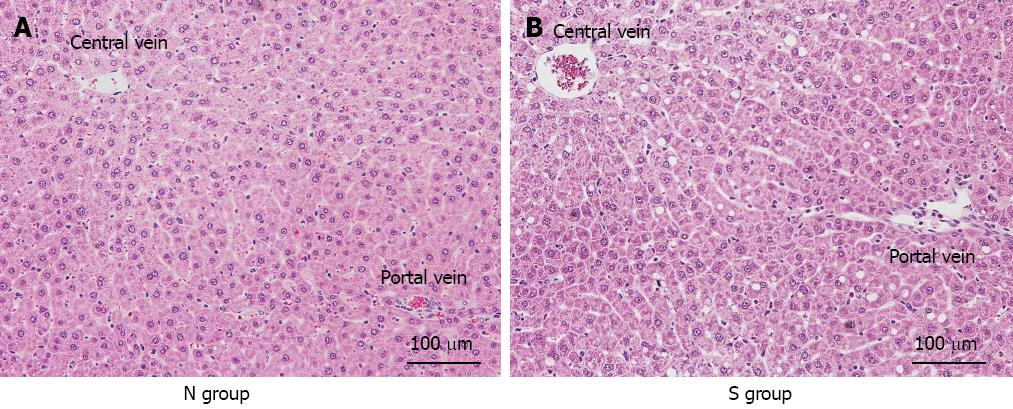
Figure 7 Histological findings after 120 min of reperfusion.
In the normal liver (N) group, hepatocyte structure was strongly impaired compared with the mild steatotic liver (S) group, and sinusoidal narrowing was observed.
- Citation: Ogawa K, Kondo T, Tamura T, Matsumura H, Fukunaga K, Oda T, Ohkohchi N. Influence of Kupffer cells and platelets on ischemia-reperfusion injury in mild steatotic liver. World J Gastroenterol 2013; 19(9): 1396-1404
- URL: https://www.wjgnet.com/1007-9327/full/v19/i9/1396.htm
- DOI: https://dx.doi.org/10.3748/wjg.v19.i9.1396


