Copyright
©2013 Baishideng Publishing Group Co.
World J Gastroenterol. Nov 28, 2013; 19(44): 8056-8064
Published online Nov 28, 2013. doi: 10.3748/wjg.v19.i44.8056
Published online Nov 28, 2013. doi: 10.3748/wjg.v19.i44.8056
Figure 1 Schematic overview of the azoxymethane and dextran sulfate sodium model and subsequent image acquisition.
A single azoxymethane (AOM) ip injection was given to 6-wk-old mice (week 1). One week later (week 2), 3% dextran sulfate sodium (DSS) administration was given in the drinking water for 7 d, followed by regular water. The first endoluminal ultrasonic biomicroscopy (eUBM) and colonoscopic images were acquired at week 13, the second acquisition was from weeks 17-20, and the third acquisition was at week 21.
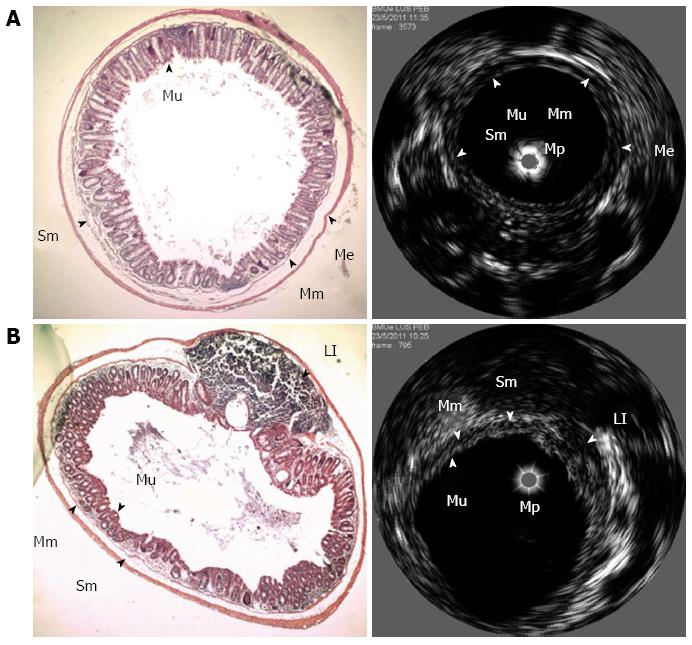
Figure 2 Correlation between endoluminal ultrasonic biomicroscopy and histological images.
A: Endoluminal ultrasonic biomicroscopy (eUBM) (right) and the corresponding hematoxylin and eosin-stained histological section (left, × 40 magnification) obtained from a healthy region of a mouse colon. The eUBM image displays two hyperechoic layers: mucosa (Mu) and submucosa (Sm) and two hypoechoic layers: muscularis mucosae (Mm) and muscularis externa (Me). The ultrasound catheter mini-probe (Mp) is at the center of the lumen; B: eUBM (right) and the corresponding hematoxylin and eosin-stained histological section (left, × 40 magnification) obtained from a mouse colon containing a lymphoid infiltrate in the colonic wall. The eUBM image displays the mucosa (Mu), muscularis mucosae (Mm) and submucosa layer (Sm). The lymphoid infiltrate (LI) lesion is seen as a hypoechoic region underneath the mucosa. The ultrasound catheter mini-probe (Mp) is at the center. All layers identified in the ultrasound images are well correlated with the histological images from the same site.
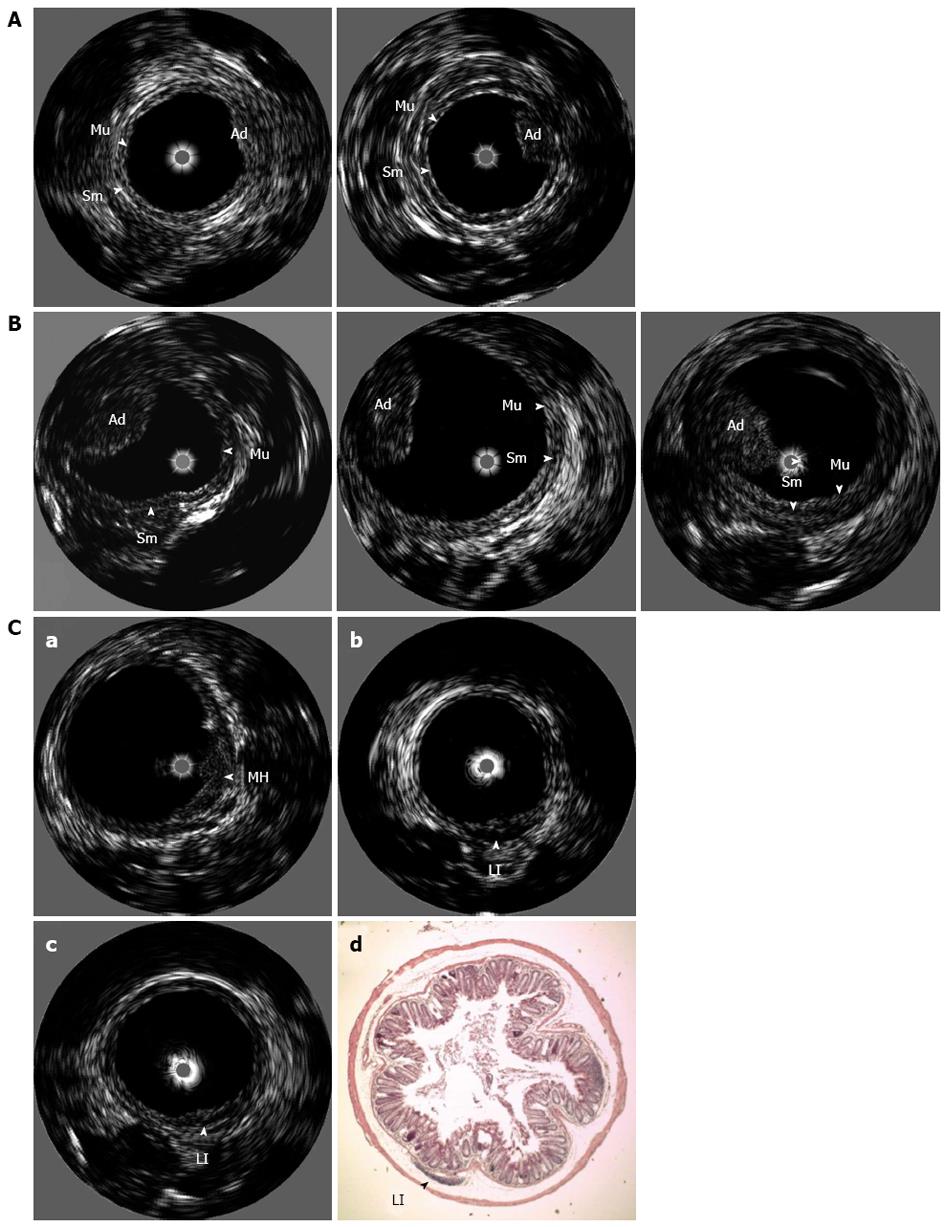
Figure 3 Endoluminal ultrasonic biomicroscopy images.
A: Show increase in tumor volume. Endoluminal ultrasonic biomicroscopy (eUBM) colon images acquired at the first (left) and second (right) time-points from azoxymethane (AOM)-dextran sulfate sodium (DSS)-treated mice. The volume of the pedunculated adenoma (Ad) increased between the first and second eUBM examinations; B: Show no alteration in tumor volume. eUBM colon images acquired at the first (left), second (middle) and third (right) time-points from AOM-DSS-treated mice. The lesion observed is a pedunculated tumor. Images show that the tumor volume is unchanged during the observation period; C: Show reduction in lesion size. eUBM colon images acquired at the first (a), second (b) and third (c) time-points from AOM-DSS-treated mice. The lesion observed at the first eUBM image is a mucosa hyperplasia (MH) with ulceration at the top. In the subsequent eUBM image, the MH has decreased, and a lymphoid infiltrate (LI) has appeared in the submucosa layer. In the third and last eUBM image, MH and LI have almost completely disappeared, which is confirmed by histological analysis (d, × 40 magnification). Mu: Mucosa; Sm: Submucosa.
- Citation: Soletti RC, Alves KZ, Britto MA, Matos DG, Soldan M, Borges HL, Machado JC. Simultaneous follow-up of mouse colon lesions by colonoscopy and endoluminal ultrasound biomicroscopy. World J Gastroenterol 2013; 19(44): 8056-8064
- URL: https://www.wjgnet.com/1007-9327/full/v19/i44/8056.htm
- DOI: https://dx.doi.org/10.3748/wjg.v19.i44.8056


