Copyright
©2013 Baishideng Publishing Group Co.
World J Gastroenterol. Oct 28, 2013; 19(40): 6919-6927
Published online Oct 28, 2013. doi: 10.3748/wjg.v19.i40.6919
Published online Oct 28, 2013. doi: 10.3748/wjg.v19.i40.6919
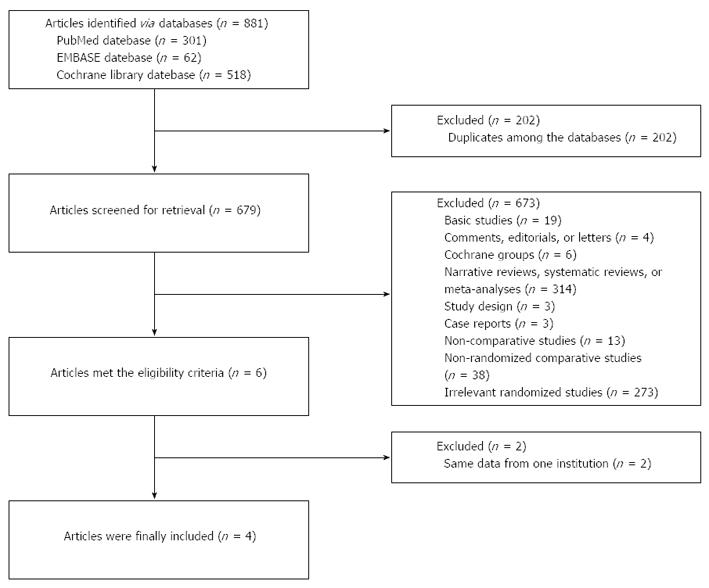
Figure 1 Flowchart of study inclusion.
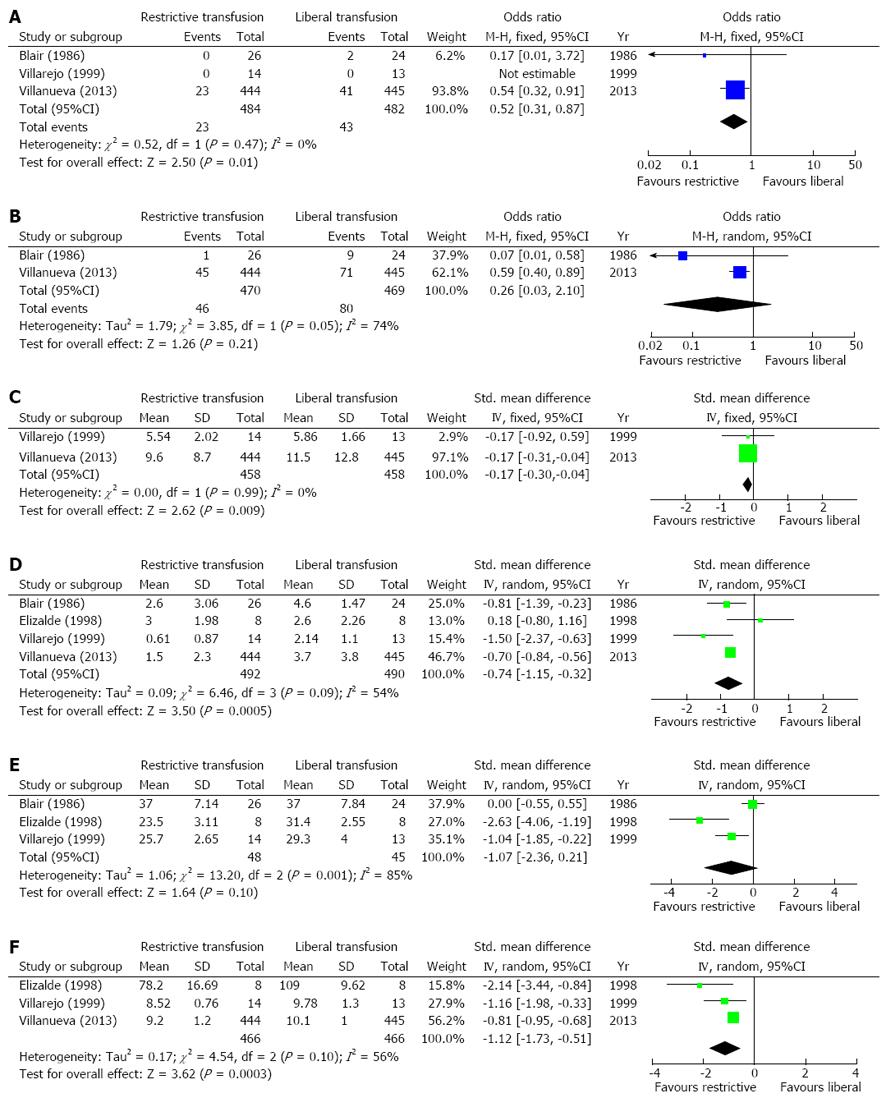
Figure 2 Forest plots comparing the incidence of death (A), incidence of rebleeding (B), length of hospitalization (C), amount of blood transfused (D), and hematocrit (E) and hemoglobin (F) level at discharge or after expansion between patients treated with restrictive and liberal transfusion.
Studies are arranged by publication year.
-
Citation: Wang J, Bao YX, Bai M, Zhang YG, Xu WD, Qi XS. Restrictive
vs liberal transfusion for upper gastrointestinal bleeding: A meta-analysis of randomized controlled trials. World J Gastroenterol 2013; 19(40): 6919-6927 - URL: https://www.wjgnet.com/1007-9327/full/v19/i40/6919.htm
- DOI: https://dx.doi.org/10.3748/wjg.v19.i40.6919


