©2013 Baishideng Publishing Group Co.
World J Gastroenterol. Aug 28, 2013; 19(32): 5347-5356
Published online Aug 28, 2013. doi: 10.3748/wjg.v19.i32.5347
Published online Aug 28, 2013. doi: 10.3748/wjg.v19.i32.5347
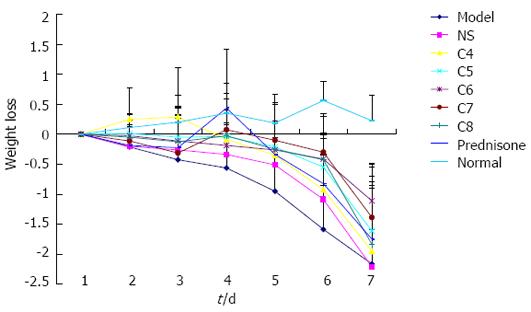
Figure 1 Effects of Lactobacillus acidophilus treatments on colitis-induced body weight loss.
The x-axis shows the mean weight (mean ± SD) recorded for each group on each day of the 7-d study course. NS: Negative-treatment.
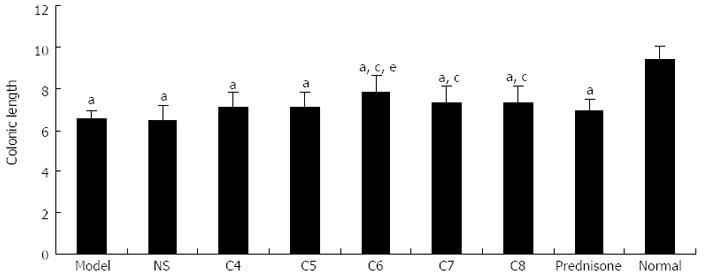
Figure 2 Effects of Lactobacillus acidophilus treatments on colitis-induced changes in colonic length.
aP < 0.05 vs normal control group; cP < 0.05 vs untreated model control group; eP < 0.05 vs negative-treatment (NS) model control group.
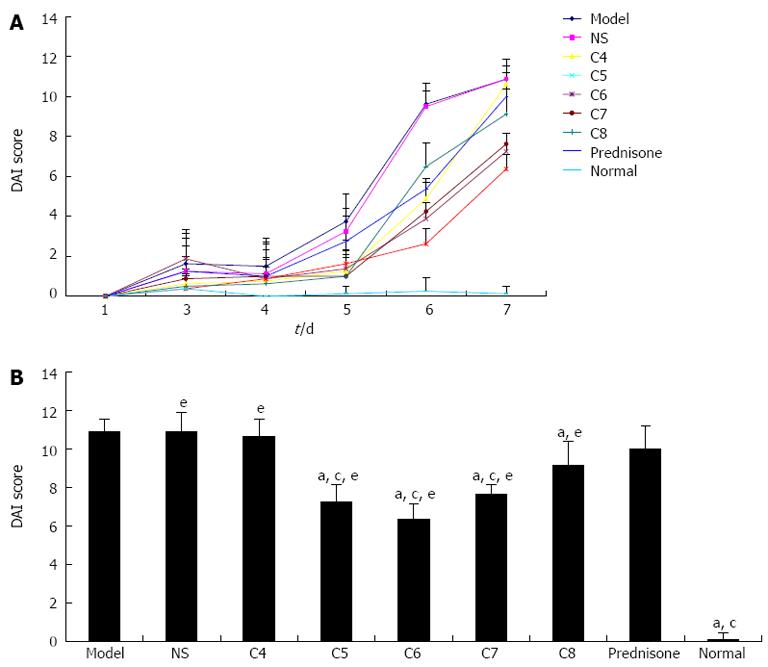
Figure 3 Effects of Lactobacillus acidophilus treatments on colitis-induced changes in disease activity index scores.
Comprehensive evaluation of body weight decrease, fecal properties, and fecal occult blood was carried out by the disease activity index (DAI) scoring system throughout the study course. A: The daily mean ± SD DAI score is plotted for each group; B: Mean ± SD DAI scores on day 7 post-treatment. aP < 0.05 vs untreated model control group; cP < 0.05 vs positive-treatment (prednisone acetate) model control group; eP < 0.05 vs normal control group. NS: Negative-treatment.
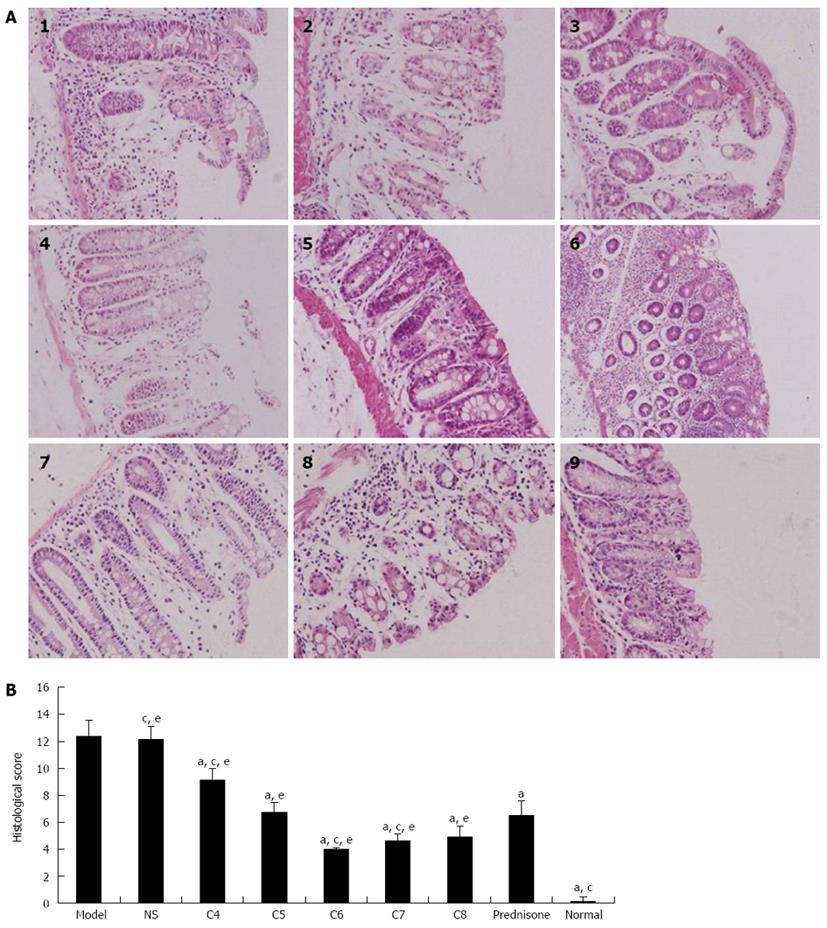
Figure 4 Effects of Lactobacillus acidophilus treatments on colitis-induced changes in intestinal histopathological features.
A: Representative intestinal sections (HE, under light microscope, × 200) are shown. Panel 1: untreated model group, 2: negative-treatment (NS) model control group, 3-7: C4-C8 experimental treatment model groups respectively, 8: positive-treatment (prednisone acetate) model control group, and 9: normal control group; B: Average histopathological scores. aP < 0.05 vs untreated model control group; cP < 0.05 vs positive-treatment (prednisone acetate) model control group; eP < 0.05 vs normal control group.
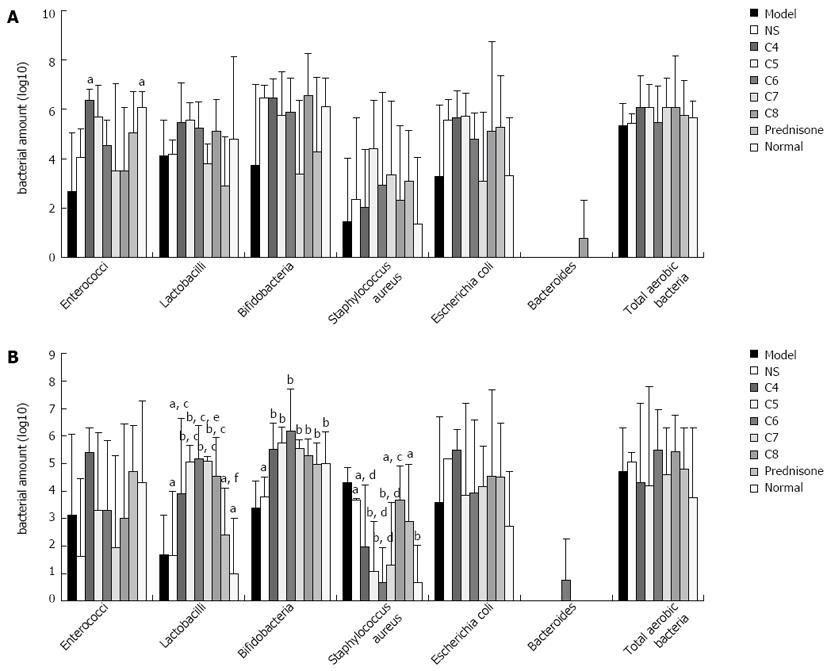
Figure 5 Bacterial profiles of the proximal (A) and distal (B) colon.
Bacteria amount is expressed as the logarithm. aP < 0.05, bP < 0.01 vs untreated model control group; cP < 0.05, dP < 0.01 vs positive-treatment (prednisone acetate) model control group; eP < 0.05, fP < 0.01 vs normal control group. NS: Negative-treatment.
-
Citation: Chen LL, Zou YY, Lu FG, Li FJ, Lian GH. Efficacy profiles for different concentrations of
Lactobacillus acidophilus in experimental colitis. World J Gastroenterol 2013; 19(32): 5347-5356 - URL: https://www.wjgnet.com/1007-9327/full/v19/i32/5347.htm
- DOI: https://dx.doi.org/10.3748/wjg.v19.i32.5347


