Copyright
©2012 Baishideng Publishing Group Co.
World J Gastroenterol. Nov 21, 2012; 18(43): 6226-6234
Published online Nov 21, 2012. doi: 10.3748/wjg.v18.i43.6226
Published online Nov 21, 2012. doi: 10.3748/wjg.v18.i43.6226
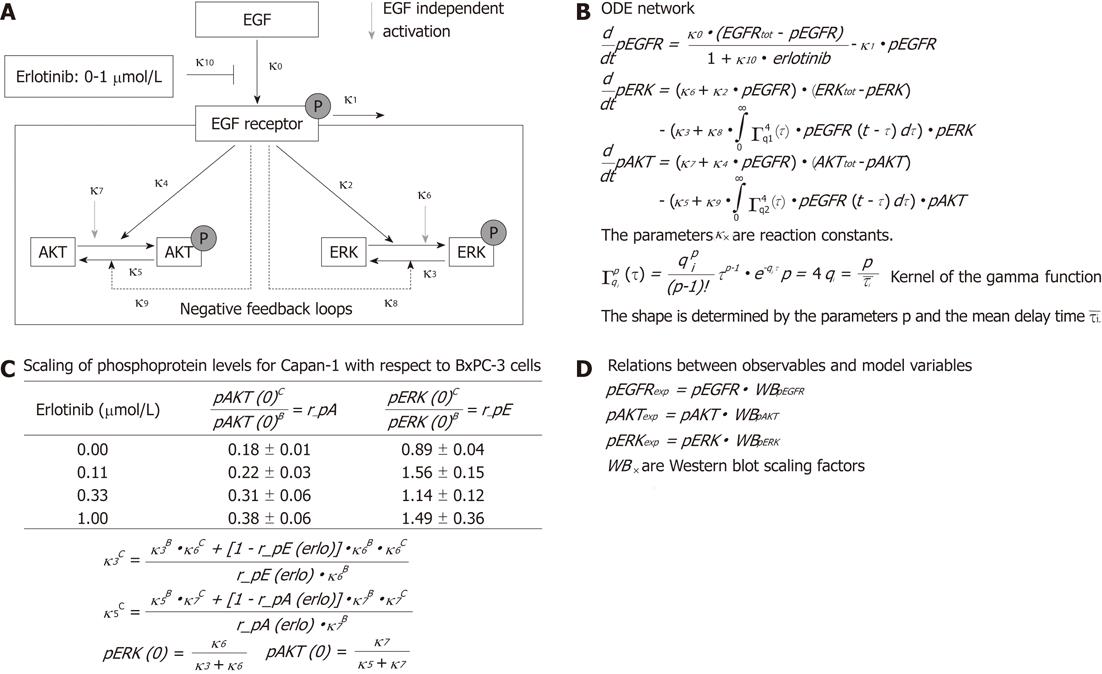
Figure 1 Flow chart of epidermal growth factor signal transduction and the ordinary differential equation network.
A: Simplified reaction network. Solid black arrows show epidermal growth factor-dependent processes, whereas grey arrows represent basal phosphorylation. Two epidermal growth factor receptor (EGFR)-dependent negative feedback loops are shown by black dotted lines; B: Translation of the reaction network into an ordinary differential equation (ODE) model describing EGFR-mediated signal transduction; C: Ratio of basal levels of phosphorylated protein kinase B (AKT) (r_pA) and extracellular signal-regulated kinase (ERK) (r_pE) in BxPC-3 (superscript B) and Capan-1 (superscript C) cells. These calculations are implemented in the mathematical model; D: Equations describe relations between observables (fitted to experimental data) and model variables. For further description see “mathematical model” in the “materials and methods” section. EGF: Epidermal growth factor; pAKT: Phospho-AKT; ERK: Extracellular signal-regulated kinase; pERK: Phospho-ERK; WB: Western blot.
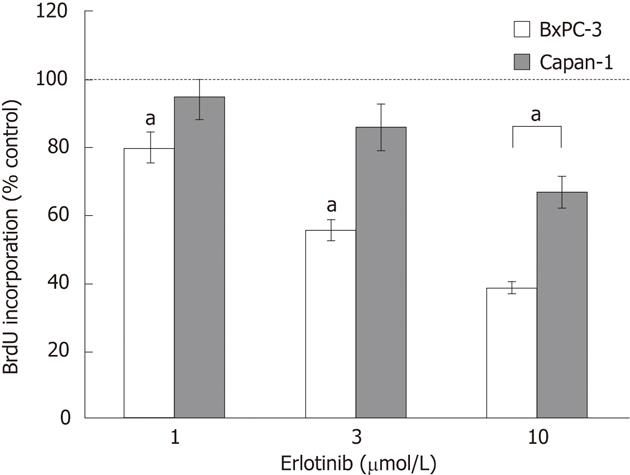
Figure 2 Effects of erlotinib on the proliferation of pancreatic cancer cell lines.
BxPC-3 and Capan-1 cells growing in 96 half-area well plates were starved from serum and treated with different doses of erlotinib for a total of 32 h. DNA synthesis was measured by 5-bromo-2'-deoxyuridine (BrdU) incorporation over the last 8 h. Data represent mean ± SE (n = 6). aP < 0.05 between control cultures without erlotinib.
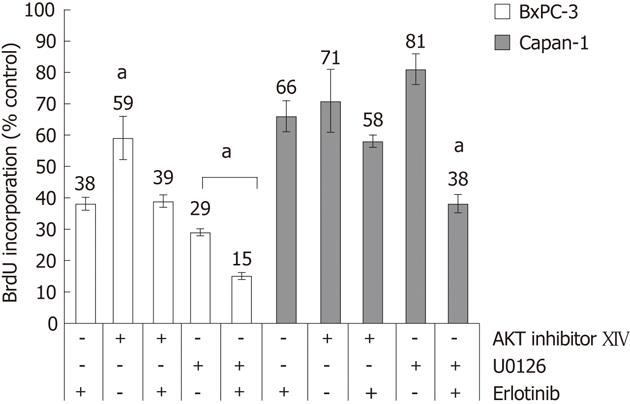
Figure 3 Effects of U0126, protein kinase B inhibitor XIV and erlotinib on proliferation of BxPC-3 and Capan-1 cells.
The cells were seeded in 96 half-area well plates, starved from serum and treated with protein kinase B (AKT) inhibitor XIV or mitogen-activated protein kinase kinase inhibitor U0126 in the presence or absence of erlotinib for a total of 32 h. DNA synthesis was measured by 5-bromo-2'-deoxyuridine (BrdU) incorporation over the last 8 h. Data represent mean ± SE (n = 6), aP < 0.05 vs cultures with erlotinib only. P < 0.05 between all samples vs untreated cells (not indicated in the figure).
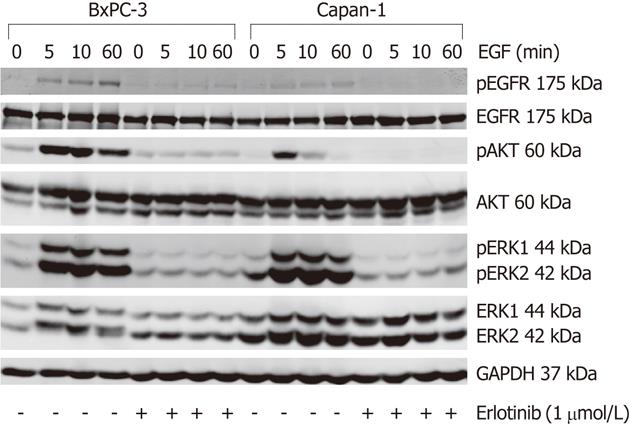
Figure 4 Effects of erlotinib on epidermal growth factor receptor signal transduction in BxPC-3 and Capan-1 cells.
Serum-starved pancreatic cancer cells were preincubated with erlotinib at 1 μmol/L for 4 h, as indicated, before they were stimulated with 10 ng/mL epidermal growth factor (EGF) for the indicated times. Protein extracts from equal amounts of cells were subjected to Western blot analysis. Phospho-epidermal growth factor receptor (pEGFR), phospho-protein kinase B (pAKT), phospho-extracellular signal-regulated kinase 1/2 (pERK1/2), their respective total proteins and glyceraldehyde-3-phosphate dehydrogenase (GAPDH) were detected using fluorescein (IRDye®)-labeled secondary antibodies. One representative Western blot is shown. For mean values of independent experiments, please refer to Figure 5. AKT: Protein kinase B; ERK: Extracellular signal-regulated kinase; EGFR: Epidermal growth factor receptor.
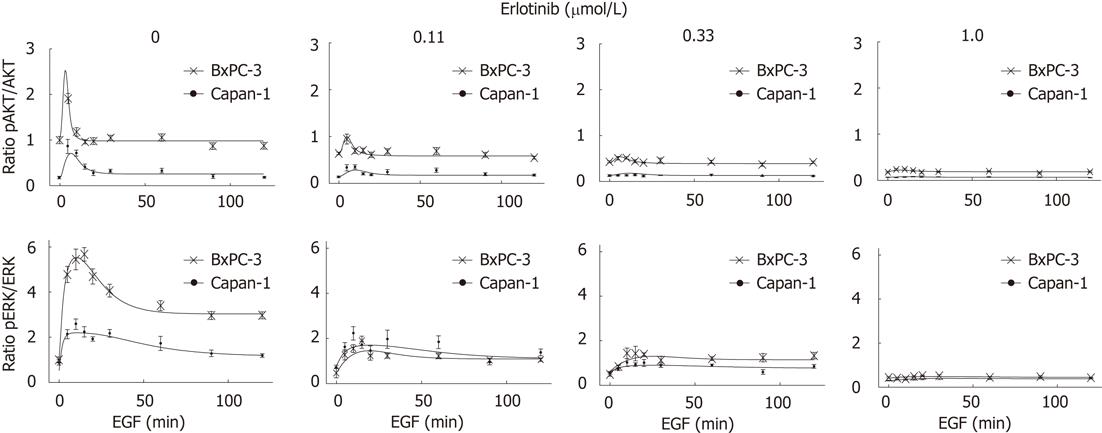
Figure 5 Simulations of the mathematical model reflect the experimental time series.
Serum-starved BxPC-3 and Capan-1 cells were preincubated with different doses of erlotinib for 4 h and stimulated with 10 ng/mL epidermal growth factor (EGF) for the indicated times. Cellular lysates were analyzed by quantitative immunoblotting, and phospho-protein kinase B (pAKT), protein kinase B (AKT), phospho-extracellular signal-regulated kinase (pERK), extracellular signal-regulated kinase (ERK) and glyceraldehyde-3-phosphate dehydrogenase levels were determined. Plotted are experimental results (BxPC-3 and Capan-1); mean ± SE of at least six independent experiments and model simulation (lines) for BxPC-3 and Capan-1 cells for different times of EGF stimulation. All data were scaled to the untreated BxPC-3 cells (absence of EGF and erlotinib), where the ratio was set as 1.
Figure 6 Mathematical prediction of phospho-extracellular signal-regulated kinase and phospho-protein kinase B levels after erlotinib treatment.
Serum-starved BxPC-3 and Capan-1 cells were preincubated with different doses of erlotinib for 4 h and stimulated with 10 ng/mL human epidermal growth factor for the indicated times afterwards. Protein kinase B (AKT) and extracellular regulated protein kinases (ERK) phosphorylation were detected by immunoblot analysis. Experimental data (black dots) are expressed as arbitrary units (a.u.) of four independent experiments (mean ± SE). Model predictions are indicated by cross symbols. EGF: Epidermal growth factor; pAKT: Phospho-AKT; pERK: Phosphomitogen-extracellular signal-regulated kinase.
- Citation: Lange F, Rateitschak K, Kossow C, Wolkenhauer O, Jaster R. Insights into erlotinib action in pancreatic cancer cells using a combined experimental and mathematical approach. World J Gastroenterol 2012; 18(43): 6226-6234
- URL: https://www.wjgnet.com/1007-9327/full/v18/i43/6226.htm
- DOI: https://dx.doi.org/10.3748/wjg.v18.i43.6226


