Copyright
©2012 Baishideng Publishing Group Co.
World J Gastroenterol. Oct 28, 2012; 18(40): 5753-5758
Published online Oct 28, 2012. doi: 10.3748/wjg.v18.i40.5753
Published online Oct 28, 2012. doi: 10.3748/wjg.v18.i40.5753
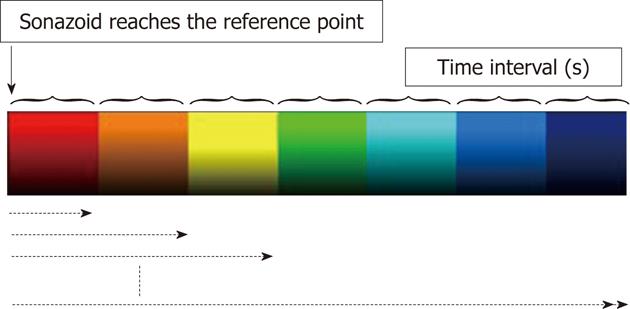
Figure 1 Delays in the arrival of the contrast agent at the target site compared with that at the reference point (0 s) are represented by red, orange, yellow, green, light blue, blue and dark blue at 0.
5 s intervals.
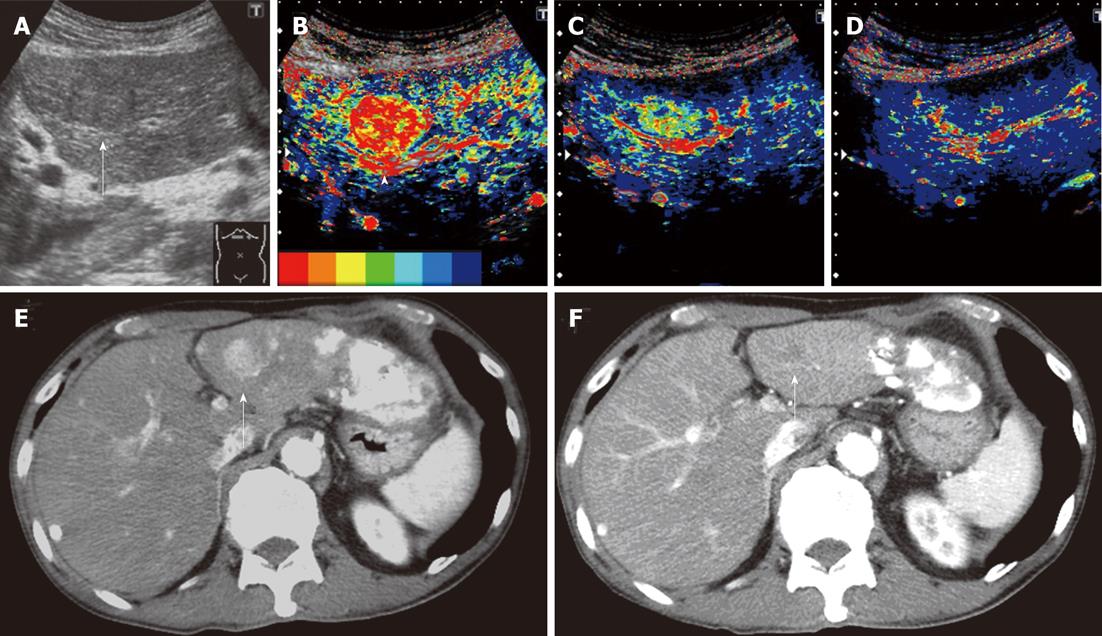
Figure 2 Clinical example of good responder patient.
A 74-year-old man with a history of hepatitis C virus cirrhosis underwent transcatheter arterial chemoembolization (TACE) for advanced hepatocellular carcinoma three times, after which sorafenib administration (400 mg/d) was started for this patient because the tumor was TACE-refractory. A: Gray-scale ultrasonography showed a mosaic-pattern tumor sized 20 mm in diameter in S3 (arrow). This tumor was established as a target lesion; B: A large artery near this tumor was regarded as starting point (arrow head). The color mapping (CM) image before the treatment showed primarily red or orange in the tumor; C: The CM image 2 wk after the treatment showed primarily green in the tumor; D: The CM image 4 wk after the treatment showed primarily dark blue in the tumor, the same as the surrounding parenchyma; E: Dynamic computed tomography (CT) scan in arterial phase before the treatment showed a hypervascular lesion in S3 (arrow) which was the target lesion and accumulation of iodized oil in the left lobe and S7; F: Dynamic CT scan in arterial phase 4 wk after the treatment showed a hypovascular lesion in S3 (arrow) and this lesion reduced. This therapeutic response was described as a partial response.
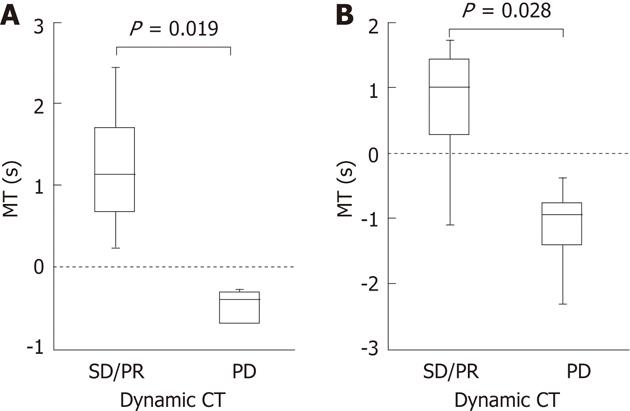
Figure 3 Comparisons between the mean time and therapeutic effects according to modified response evaluation criteria in solid tumors evaluated by dynamic computed tomography.
A: Median difference in the mean time (MT) was 1.13 s, 2 wk after the treatment in the 8 patients who showed stable disease (SD)/partial response (PR) on dynamic computed tomography (CT). Median difference in the MT was -0.39 s, 2 wk after the treatment in the 5 patients who showed progressive disease (PD); B: Median difference in the MT was 1.015 s, 4 wk after the treatment, in the 8 patients who showed SD/PR on dynamic CT. Median difference in the MT was -0.95 s 4 wk after the treatment in the 5 patients who showed PD. Differences in the median MT between SD/PR and PD groups were significant 2 and 4 wk after the treatment with P = 0.019 and P = 0.028, respectively.
- Citation: Shiozawa K, Watanabe M, Kikuchi Y, Kudo T, Maruyama K, Sumino Y. Evaluation of sorafenib for hepatocellular carcinoma by contrast-enhanced ultrasonography: A pilot study. World J Gastroenterol 2012; 18(40): 5753-5758
- URL: https://www.wjgnet.com/1007-9327/full/v18/i40/5753.htm
- DOI: https://dx.doi.org/10.3748/wjg.v18.i40.5753


