Copyright
©2012 Baishideng Publishing Group Co.
World J Gastroenterol. Oct 21, 2012; 18(39): 5570-5575
Published online Oct 21, 2012. doi: 10.3748/wjg.v18.i39.5570
Published online Oct 21, 2012. doi: 10.3748/wjg.v18.i39.5570
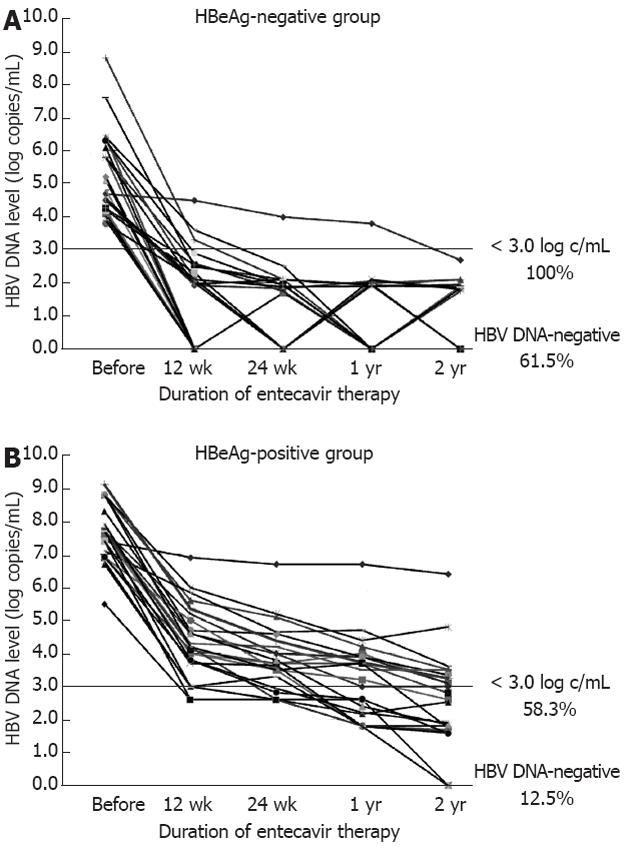
Figure 1 Hepatitis B virus DNA levels before and during entecavir therapy.
A: In the hepatitis B e antigen (HBeAg)-negative group, hepatitis B virus (HBV) DNA levels in all patients decreased to < 3.0 log copies/mL at year 2. Of these patients, 61.5% shown to be negative for HBV DNA by the real-time polymerase chain reaction method; B: In the HBeAg-positive group, 58.3% of patients (rapid-responders) showed < 3.0 log copies/mL at year 2, while 41.7% of patients (slow-responders) showed ≥ 3.0 log copies/mL. In addition, at year 2, only 12.5% of the patients were negative for HBV DNA.
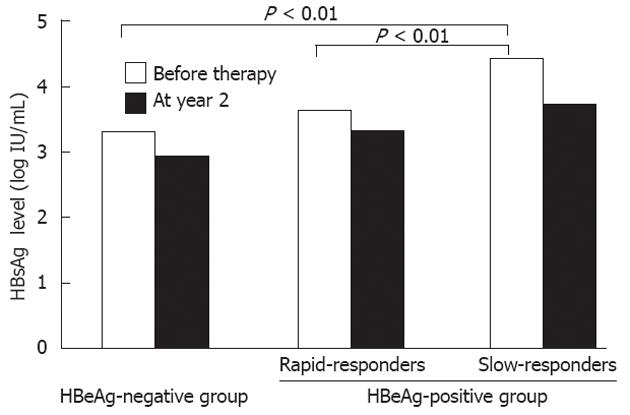
Figure 2 Median quantitative hepatitis B surface antigen levels among patients receiving entecavir therapy.
Quantitative hepatitis B surface antigen (HBsAg) levels (qHBsAg) levels in slow-responders in the HBeAg-positive group were significantly higher than those in rapid-responders and the hepatitis B e antigen (HBeAg)-negative group. The median qHBsAg level at year 2 in the slow-responders remained higher than in other groups.
- Citation: Orito E, Fujiwara K, Kanie H, Ban T, Yamada T, Hayashi K. Quantitation of HBsAg predicts response to entecavir therapy in HBV genotype C patients. World J Gastroenterol 2012; 18(39): 5570-5575
- URL: https://www.wjgnet.com/1007-9327/full/v18/i39/5570.htm
- DOI: https://dx.doi.org/10.3748/wjg.v18.i39.5570


